Races in Rosita North, Texas (TX) Detailed Stats
Ancestries, Foreign-born residents, place of birth

Discuss Rosita North, Texas races on our local forum with over 2,400,000 registered users
40.6% of Rosita North, TX residents are foreign-born (39.9% born in Latin America), which is 58.1% greater than the foreign-born rate of 17.0% across the entire state of Texas.
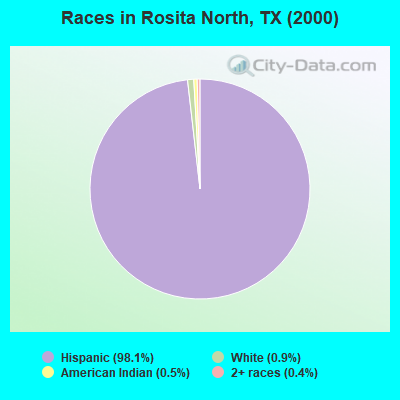
Race distribution in Rosita North

- 3,33798.1%Hispanic
- 300.9%White alone
- 180.5%American Indian alone
- 140.4%Two or more races
- 10.03%Black alone
2000
2022
-
- 10,933,31352.4%White alone
- 6,669,66632.0%Hispanic
- 2,364,25511.3%Black alone
- 554,4452.7%Asian alone
- 230,5671.1%Two or more races
- 68,8590.3%American Indian alone
- 19,9580.10%Other race alone
- 10,7570.05%Native Hawaiian and Other
Pacific Islander alone

-
- 12,070,64240.2%Hispanic
- 11,683,43038.9%White alone
- 3,508,70611.7%Black alone
- 1,608,1735.4%Asian alone
- 956,5603.2%Two or more races
- 125,7630.4%Other race alone
- 47,0230.2%American Indian alone
- 29,2750.10%Native Hawaiian and Other
Pacific Islander alone

Income and house value in Rosita North
- Median household income in 2022
- $73,978Native Hawaiian and other Pacific Islander householders
- $38,570Some other race householders
- $43,349Two or more races householders
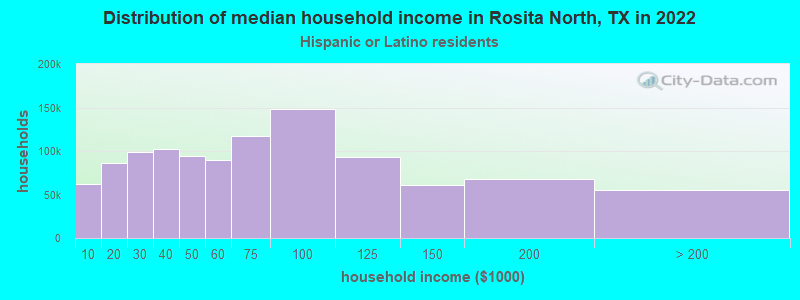
- $35,014Hispanic or Latino race householders
- Median 2022 house value
- $82,379Some other race householders
- $102,495Hispanic or Latino householders
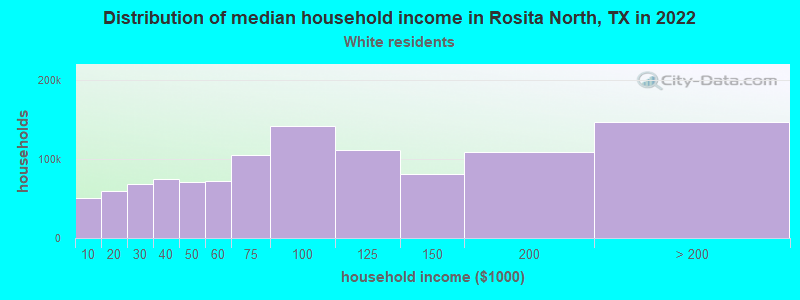
Household income for White non-Hispanic householders
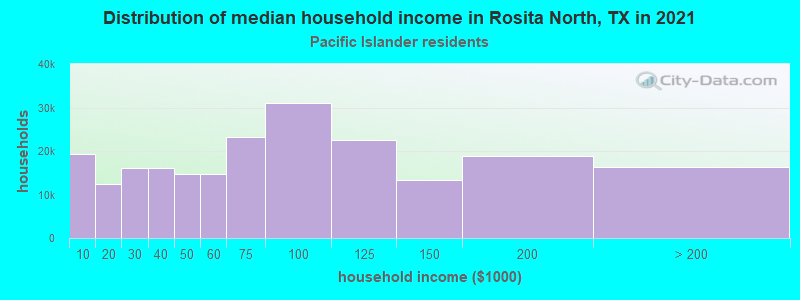
Household income for Native Hawaiian and other Pacific Islander householders
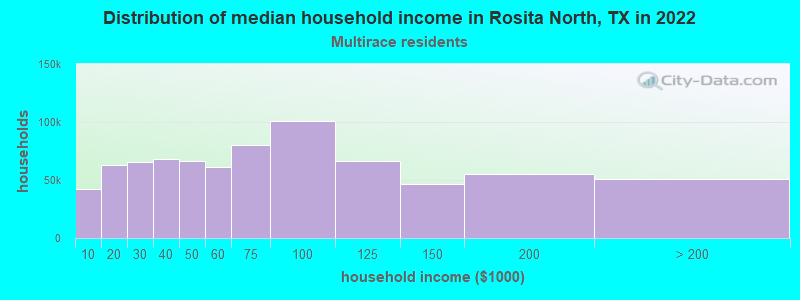
Household income for Two or more races householders
Household income for Hispanic or Latino race householders
Foreign-born residents in Rosita North
1,380 residents are foreign born (39.9% Latin America).
| This city: | 40.6% |
| Texas: | 13.9% |
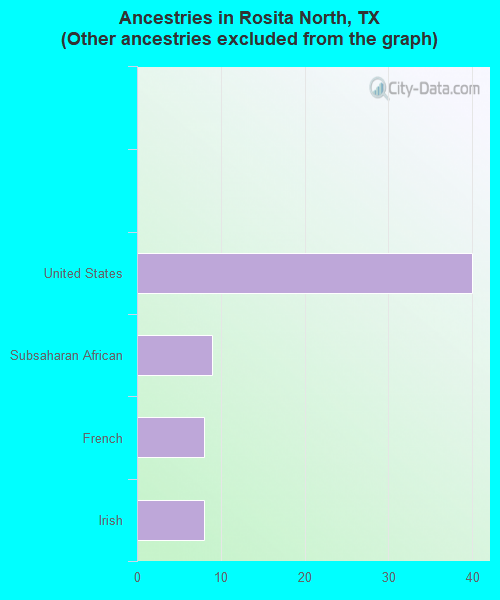
Ancestries in Rosita North

- 3,19998.0%Other
- 401.2%United States
- 90.3%Subsaharan African
- 80.2%French
- 80.2%Irish
Zip codes: 78852.