Races in Roswell, Georgia (GA) Detailed Stats
Data:
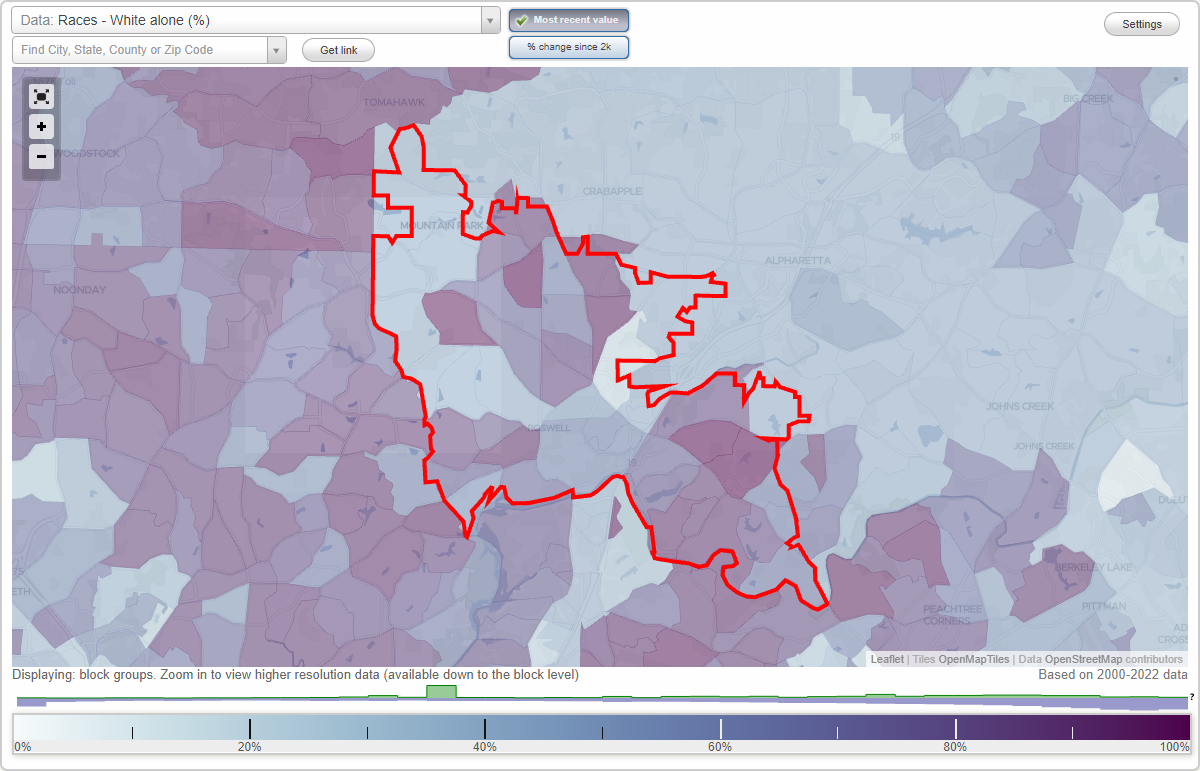
Races - White alone (%)
Races - White alone (% change since 2000)
Races - Black alone (%)
Races - Black alone (% change since 2000)
Races - American Indian alone (%)
Races - American Indian alone (% change since 2000)
Races - Asian alone (%)
Races - Asian alone (% change since 2000)
Races - Hispanic (%)
Races - Hispanic (% change since 2000)
Races - Native Hawaiian and Other Pacific Islander alone (%)
Races - Native Hawaiian and Other Pacific Islander alone (% change since 2000)
Races - Two or more races(%)
Races - Two or more races(% change since 2000)
Races - Other race alone (%)
Races - Other race alone (% change since 2000)
Racial diversity
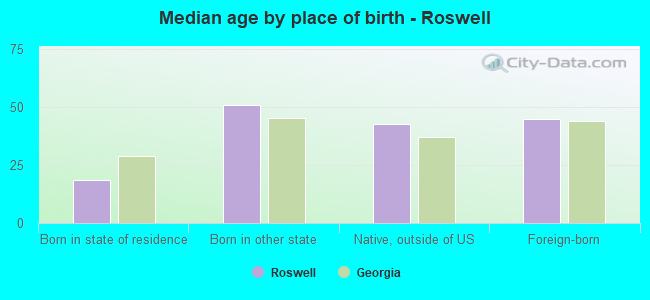
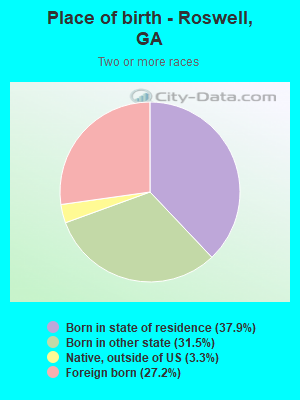
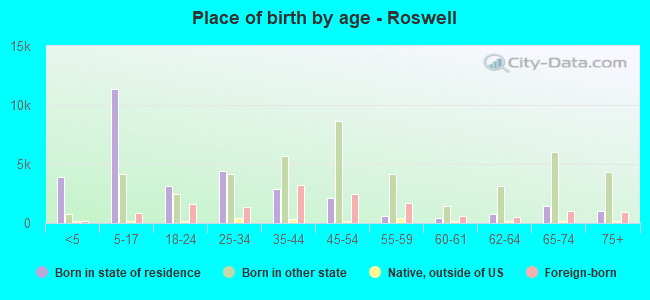
Place of birth - Born in state of residence (%)
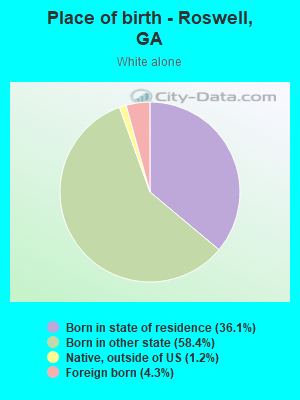
Place of birth - Born in state of residence (%) - White
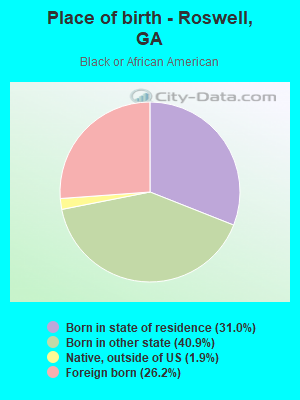
Place of birth - Born in state of residence (%) - Black or African American
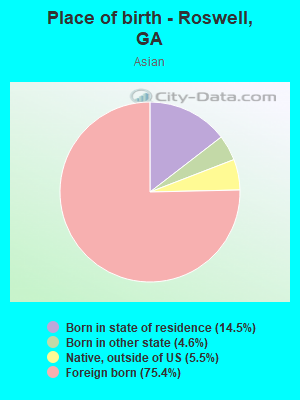
Place of birth - Born in state of residence (%) - Asian
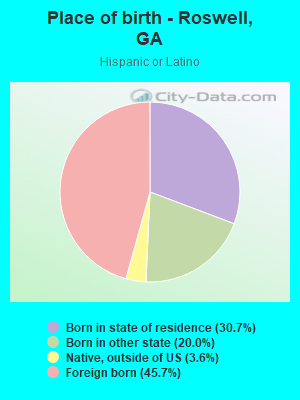
Place of birth - Born in state of residence (%) - Hispanic or Latino
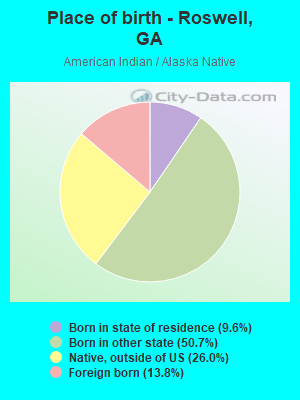
Place of birth - Born in state of residence (%) - American Indian and Alaska Native
Place of birth - Born in state of residence (%) - Multirace
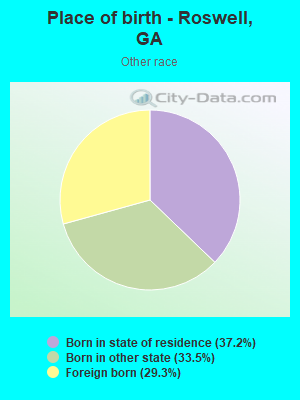
Place of birth - Born in state of residence (%) - Other Race
Place of birth - Born in other state (%)
Place of birth - Born in other state (%) - White
Place of birth - Born in other state (%) - Black or African American
Place of birth - Born in other state (%) - Asian
Place of birth - Born in other state (%) - Hispanic or Latino
Place of birth - Born in other state (%) - American Indian and Alaska Native
Place of birth - Born in other state (%) - Multirace
Place of birth - Born in other state (%) - Other Race
Place of birth - Native, outside of US (%)
Place of birth - Native, outside of US (%) - White
Place of birth - Native, outside of US (%) - Black or African American
Place of birth - Native, outside of US (%) - Asian
Place of birth - Native, outside of US (%) - Hispanic or Latino
Place of birth - Native, outside of US (%) - American Indian and Alaska Native
Place of birth - Native, outside of US (%) - Multirace
Place of birth - Native, outside of US (%) - Other Race
Place of birth - Foreign born (%)
Place of birth - Foreign born (%) - White
Place of birth - Foreign born (%) - Black or African American
Place of birth - Foreign born (%) - Asian
Place of birth - Foreign born (%) - Hispanic or Latino
Place of birth - Foreign born (%) - American Indian and Alaska Native
Place of birth - Foreign born (%) - Multirace
Place of birth - Foreign born (%) - Other Race
Residents speaking English at home (%)
Residents speaking English at home - Born in the United States (%)
Residents speaking English at home - Native, born elsewhere (%)
Residents speaking English at home - Foreign born (%)
Residents speaking Spanish at home (%)
Residents speaking Spanish at home - Born in the United States (%)
Residents speaking Spanish at home - Native, born elsewhere (%)
Residents speaking Spanish at home - Foreign born (%)
Residents speaking other language at home (%)
Residents speaking other language at home - Born in the United States (%)
Residents speaking other language at home - Native, born elsewhere (%)
Residents speaking other language at home - Foreign born (%)
Marital status - Never married (%)
Marital status - Now married (%)
Marital status - Separated (%)
Marital status - Widowed (%)
Marital status - Divorced (%)
Ancestries Reported - Arab (%)
Ancestries Reported - Czech (%)
Ancestries Reported - Danish (%)
Ancestries Reported - Dutch (%)
Ancestries Reported - English (%)
Ancestries Reported - French (%)
Ancestries Reported - French Canadian (%)
Ancestries Reported - German (%)
Ancestries Reported - Greek (%)
Ancestries Reported - Hungarian (%)
Ancestries Reported - Irish (%)
Ancestries Reported - Italian (%)
Ancestries Reported - Lithuanian (%)
Ancestries Reported - Norwegian (%)
Ancestries Reported - Polish (%)
Ancestries Reported - Portuguese (%)
Ancestries Reported - Russian (%)
Ancestries Reported - Scotch-Irish (%)
Ancestries Reported - Scottish (%)
Ancestries Reported - Slovak (%)
Ancestries Reported - Subsaharan African (%)
Ancestries Reported - Swedish (%)
Ancestries Reported - Swiss (%)
Ancestries Reported - Ukrainian (%)
Ancestries Reported - United States (%)
Ancestries Reported - Welsh (%)
Ancestries Reported - West Indian (%)
Ancestries Reported - Other (%)
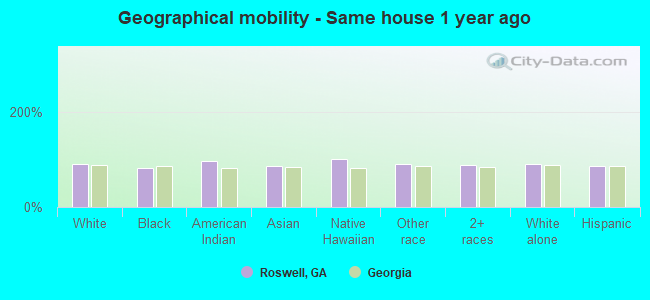
Geographical mobility - Same house 1 year ago (%)
Geographical mobility - Same house 1 year ago (%) - White
Geographical mobility - Same house 1 year ago (%) - Black or African American
Geographical mobility - Same house 1 year ago (%) - Asian
Geographical mobility - Same house 1 year ago (%) - Hispanic or Latino
Geographical mobility - Same house 1 year ago (%) - American Indian and Alaska Native
Geographical mobility - Same house 1 year ago (%) - Multirace
Geographical mobility - Same house 1 year ago (%) - Other Race
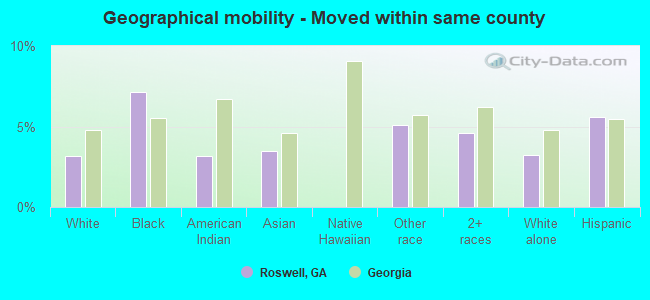
Geographical mobility - Moved within same county (%)
Geographical mobility - Moved within same county (%) - White
Geographical mobility - Moved within same county (%) - Black or African American
Geographical mobility - Moved within same county (%) - Asian
Geographical mobility - Moved within same county (%) - Hispanic or Latino
Geographical mobility - Moved within same county (%) - American Indian and Alaska Native
Geographical mobility - Moved within same county (%) - Multirace
Geographical mobility - Moved within same county (%) - Other Race
Geographical mobility - Moved from different county within same state (%)
Geographical mobility - Moved from different county within same state (%) - White
Geographical mobility - Moved from different county within same state (%) - Black or African American
Geographical mobility - Moved from different county within same state (%) - Asian
Geographical mobility - Moved from different county within same state (%) - Hispanic or Latino
Geographical mobility - Moved from different county within same state (%) - American Indian and Alaska Native
Geographical mobility - Moved from different county within same state (%) - Multirace
Geographical mobility - Moved from different county within same state (%) - Other Race
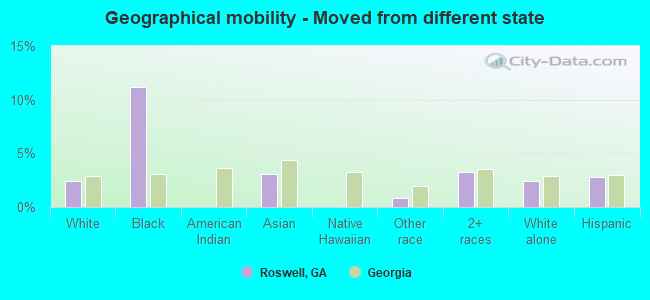
Geographical mobility - Moved from different state (%)
Geographical mobility - Moved from different state (%) - White
Geographical mobility - Moved from different state (%) - Black or African American
Geographical mobility - Moved from different state (%) - Asian
Geographical mobility - Moved from different state (%) - Hispanic or Latino
Geographical mobility - Moved from different state (%) - American Indian and Alaska Native
Geographical mobility - Moved from different state (%) - Multirace
Geographical mobility - Moved from different state (%) - Other Race
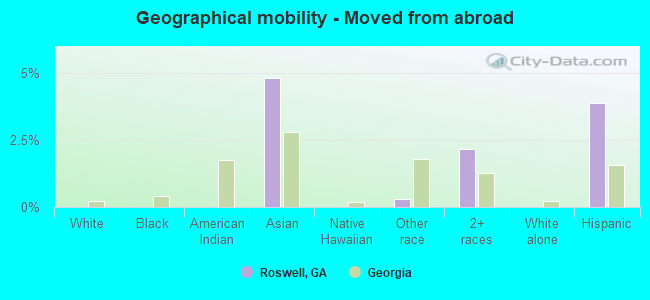
Geographical mobility - Moved from abroad (%)
Geographical mobility - Moved from abroad (%) - White
Geographical mobility - Moved from abroad (%) - Black or African American
Geographical mobility - Moved from abroad (%) - Asian
Geographical mobility - Moved from abroad (%) - Hispanic or Latino
Geographical mobility - Moved from abroad (%) - American Indian and Alaska Native
Geographical mobility - Moved from abroad (%) - Multirace
Geographical mobility - Moved from abroad (%) - Other Race
Place of birth for the foreign-born population - Ireland (%)
Place of birth for the foreign-born population - Denmark (%)
Place of birth for the foreign-born population - Norway (%)
Place of birth for the foreign-born population - Sweden (%)
Place of birth for the foreign-born population - United Kingdom (%)
Place of birth for the foreign-born population - England (%)
Place of birth for the foreign-born population - Scotland (%)
Place of birth for the foreign-born population - Other Northern Europe (%)
Place of birth for the foreign-born population - Austria (%)
Place of birth for the foreign-born population - Belgium (%)
Place of birth for the foreign-born population - France (%)
Place of birth for the foreign-born population - Germany (%)
Place of birth for the foreign-born population - Netherlands (%)
Place of birth for the foreign-born population - Switzerland (%)
Place of birth for the foreign-born population - Other Western Europe (%)
Place of birth for the foreign-born population - Greece (%)
Place of birth for the foreign-born population - Italy (%)
Place of birth for the foreign-born population - Portugal (%)
Place of birth for the foreign-born population - Spain (%)
Place of birth for the foreign-born population - Other Southern Europe (%)
Place of birth for the foreign-born population - Albania (%)
Place of birth for the foreign-born population - Belarus (%)
Place of birth for the foreign-born population - Bosnia and Herzegovina (%)
Place of birth for the foreign-born population - Bulgaria (%)
Place of birth for the foreign-born population - Croatia (%)
Place of birth for the foreign-born population - Czechoslovakia (%)
Place of birth for the foreign-born population - Hungary (%)
Place of birth for the foreign-born population - Latvia (%)
Place of birth for the foreign-born population - Lithuania (%)
Place of birth for the foreign-born population - North Macedonia (Macedonia) (%)
Place of birth for the foreign-born population - Moldova (%)
Place of birth for the foreign-born population - Poland (%)
Place of birth for the foreign-born population - Romania (%)
Place of birth for the foreign-born population - Russia (%)
Place of birth for the foreign-born population - Serbia (%)
Place of birth for the foreign-born population - Ukraine (%)
Place of birth for the foreign-born population - Other Eastern Europe (%)
Place of birth for the foreign-born population - China (%)
Place of birth for the foreign-born population - Hong Kong (%)
Place of birth for the foreign-born population - Taiwan (%)
Place of birth for the foreign-born population - Japan (%)
Place of birth for the foreign-born population - Korea (%)
Place of birth for the foreign-born population - Other Eastern Asia (%)
Place of birth for the foreign-born population - Afghanistan (%)
Place of birth for the foreign-born population - Bangladesh (%)
Place of birth for the foreign-born population - India (%)
Place of birth for the foreign-born population - Iran (%)
Place of birth for the foreign-born population - Kazakhstan (%)
Place of birth for the foreign-born population - Nepal (%)
Place of birth for the foreign-born population - Pakistan (%)
Place of birth for the foreign-born population - Sri Lanka (%)
Place of birth for the foreign-born population - Uzbekistan (%)
Place of birth for the foreign-born population - Other South Central Asia (%)
Place of birth for the foreign-born population - Burma (%)
Place of birth for the foreign-born population - Cambodia (%)
Place of birth for the foreign-born population - Indonesia (%)
Place of birth for the foreign-born population - Laos (%)
Place of birth for the foreign-born population - Malaysia (%)
Place of birth for the foreign-born population - Philippines (%)
Place of birth for the foreign-born population - Singapore (%)
Place of birth for the foreign-born population - Thailand (%)
Place of birth for the foreign-born population - Vietnam (%)
Place of birth for the foreign-born population - Other South Eastern Asia (%)
Place of birth for the foreign-born population - Armenia (%)
Place of birth for the foreign-born population - Iraq (%)
Place of birth for the foreign-born population - Israel (%)
Place of birth for the foreign-born population - Jordan (%)
Place of birth for the foreign-born population - Kuwait (%)
Place of birth for the foreign-born population - Lebanon (%)
Place of birth for the foreign-born population - Saudi Arabia (%)
Place of birth for the foreign-born population - Syria (%)
Place of birth for the foreign-born population - Turkey (%)
Place of birth for the foreign-born population - Yemen (%)
Place of birth for the foreign-born population - Other Western Asia (%)
Place of birth for the foreign-born population - Eritrea (%)
Place of birth for the foreign-born population - Ethiopia (%)
Place of birth for the foreign-born population - Kenya (%)
Place of birth for the foreign-born population - Somalia (%)
Place of birth for the foreign-born population - Uganda (%)
Place of birth for the foreign-born population - Zimbabwe (%)
Place of birth for the foreign-born population - Other Eastern Africa (%)
Place of birth for the foreign-born population - Cameroon (%)
Place of birth for the foreign-born population - Congo (%)
Place of birth for the foreign-born population - Democratic Republic of Congo (Zaire) (%)
Place of birth for the foreign-born population - Other Middle Africa (%)
Place of birth for the foreign-born population - Egypt (%)
Place of birth for the foreign-born population - Morocco (%)
Place of birth for the foreign-born population - Sudan (%)
Place of birth for the foreign-born population - Other Northern Africa (%)
Place of birth for the foreign-born population - South Africa (%)
Place of birth for the foreign-born population - Other Southern Africa (%)
Place of birth for the foreign-born population - Cabo Verde (%)
Place of birth for the foreign-born population - Ghana (%)
Place of birth for the foreign-born population - Liberia (%)
Place of birth for the foreign-born population - Nigeria (%)
Place of birth for the foreign-born population - Senegal (%)
Place of birth for the foreign-born population - Sierra Leone (%)
Place of birth for the foreign-born population - Other Western Africa (%)
Place of birth for the foreign-born population - Australia (%)
Place of birth for the foreign-born population - New Zealand (%)
Place of birth for the foreign-born population - Fiji (%)
Place of birth for the foreign-born population - Micronesia (%)
Place of birth for the foreign-born population - Bahamas (%)
Place of birth for the foreign-born population - Barbados (%)
Place of birth for the foreign-born population - Cuba (%)
Place of birth for the foreign-born population - Dominica (%)
Place of birth for the foreign-born population - Dominican Republic (%)
Place of birth for the foreign-born population - Grenada (%)
Place of birth for the foreign-born population - Haiti (%)
Place of birth for the foreign-born population - Jamaica (%)
Place of birth for the foreign-born population - St. Vincent and the Grenadines (%)
Place of birth for the foreign-born population - Trinidad and Tobago (%)
Place of birth for the foreign-born population - West Indies (%)
Place of birth for the foreign-born population - Other Caribbean (%)
Place of birth for the foreign-born population - Belize (%)
Place of birth for the foreign-born population - Costa Rica (%)
Place of birth for the foreign-born population - El Salvador (%)
Place of birth for the foreign-born population - Guatemala (%)
Place of birth for the foreign-born population - Honduras (%)
Place of birth for the foreign-born population - Mexico (%)
Place of birth for the foreign-born population - Nicaragua (%)
Place of birth for the foreign-born population - Panama (%)
Place of birth for the foreign-born population - Other Central America (%)
Place of birth for the foreign-born population - Argentina (%)
Place of birth for the foreign-born population - Bolivia (%)
Place of birth for the foreign-born population - Brazil (%)
Place of birth for the foreign-born population - Chile (%)
Place of birth for the foreign-born population - Colombia (%)
Place of birth for the foreign-born population - Ecuador (%)
Place of birth for the foreign-born population - Guyana (%)
Place of birth for the foreign-born population - Peru (%)
Place of birth for the foreign-born population - Uruguay (%)
Place of birth for the foreign-born population - Venezuela (%)
Place of birth for the foreign-born population - Other South America (%)
Place of birth for the foreign-born population - Canada (%)
Place of birth for the foreign-born population - Other Northern America (%)
Place of birth for the foreign-born population - Other (%)
Latest news about races in Roswell, GA collected exclusively by city-data.com from local newspapers, TV, and radio stations
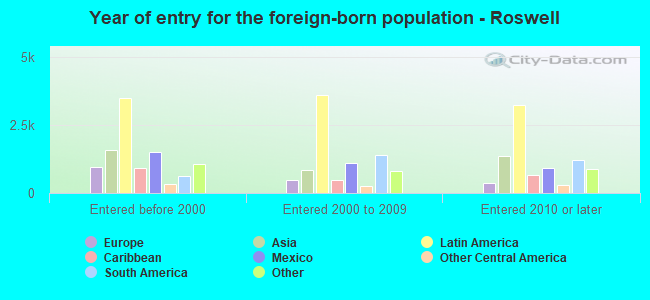
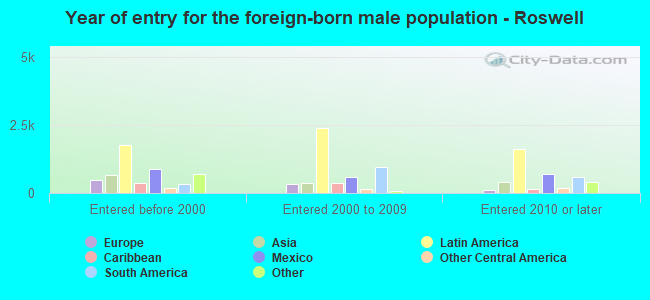
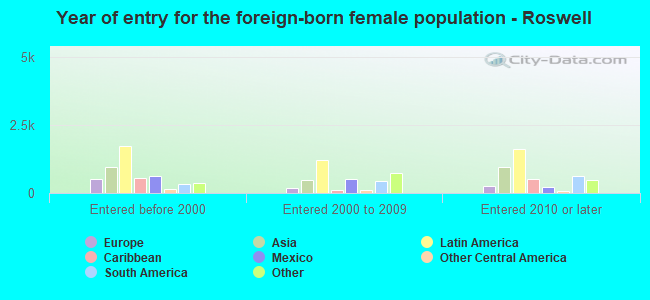
According to 2022 data, the most numerous races in Roswell, GA are White alone (60,397 residents), Black alone (10,265 residents), and Hispanic (9,161 residents). 82.2% of Roswell residents speak English at home. 19.9% of Roswell, GA residents are foreign-born (10.4% born in Latin America, 4.4% born in Asia), which is 49.8% greater than the foreign-born rate of 10.0% across the entire state of Georgia.
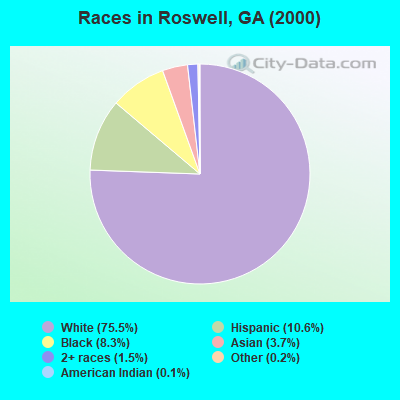
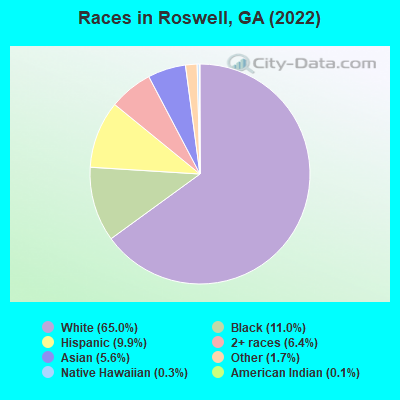
Race distribution in Roswell
2000 2022
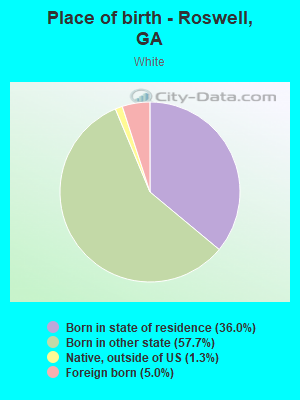
59,870 75.5% White alone 8,421 10.6% Hispanic 6,620 8.3% Black alone 2,932 3.7% Asian alone 1,167 1.5% Two or more races 194 0.2% Other race alone 107 0.1% American Indian alone 23 0.03% Native Hawaiian and Other
60,397 65.0% White alone 10,265 11.0% Black alone 9,161 9.9% Hispanic 5,948 6.4% Two or more races 5,203 5.6% Asian alone 1,589 1.7% Other race alone 284 0.3% Native Hawaiian and Other 98 0.1% American Indian alone
2000 2022
5,128,661 62.6% White alone 2,331,465 28.5% Black alone 435,227 5.3% Hispanic 171,513 2.1% Asian alone 87,364 1.1% Two or more races 17,670 0.2% American Indian alone 11,275 0.1% Other race alone 3,278 0.04% Native Hawaiian and Other
5,415,657 49.6% White alone 3,349,240 30.7% Black alone 1,132,604 10.4% Hispanic 479,156 4.4% Asian alone 462,923 4.2% Two or more races 54,416 0.5% Other race alone 11,923 0.1% American Indian alone 6,957 0.06% Native Hawaiian and Other
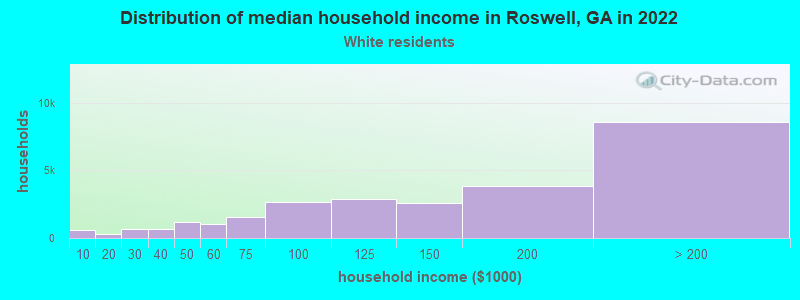
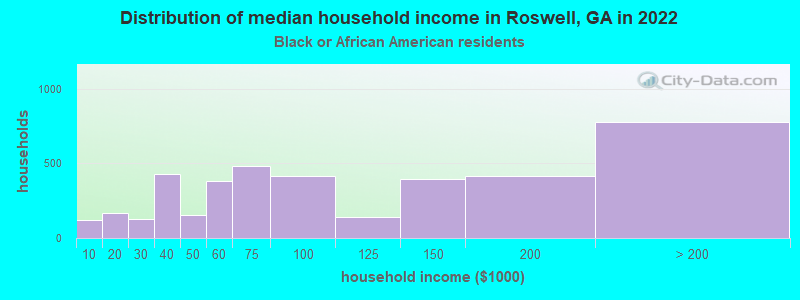
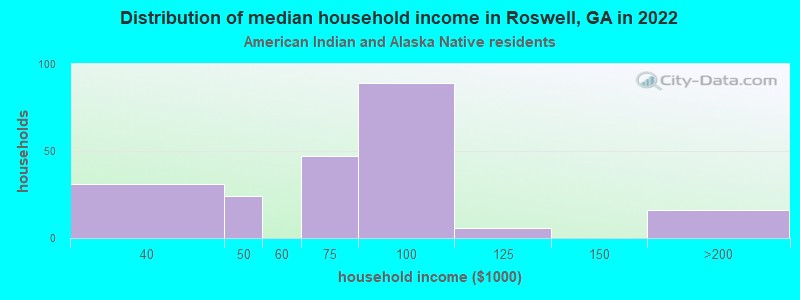
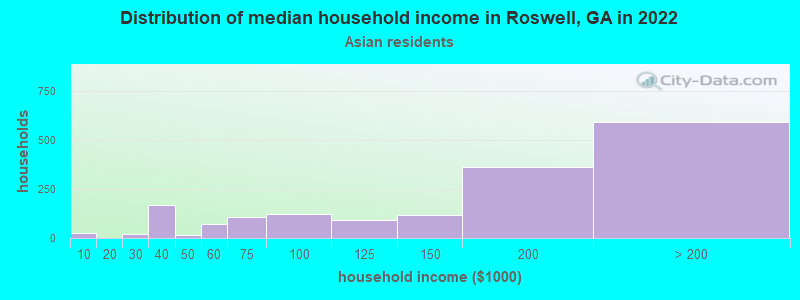
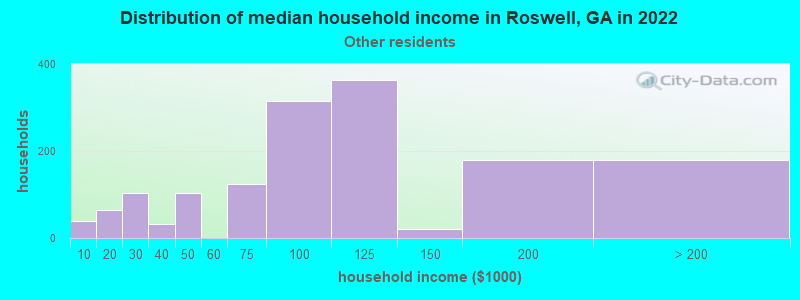
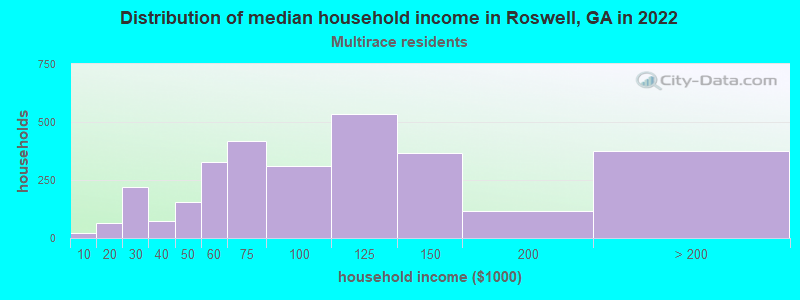
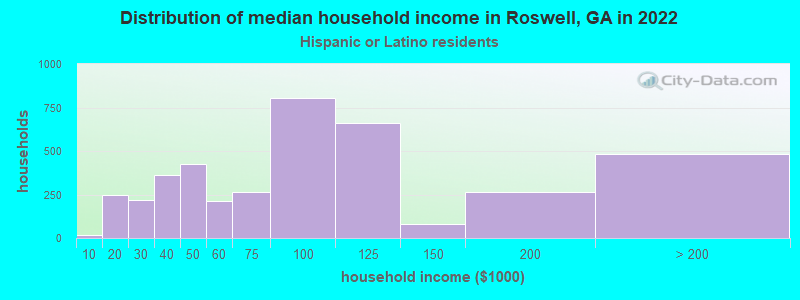
Income and house value in Roswell Median household income in 2022 $144,184 White non-Hispanic householders$91,535 Black householders$149,333 Asian householders$75,662 Some other race householders$103,019 Two or more races householders$88,866 Hispanic or Latino race householdersMedian 2022 house value $525,770 White Non-Hispanic householders$555,469 Black or African American householders$125,087 American Indian or Alaska Native householders $504,629 Asian householders$369,725 Some other race householders$618,894 Two or more races householders$397,914 Hispanic or Latino householders
Median age by race in Roswell
46.5 Median age for White residents46.1 46.9 32.3 Median age for Black or African American residents31.8 36.1 50.1 Median age for American Indian / Alaska Native residents33.2 -1,009,920,633.9 42.0 Median age for Asian residents47.4 41.4 -666,666,666.0 Median age for Native Hawaiian / Pacific Islander residents-666,666,666.0 -666,666,666.0 21.9 Median age for Other race residents21.9 27.1 22.1 Median age for Two or more races residents25.6 18.7 46.6 Median age for White alone residents46.1 47.0 34.3 Median age for Hispanic or Latino residents35.8 31.4
Owner/renter occupied households by race in Roswell
House owners and renters - White residents 21,434 80.5% Owner occupied5,183 19.5% Renter occupiedHouse owners and renters - Black or African American residents 1,594 49.9% Owner occupied1,599 50.1% Renter occupiedHouse owners and renters - American Indian / Alaska Native residents 31 12.8% Owner occupied211 87.2% Renter occupiedHouse owners and renters - Asian residents 1,510 88.6% Owner occupied194 11.4% Renter occupiedHouse owners and renters - Other race residents 517 61.9% Owner occupied318 38.1% Renter occupiedHouse owners and renters - Two or more races residents 1,341 54.6% Owner occupied1,117 45.4% Renter occupiedHouse owners and renters - White alone residents 21,074 80.8% Owner occupied5,012 19.2% Renter occupiedHouse owners and renters - Hispanic or Latino residents 1,420 57.3% Owner occupied1,059 42.7% Renter occupied
Language usage in Roswell
English speakers - Total 82.2% of residents of Roswell speak English at home.
8.7% of residents speak Spanish at home 4,282 56.0% Speak English very well3,368 44.0% Speak English less than very well9.2% of residents speak other language at home 5,388 66.7% Speak English very well2,696 33.3% Speak English less than very well
English speakers - Born in the United States 96.0% of residents of Roswell speak English at home.
2.9% of residents speak Spanish at home 968 75.0% Speak English very well323 25.0% Speak English less than very well1.0% of residents speak other language at home 224 49.0% Speak English very well233 51.0% Speak English less than very well
English speakers - Native, born elsewhere 76.9% of residents of Roswell speak English at home.
13.7% of residents speak Spanish at home 131 60.1% Speak English very well87 39.9% Speak English less than very well9.4% of residents speak other language at home 70 47.0% Speak English very well79 53.0% Speak English less than very well
English speakers - Foreign-born 26.2% of residents of Roswell speak English at home.
28.2% of residents speak Spanish at home 1,459 36.4% Speak English very well2,553 63.6% Speak English less than very well45.6% of residents speak other language at home 4,192 64.7% Speak English very well2,290 35.3% Speak English less than very well
White (Caucasian) - Speak only English Native:
97.1% (53,993)Foreign-born:
45.3% (1,388)
White (Caucasian) - Speak another language Native:
2.9% (1,590)Foreign-born:
54.7% (1,678)
Black or African American - Speak only English Native:
94.3% (6,897)Foreign-born:
49.5% (1,654)
Black or African American - Speak another language Native:
5.4% (392)Foreign-born:
50.6% (1,693)
American Indian / Alaska Native - Speak another language Native:
64.8% (100)Foreign-born:
100.0% (25)
Asian - Speak only English Native:
62.9% (772)Foreign-born:
8.8% (353)
Asian - Speak another language Native:
37.1% (455)Foreign-born:
91.2% (3,659)
Other race - Speak only English Native:
23.0% (1,153)Foreign-born:
8.2% (260)
Other race - Speak another language Native:
78.9% (3,950)Foreign-born:
91.4% (2,895)
Two or more races - Speak only English Native:
77.5% (5,527)Foreign-born:
12.3% (351)
Two or more races - Speak another language Native:
22.5% (1,608)Foreign-born:
87.7% (2,510)
White alone - Speak only English Native:
97.4% (53,479)Foreign-born:
53.8% (1,388)
White alone - Speak another language Native:
2.6% (1,411)Foreign-born:
46.2% (1,193)
Hispanic or Latino - Speak only English Native:
39.8% (1,925)Foreign-born:
4.1% (170)
Hispanic or Latino - Speak another language Native:
60.2% (2,912)Foreign-born:
95.9% (3,957)
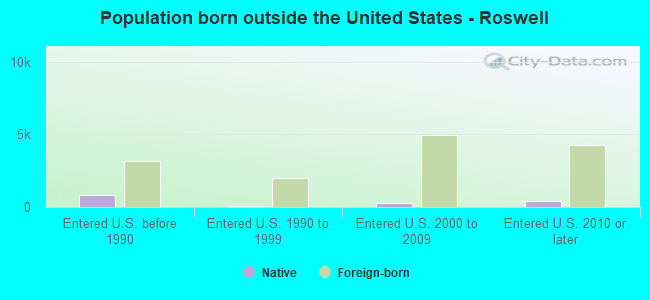
Foreign-born residents in Roswell 18,696 residents are foreign born (10.4% Latin America , 4.4% Asia ).
This city:
19.9%Georgia:
10.4%
Marital status for residents in Roswell Marital status - White (Caucasian) population 15 years and over
Males 25.5% Never married62.0% Now married0.0% Separated1.8% Widowed10.8% DivorcedFemales 23.3% Never married55.4% Now married0.7% Separated5.1% Widowed15.5% DivorcedWomen who gave birth in the past 12 months Now married:
100.0% (348)Unmarried:
0.0% (0)
Women who did not give birth in the past 12 months Now married:
51.4% (6,342)Unmarried:
48.6% (5,997)
Marital status - Black or African American population 15 years and over
Males 41.4% Never married36.3% Now married9.2% Separated0.0% Widowed13.2% DivorcedFemales 49.2% Never married18.7% Now married2.2% Separated6.7% Widowed23.2% DivorcedWomen who gave birth in the past 12 months Now married:
66.7% (161)Unmarried:
33.3% (81)
Women who did not give birth in the past 12 months Now married:
29.1% (963)Unmarried:
70.9% (2,351)
Marital status - American Indian / Alaska Native population 15 years and over
Males 67.3% Never married31.3% Now married1.4% Separated0.0% Widowed0.0% DivorcedFemales 0.0% Never married100.0% Now married0.0% Separated0.0% Widowed0.0% DivorcedWomen who did not give birth in the past 12 months Now married:
100.0% (30)Unmarried:
0.0% (0)
Marital status - Asian population 15 years and over
Males 28.9% Never married69.2% Now married0.0% Separated1.1% Widowed0.9% DivorcedFemales 16.9% Never married67.3% Now married6.8% Separated5.2% Widowed3.7% DivorcedWomen who gave birth in the past 12 months Now married:
100.0% (129)Unmarried:
0.0% (0)
Women who did not give birth in the past 12 months Now married:
62.6% (658)Unmarried:
37.4% (393)
Marital status - Other race population 15 years and over
Males 57.2% Never married33.9% Now married2.4% Separated2.5% Widowed4.0% DivorcedFemales 34.9% Never married47.7% Now married0.0% Separated0.0% Widowed17.3% DivorcedWomen who gave birth in the past 12 months Now married:
47.9% (68)Unmarried:
52.1% (74)
Women who did not give birth in the past 12 months Now married:
47.2% (1,041)Unmarried:
52.8% (1,166)
Marital status - Two or more races population 15 years and over
Males 55.8% Never married40.6% Now married0.0% Separated0.0% Widowed3.6% DivorcedFemales 55.7% Never married34.7% Now married1.6% Separated1.8% Widowed6.2% DivorcedWomen who gave birth in the past 12 months Now married:
31.4% (49)Unmarried:
68.6% (108)
Women who did not give birth in the past 12 months Now married:
26.4% (577)Unmarried:
73.6% (1,612)
Marital status - White alone, not Hispanic / Latino population 15 years and over
Males 24.9% Never married62.3% Now married0.0% Separated1.8% Widowed11.0% DivorcedFemales 23.3% Never married55.3% Now married0.8% Separated5.1% Widowed15.5% DivorcedWomen who gave birth in the past 12 months Now married:
100.0% (348)Unmarried:
0.0% (0)
Women who did not give birth in the past 12 months Now married:
51.3% (6,236)Unmarried:
48.7% (5,922)
Marital status - Hispanic or Latino population 15 years and over
Males 53.3% Never married35.4% Now married5.1% Separated0.8% Widowed5.4% DivorcedFemales 39.1% Never married45.5% Now married1.5% Separated2.3% Widowed11.6% DivorcedWomen who gave birth in the past 12 months Now married:
53.6% (78)Unmarried:
46.4% (68)
Women who did not give birth in the past 12 months Now married:
44.7% (1,806)Unmarried:
55.3% (2,235)
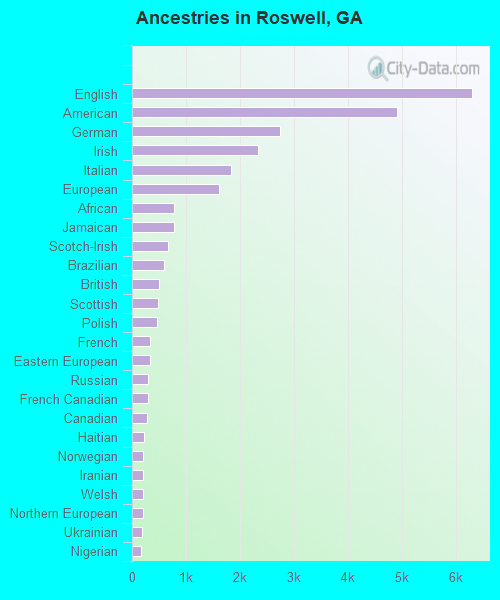
Ancestries in Roswell
6,299 12.9% English4,903 10.1% American2,742 5.6% German2,332 4.8% Irish1,827 3.8% Italian1,618 3.3% European784 1.6% African773 1.6% Jamaican675 1.4% Scotch-Irish593 1.2% Brazilian498 1.0% British483 1.0% Scottish468 1.0% Polish338 0.7% French338 0.7% Eastern European305 0.6% Russian291 0.6% French Canadian281 0.6% Canadian214 0.4% Haitian210 0.4% Norwegian207 0.4% Iranian204 0.4% Welsh204 0.4% Northern European183 0.4% Ukrainian168 0.3% Nigerian166 0.3% Czech148 0.3% Swedish135 0.3% Romanian128 0.3% Austrian108 0.2% Ghanaian105 0.2% Lebanese97 0.2% Trinidadian and Tobagonian86 0.2% Dutch83 0.2% Israeli73 0.1% Danish69 0.1% Hungarian69 0.1% Portuguese56 0.1% Lithuanian53 0.1% Greek53 0.1% Ethiopian53 0.1% Iraqi50 0.1% South African44 0.09% Turkish33 0.07% Alsatian30 0.06% Slovak29 0.06% Bulgarian24 0.05% Bahamian23 0.05% Swiss22 0.05% Croatian20 0.04% Kenyan20 0.04% Latvian18 0.04% Celtic18 0.04% Jordanian15 0.03% British West Indian13 0.03% Australian12 0.02% Czechoslovakian9 0.02% Guyanese8 0.02% Scandinavian8 0.02% Slavic7 0.01% Finnish7 0.01% Belgian7 0.01% Icelander
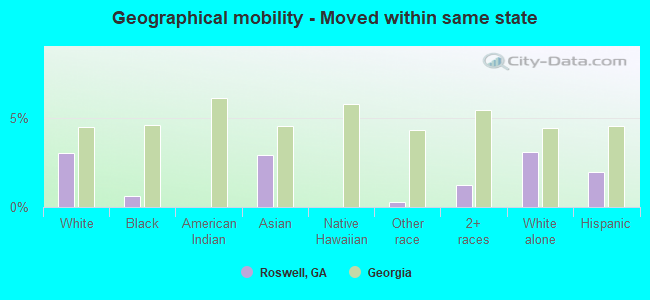
Geographical mobility in Roswell Same house 1 year ago 56,171 91.4% White (Caucasian)8,136 81.0% Black or African American194 97.2% American Indian / Alaska Native3,546 86.0% Asian25 100.0% Native Hawaiian / Pacific Islander7,674 90.1% Other race10,130 88.6% Two or more races54,913 91.2% White alone, not Hispanic / Latino13,178 85.9% Hispanic or LatinoMoved within same county 1,936 3.2% White / Caucasian719 7.2% Black or African American6 3.2% American Indian / Alaska Native144 3.5% Asian434 5.1% Other race526 4.6% Two or more races1,936 3.2% White alone, not Hispanic / Latino856 5.6% Hispanic or LatinoMoved within same state 1,859 3.0% White / Caucasian60 0.6% Black or African American120 2.9% Asian22 0.3% Other race141 1.2% Two or more races1,859 3.1% White alone, not Hispanic / Latino303 2.0% Hispanic or LatinoMoved from different state 1,475 2.4% White / Caucasian1,125 11.2% Black or African American128 3.1% Asian74 0.9% Other race376 3.3% Two or more races1,475 2.5% White alone, not Hispanic / Latino435 2.8% Hispanic or LatinoMoved from abroad 198 4.8% Asian27 0.3% Other race247 2.2% Two or more races594 3.9% Hispanic or Latino
Children Nativity (place of birth) in Roswell
Children under 6 years - Living with two parents Both parents native 2,874 100.0% NativeBoth parents foreign-born 529 89.8% Native60 10.2% Foreign-bornOne native, one foreign-born parent 414 100.0% NativeChildren under 6 years - Living with one parent Native parent 1,865 100.0% NativeForeign-born parent 167 100.0% NativeChildren 6 to 17 years - Living with two parents Both parents native 8,029 97.6% Native199 2.4% Foreign-bornBoth parents foreign-born 1,208 85.7% Native201 14.3% Foreign-bornOne native, one foreign-born parent 1,557 100.0% NativeChildren 6 to 17 years - Living with one parent Native parent 2,398 100.0% NativeForeign-born parent 1,013 64.7% Native552 35.3% Foreign-born
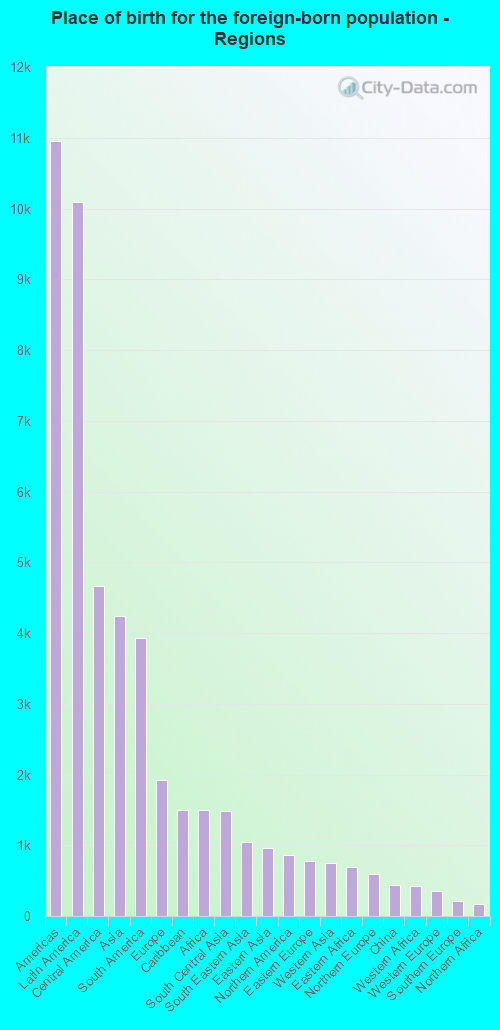
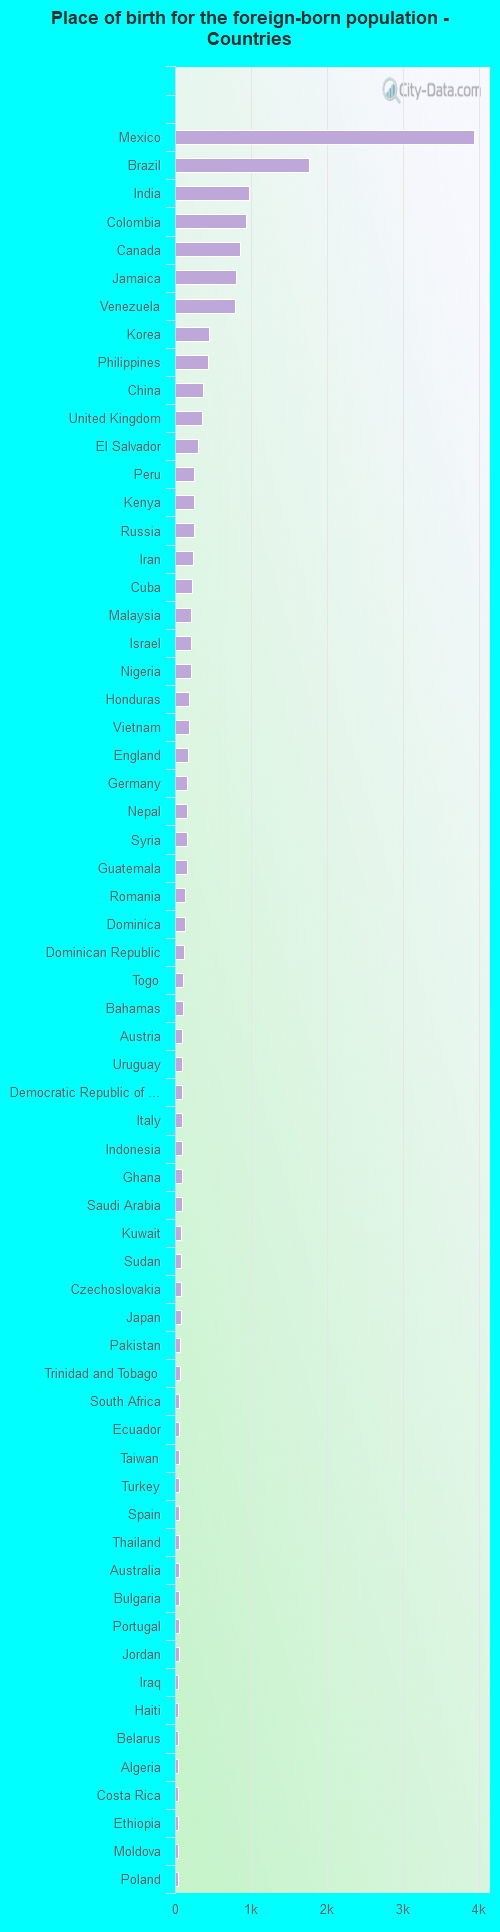
Place of birth for residents in Roswell 10,956 Americas10,097 Latin America4,668 Central America4,245 Asia3,925 South America1,921 Europe1,503 Caribbean1,499 Africa1,483 South Central Asia1,048 South Eastern Asia966 Eastern Asia858 Northern America774 Eastern Europe747 Western Asia692 Eastern Africa587 Northern Europe444 China428 Western Africa353 Western Europe205 Southern Europe175 Northern Africa95 Middle Africa74 Oceania58 Southern Africa53 Australia and New Zealand Subregion3,939 Mexico1,768 Brazil971 India939 Colombia858 Canada809 Jamaica793 Venezuela445 Korea438 Philippines363 China350 United Kingdom299 El Salvador247 Peru245 Kenya244 Russia239 Iran222 Cuba215 Malaysia207 Israel206 Nigeria190 Honduras188 Vietnam165 England162 Germany159 Nepal157 Syria152 Guatemala136 Romania128 Dominica112 Dominican Republic107 Togo103 Bahamas97 Austria97 Uruguay95 Democratic Republic of Congo (Zaire)91 Italy90 Indonesia89 Ghana86 Saudi Arabia83 Kuwait82 Sudan79 Czechoslovakia76 Japan67 Pakistan66 Trinidad and Tobago58 South Africa56 Ecuador54 Taiwan54 Turkey53 Spain53 Thailand53 Australia52 Bulgaria50 Portugal49 Jordan46 Iraq46 Haiti44 Belarus43 Algeria42 Costa Rica42 Ethiopia41 Moldova39 Poland35 Netherlands35 Tanzania33 Lebanon32 Ireland32 Burma (Myanmar)31 France27 Belgium27 Hong Kong26 Morocco25 Belize23 Bolivia21 Kazakhstan20 Singapore20 Micronesia18 Afghanistan18 Panama16 Ukraine16 Latvia15 Senegal14 Zimbabwe13 St. Vincent and the Grenadines13 Bosnia and Herzegovina10 Greece9 Ivory Coast9 Hungary8 Laos4 Uzbekistan4 Georgia
Grandparents responsible for own grandchildren in Roswell
Grandparents (30 to 59 years) White / Caucasian 62 25.6% Responsible for grandchildren180 74.4% Not responsible for grandchildrenBlack or African American 49 100.0% Not responsible for grandchildrenAsian 28 100.0% Responsible for grandchildrenOther race 37 100.0% Responsible for grandchildrenTwo or more races 30 100.0% Responsible for grandchildrenWhite alone, not Hispanic / Latino 63 39.6% Responsible for grandchildren97 60.4% Not responsible for grandchildrenHispanic or Latino 49 100.0% Responsible for grandchildrenGrandparents (60 years and over) White / Caucasian 26 7.1% Responsible for grandchildren338 92.9% Not responsible for grandchildrenBlack or African American 30 12.2% Responsible for grandchildren212 87.8% Not responsible for grandchildrenAsian 132 100.0% Not responsible for grandchildrenTwo or more races 30 100.0% Responsible for grandchildrenWhite alone, not Hispanic / Latino 21 5.7% Responsible for grandchildren343 94.3% Not responsible for grandchildrenHispanic or Latino 43 46.0% Responsible for grandchildren51 54.0% Not responsible for grandchildren