Races in Rowe, Massachusetts (MA) Detailed Stats
Ancestries, Foreign-born residents, place of birth

Recent posts about races in Rowe, Massachusetts on our local forum with over 2,400,000 registered users:
 | Man shot dead in Roslindale (64 replies) |
| Weekend in Boston questions (14 replies) |
| Transportation from Logan to Financial District (2 replies) |
| What to see/do on a brief visit (5 replies) |
| Please Help!!! Where to stay??? (5 replies) |
| Family fun in Boston (4 replies) |
3.4% of Rowe, MA residents are foreign-born (1.4% born in North America, 1.1% born in Latin America, 0.9% born in Europe), which is 426.5% less than the foreign-born rate of 18.0% across the entire state of Massachusetts.
Race distribution in Rowe

- 34798.9%White alone
- 41.1%Hispanic
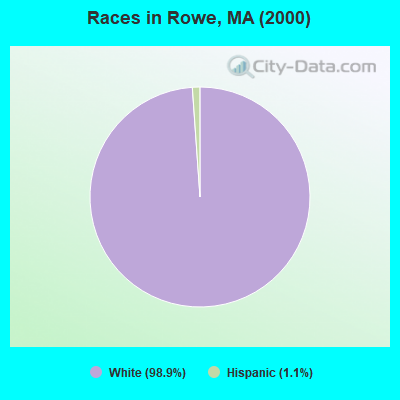
2000
2022
-
- 5,198,35981.9%White alone
- 428,7296.8%Hispanic
- 318,3295.0%Black alone
- 236,7863.7%Asian alone
- 110,3381.7%Two or more races
- 43,5860.7%Other race alone
- 11,2640.2%American Indian alone
- 1,7060.03%Native Hawaiian and Other
Pacific Islander alone

-
- 4,676,62767.0%White alone
- 911,03813.0%Hispanic
- 501,4637.2%Asian alone
- 459,7406.6%Black alone
- 341,8894.9%Two or more races
- 84,4031.2%Other race alone
- 5,8380.08%American Indian alone
- 9760.01%Native Hawaiian and Other
Pacific Islander alone

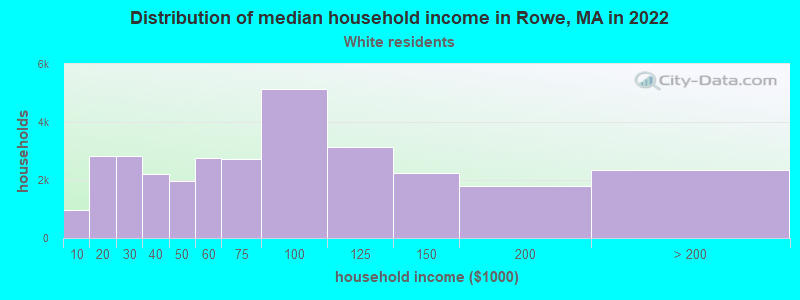
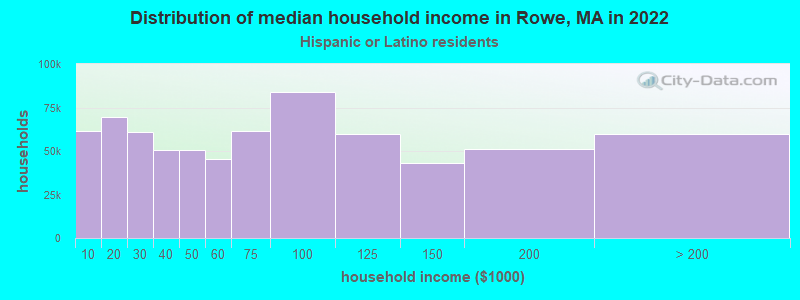
Income and house value in Rowe
- Median household income in 2022
- $73,069White non-Hispanic householders
- $142,921Hispanic or Latino race householders
- Median 2022 house value
- $302,445White Non-Hispanic householders
- $403,840Hispanic or Latino householders
Household income for White non-Hispanic householders
Household income for Hispanic or Latino race householders
Foreign-born residents in Rowe
12 residents are foreign born (1.4% North America, 1.1% Latin America, 0.9% Europe).
| This city: | 3.4% |
| Massachusetts: | 12.2% |
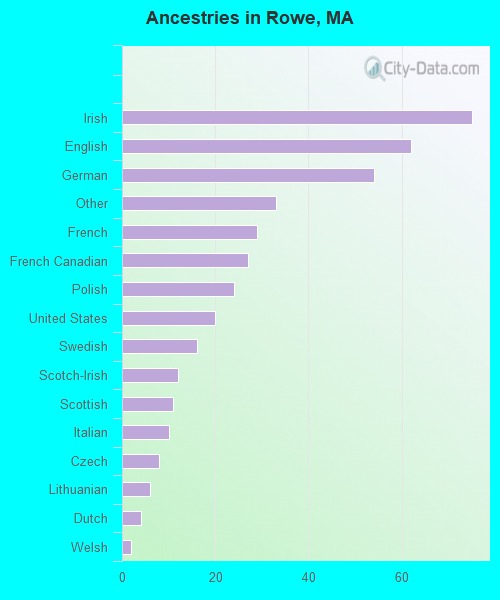
Ancestries in Rowe

- 7519.1%Irish
- 6215.8%English
- 5413.7%German
- 338.4%Other
- 297.4%French
- 276.9%French Canadian
- 246.1%Polish
- 205.1%United States
- 164.1%Swedish
- 123.1%Scotch-Irish
- 112.8%Scottish
- 102.5%Italian
- 82.0%Czech
- 61.5%Lithuanian
- 41.0%Dutch
- 20.5%Welsh
Zip codes: 01367.