Races in Rumney, New Hampshire (NH) Detailed Stats
Ancestries, Foreign-born residents, place of birth

Recent posts about races in Rumney, New Hampshire on our local forum with over 2,400,000 registered users:
 | Move to NH - Suggested Areas & Towns? (108 replies) |
| What's it like to live in or near Plymouth? (6 replies) |
| Relocating from FL to NH (65 replies) |
| Relocation to new hampshire (28 replies) |
| Places we must see? (13 replies) |
| N. H. doesn't exist anymore (92 replies) |
2.1% of Rumney, NH residents are foreign-born (1.3% born in Europe, 0.4% born in North America, 0.3% born in Asia), which is 138.7% less than the foreign-born rate of 5.0% across the entire state of New Hampshire.
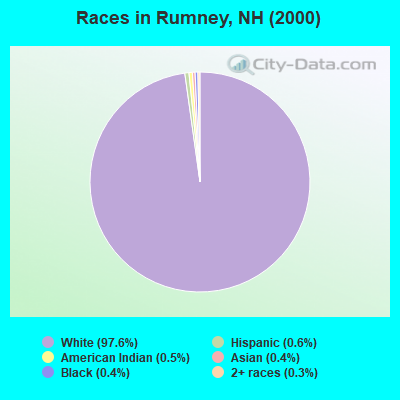
Race distribution in Rumney

- 1,44597.6%White alone
- 90.6%Hispanic
- 80.5%American Indian alone
- 60.4%Asian alone
- 60.4%Black alone
- 50.3%Two or more races
- 10.07%Native Hawaiian and Other
Pacific Islander alone
2000
2022
-
- 1,175,25295.1%White alone
- 20,4891.7%Hispanic
- 15,8031.3%Asian alone
- 11,6060.9%Two or more races
- 8,3540.7%Black alone
- 2,6980.2%American Indian alone
- 1,2540.1%Other race alone
- 3300.03%Native Hawaiian and Other
Pacific Islander alone

-
- 1,208,10186.6%White alone
- 63,4794.5%Hispanic
- 60,7244.4%Two or more races
- 36,5192.6%Asian alone
- 17,9311.3%Black alone
- 6,6150.5%Other race alone
- 1,0140.07%American Indian alone
- 8480.06%Native Hawaiian and Other
Pacific Islander alone

Income and house value in Rumney
- Median household income in 2022
- $74,214White non-Hispanic householders
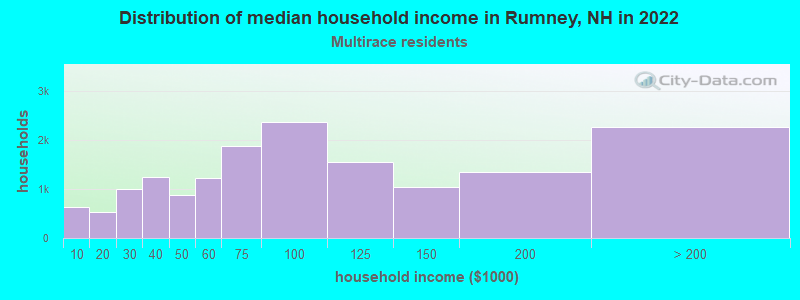
- $140,020Two or more races householders
- Median 2022 house value
- $291,176White Non-Hispanic householders
- $207,754Black or African American householders
- over $1,000,000American Indian or Alaska Native householders
- $271,679Two or more races householders
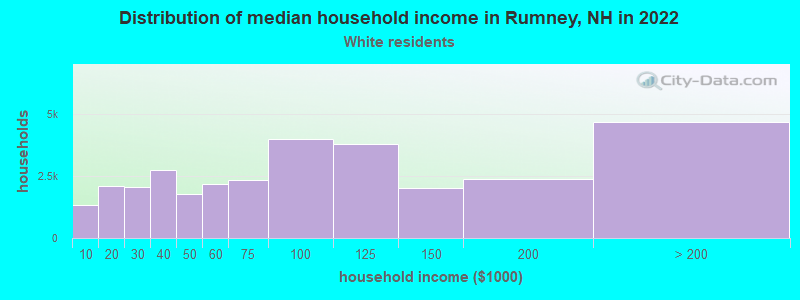
Household income for White non-Hispanic householders
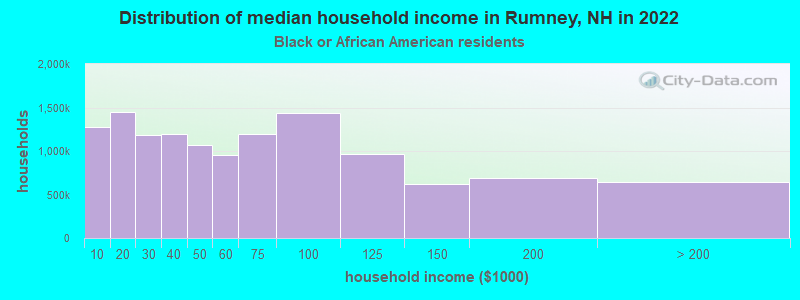
Household income for Black householders
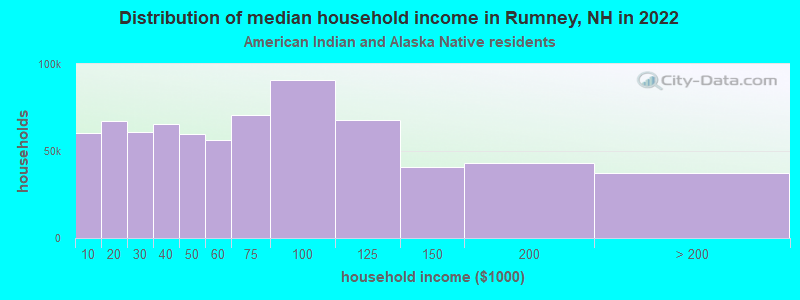
Household income for American Indian and Alaska Native householders
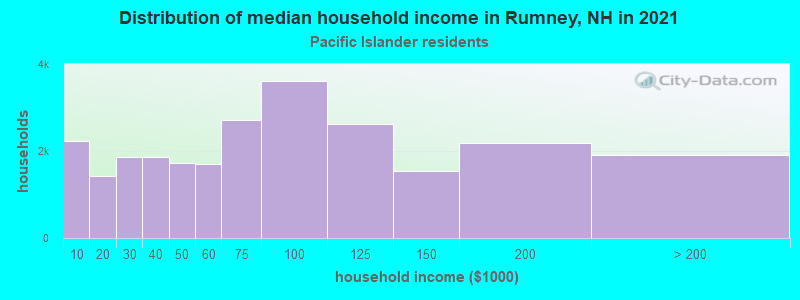
Household income for Native Hawaiian and other Pacific Islander householders
Household income for Two or more races householders
Foreign-born residents in Rumney
31 residents are foreign born (1.3% Europe, 0.4% North America, 0.3% Asia).
| This city: | 2.1% |
| New Hampshire: | 4.4% |
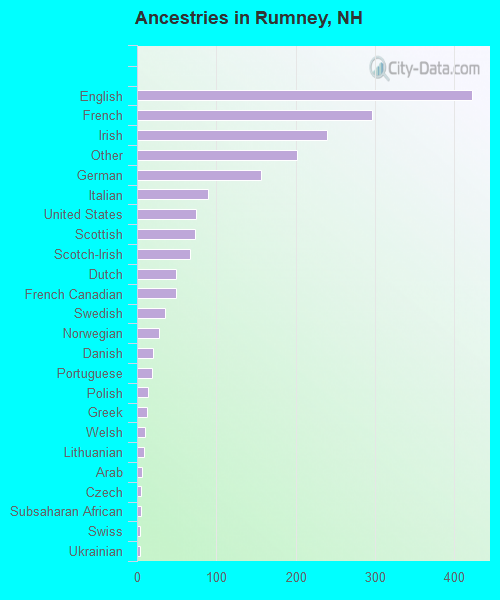
Ancestries in Rumney

- 42322.4%English
- 29715.7%French
- 24012.7%Irish
- 20210.7%Other
- 1578.3%German
- 894.7%Italian
- 754.0%United States
- 733.9%Scottish
- 673.5%Scotch-Irish
- 492.6%Dutch
- 492.6%French Canadian
- 351.8%Swedish
- 281.5%Norwegian
- 201.1%Danish
- 191.0%Portuguese
- 140.7%Polish
- 120.6%Greek
- 100.5%Welsh
- 90.5%Lithuanian
- 60.3%Arab
- 50.3%Czech
- 50.3%Subsaharan African
- 40.2%Swiss
- 40.2%Ukrainian
Zip codes: 03266.