Races in Santa Fe, Texas (TX) Detailed Stats
Ancestries, Foreign-born residents, place of birth
Settings
X


Recent posts about races in Santa Fe, Texas on our local forum with over 2,400,000 registered users:
 | *** School Shooting in Santa Fe - Casualties Reported *** (105 replies) |
| How hard is it to resell a house in Santa Fe, Texas? (0 replies) |
| Texas 2nd most hated state (171 replies) |
| Ted Cruz Flies to Mexico, Escapes the Blackout (94 replies) |
| Why does San Antonio seem like an afterthought compared to the other 3 Texas metros? (107 replies) |
| Man Look at UPTOWN DALLAS. (237 replies) |
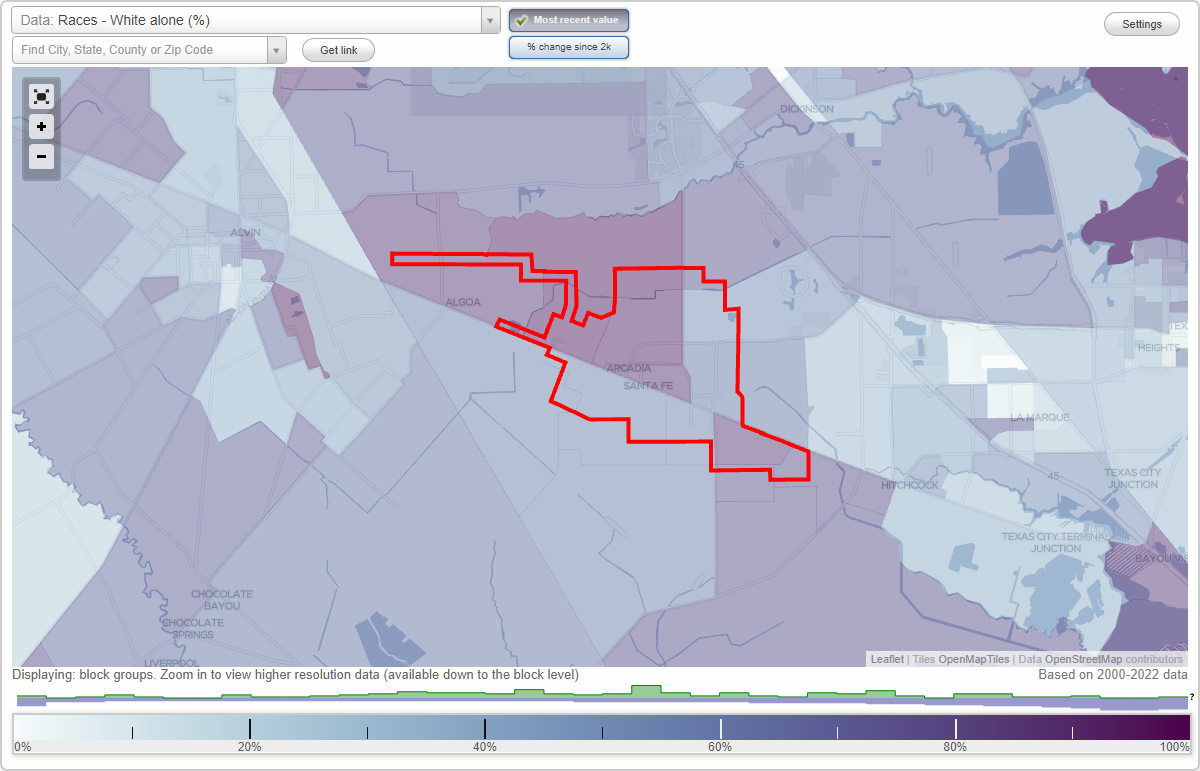
According to 2022 data, the most numerous races in Santa Fe, TX are Hispanic (2,836 residents), White alone (8,987 residents), and Black alone (8 residents). 89.0% of Santa Fe residents speak English at home. 4.2% of Santa Fe, TX residents are foreign-born (2.8% born in Latin America, 1.2% born in Asia), which is 300.3% less than the foreign-born rate of 17.0% across the entire state of Texas.
Race distribution in Santa Fe
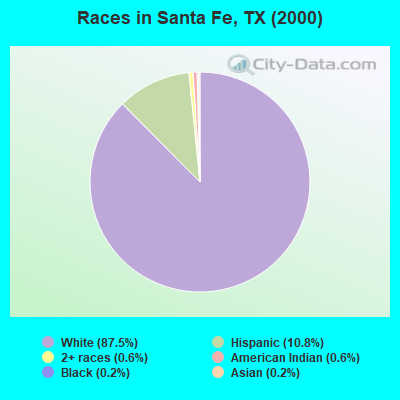
2000
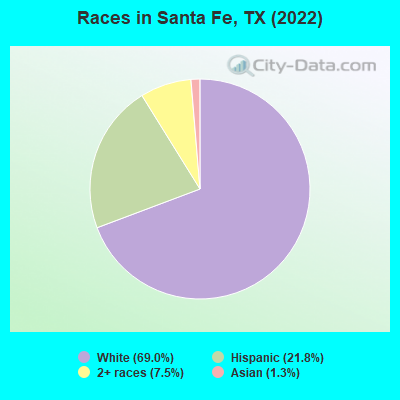
2022

- 8,35787.5%White alone
- 1,02910.8%Hispanic
- 590.6%Two or more races
- 540.6%American Indian alone
- 230.2%Black alone
- 220.2%Asian alone
- 30.03%Other race alone
- 10.01%Native Hawaiian and Other
Pacific Islander alone
-
- 8,98769.0%White alone
- 2,83621.8%Hispanic
- 9787.5%Two or more races
- 1631.3%Asian alone
- 110.08%American Indian alone
- 80.06%Black alone
2000
2022
-
- 10,933,31352.4%White alone
- 6,669,66632.0%Hispanic
- 2,364,25511.3%Black alone
- 554,4452.7%Asian alone
- 230,5671.1%Two or more races
- 68,8590.3%American Indian alone
- 19,9580.10%Other race alone
- 10,7570.05%Native Hawaiian and Other
Pacific Islander alone

-
- 12,070,64240.2%Hispanic
- 11,683,43038.9%White alone
- 3,508,70611.7%Black alone
- 1,608,1735.4%Asian alone
- 956,5603.2%Two or more races
- 125,7630.4%Other race alone
- 47,0230.2%American Indian alone
- 29,2750.10%Native Hawaiian and Other
Pacific Islander alone

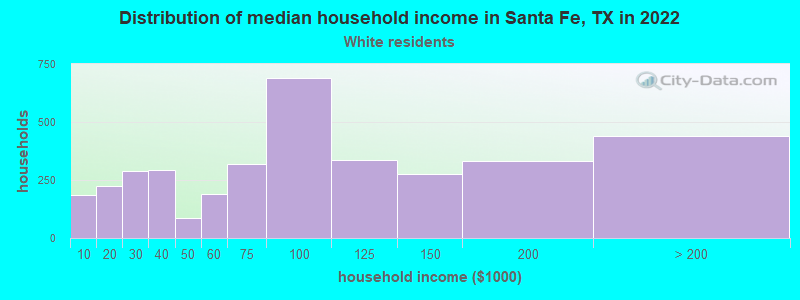
Income and house value in Santa Fe
- Median household income in 2022
- $83,388White non-Hispanic householders
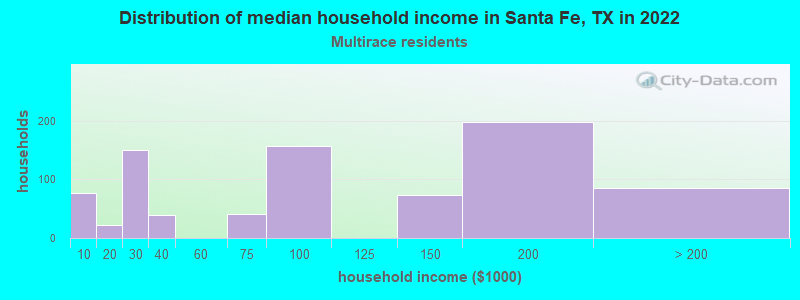
- $122,009Two or more races householders
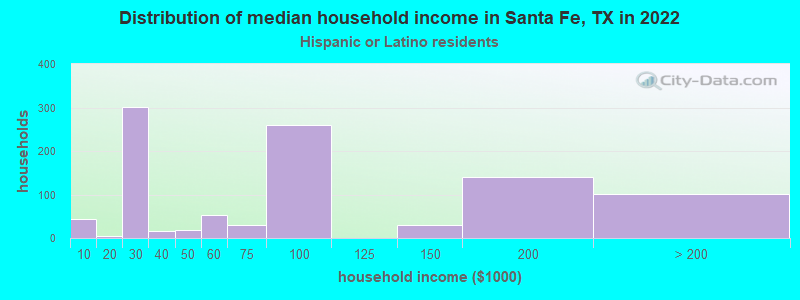
- $86,059Hispanic or Latino race householders
- Median 2022 house value
- $312,424White Non-Hispanic householders
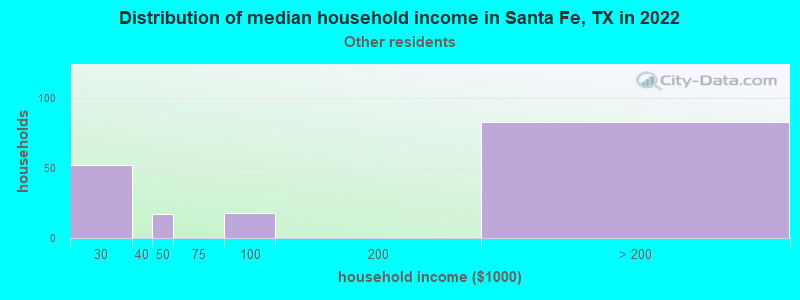
- $240,217Some other race householders
- $228,946Two or more races householders
- $220,140Hispanic or Latino householders
Household income for White non-Hispanic householders
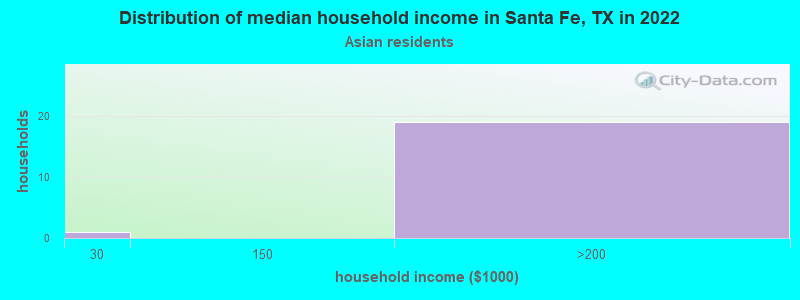
Household income for Asian householders
Household income for Some other race householders
Household income for Two or more races householders
Household income for Hispanic or Latino race householders
Median age by race in Santa Fe
- 44.4Median age for White residents
- 42.7Males
- 45.2Females
- 66.1Median age for Black or African American residents
- -636,455,185.7Males
- -737,967,913.7Females
- 42.3Median age for American Indian / Alaska Native residents
- -513,227,512.7Males
- 43.3Females
- 41.5Median age for Asian residents
- 29.1Males
- -725,085,909.9Females
- -581,560,283.1Median age for Native Hawaiian / Pacific Islander residents
- -612,729,233.5Males
- -577,777,777.2Females
- 33.9Median age for Other race residents
- 36.0Males
- 45.0Females
- 47.9Median age for Two or more races residents
- 48.8Males
- 50.1Females
- 42.9Median age for White alone residents
- 39.8Males
- 47.6Females
- 44.6Median age for Hispanic or Latino residents
- 47.9Males
- 38.5Females
Owner/renter occupied households by race in Santa Fe
- House owners and renters - White residents
- 3,12982.6%Owner occupied
- 65817.4%Renter occupied
- House owners and renters - American Indian / Alaska Native residents
- 25100.0%Owner occupied
- House owners and renters - Asian residents
- 1993.5%Owner occupied
- 16.5%Renter occupied
- House owners and renters - Other race residents
- 222100.0%Owner occupied
- House owners and renters - Two or more races residents
- 73585.5%Owner occupied
- 12414.5%Renter occupied
- House owners and renters - White alone residents
- 3,09482.0%Owner occupied
- 68018.0%Renter occupied
- House owners and renters - Hispanic or Latino residents
- 79584.7%Owner occupied
- 14315.3%Renter occupied
Language usage in Santa Fe
- English speakers - Total
- 89.0% of residents of Santa Fe speak English at home.
- 8.8% of residents speak Spanish at home
- 67662.0%Speak English very well
- 41438.0%Speak English less than very well
- 1.5% of residents speak other language at home
- 10960.2%Speak English very well
- 7239.8%Speak English less than very well
- English speakers - Born in the United States
- 95.6% of residents of Santa Fe speak English at home.
- 6.7% of residents speak Spanish at home
- 73.6%Speak English very well
- 18796.4%Speak English less than very well
- English speakers - Native, born elsewhere
- 52.5% of residents of Santa Fe speak English at home.
- 63.1% of residents speak Spanish at home
- 8545.7%Speak English very well
- 10154.3%Speak English less than very well
- English speakers - Foreign-born
- 31.6% of residents of Santa Fe speak English at home.
- 51.1% of residents speak Spanish at home
- 13845.0%Speak English very well
- 16955.0%Speak English less than very well
- 16.3% of residents speak other language at home
- 3333.7%Speak English very well
- 6566.3%Speak English less than very well
White (Caucasian) - Speak only English
| Native: | 100.0% (8,574) |
| Foreign-born: | 74.9% (102) |
White (Caucasian) - Speak another language
| Native: | 1.5% (130) |
| Foreign-born: | 42.2% (57) |
Asian - Speak only English
| Native: | 100.0% (11) |
| Foreign-born: | 38.7% (57) |
Two or more races - Speak only English
| Native: | 70.3% (1,637) |
| Foreign-born: | 7.4% (27) |
Two or more races - Speak another language
| Native: | 24.8% (578) |
| Foreign-born: | 92.5% (338) |
White alone - Speak only English
| Native: | 99.1% (8,339) |
| Foreign-born: | 99.4% (25) |
Hispanic or Latino - Speak only English
| Native: | 65.6% (1,487) |
| Foreign-born: | 25.4% (103) |
Hispanic or Latino - Speak another language
| Native: | 33.3% (754) |
| Foreign-born: | 75.0% (304) |
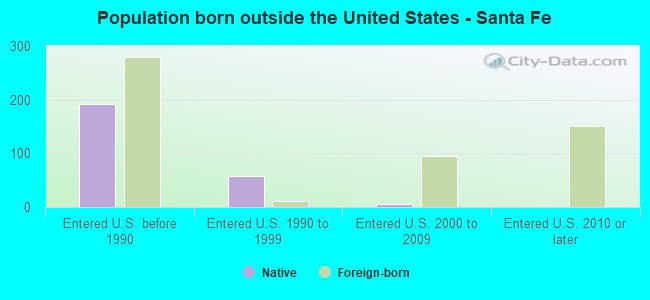
Foreign-born residents in Santa Fe
553 residents are foreign born (2.8% Latin America, 1.2% Asia).
| This city: | 4.2% |
| Texas: | 17.1% |
Marital status for residents in Santa Fe
Marital status - White (Caucasian) population 15 years and over
- Males
- 24.8%Never married
- 63.6%Now married
- 0.6%Separated
- 2.5%Widowed
- 8.5%Divorced
- Females
- 27.0%Never married
- 49.7%Now married
- 1.5%Separated
- 9.2%Widowed
- 12.4%Divorced
Women who gave birth in the past 12 months
| Now married: | 39.5% (51) |
| Unmarried: | 60.5% (78) |
Women who did not give birth in the past 12 months
| Now married: | 44.7% (952) |
| Unmarried: | 55.3% (1,178) |
Marital status - Black or African American population 15 years and over
- Males
- 0.0%Never married
- 100.0%Now married
- 0.0%Separated
- 0.0%Widowed
- 0.0%Divorced
- Females
- 0.0%Never married
- 0.0%Now married
- 0.0%Separated
- 50.0%Widowed
- 50.0%Divorced
Marital status - American Indian / Alaska Native population 15 years and over
- Males
- 100.0%Never married
- 0.0%Now married
- 0.0%Separated
- 0.0%Widowed
- 0.0%Divorced
- Females
- 58.6%Never married
- 24.1%Now married
- 0.0%Separated
- 17.2%Widowed
- 0.0%Divorced
Women who did not give birth in the past 12 months
| Now married: | 0.0% (0) |
| Unmarried: | 100.0% (24) |
Marital status - Asian population 15 years and over
- Males
- 63.4%Never married
- 36.6%Now married
- 0.0%Separated
- 0.0%Widowed
- 0.0%Divorced
- Females
- 0.0%Never married
- 100.0%Now married
- 0.0%Separated
- 0.0%Widowed
- 0.0%Divorced
Women who did not give birth in the past 12 months
| Now married: | 100.0% (71) |
| Unmarried: | 0.0% (0) |
Marital status - Other race population 15 years and over
- Males
- 72.8%Never married
- 27.2%Now married
- 0.0%Separated
- 0.0%Widowed
- 0.0%Divorced
- Females
- 51.1%Never married
- 45.4%Now married
- 0.0%Separated
- 3.5%Widowed
- 0.0%Divorced
Women who gave birth in the past 12 months
| Now married: | 100.0% (12) |
| Unmarried: | 0.0% (0) |
Women who did not give birth in the past 12 months
| Now married: | 0.0% (0) |
| Unmarried: | 100.0% (125) |
Marital status - Two or more races population 15 years and over
- Males
- 32.4%Never married
- 37.4%Now married
- 0.0%Separated
- 0.0%Widowed
- 30.2%Divorced
- Females
- 1.7%Never married
- 60.1%Now married
- 0.0%Separated
- 3.5%Widowed
- 34.8%Divorced
Women who did not give birth in the past 12 months
| Now married: | 69.1% (392) |
| Unmarried: | 30.9% (175) |
Marital status - White alone, not Hispanic / Latino population 15 years and over
- Males
- 24.8%Never married
- 64.2%Now married
- 0.7%Separated
- 1.0%Widowed
- 9.2%Divorced
- Females
- 23.5%Never married
- 51.8%Now married
- 0.6%Separated
- 10.5%Widowed
- 13.6%Divorced
Women who gave birth in the past 12 months
| Now married: | 39.5% (57) |
| Unmarried: | 60.5% (88) |
Women who did not give birth in the past 12 months
| Now married: | 47.4% (916) |
| Unmarried: | 52.6% (1,014) |
Marital status - Hispanic or Latino population 15 years and over
- Males
- 31.6%Never married
- 47.5%Now married
- 0.0%Separated
- 5.0%Widowed
- 15.8%Divorced
- Females
- 37.2%Never married
- 54.0%Now married
- 4.6%Separated
- 1.7%Widowed
- 2.6%Divorced
Women who gave birth in the past 12 months
| Now married: | 100.0% (7) |
| Unmarried: | 0.0% (0) |
Women who did not give birth in the past 12 months
| Now married: | 48.2% (393) |
| Unmarried: | 51.8% (421) |
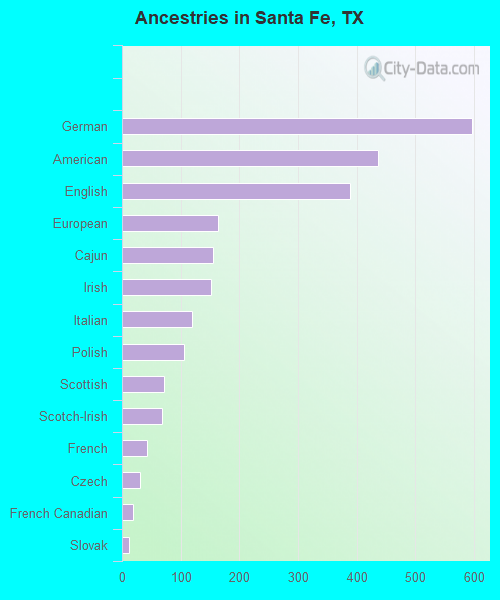
Ancestries in Santa Fe

- 59611.1%German
- 4368.1%American
- 3887.2%English
- 1633.0%European
- 1552.9%Cajun
- 1512.8%Irish
- 1192.2%Italian
- 1062.0%Polish
- 711.3%Scottish
- 681.3%Scotch-Irish
- 420.8%French
- 300.6%Czech
- 180.3%French Canadian
- 120.2%Slovak
- 20.04%Norwegian
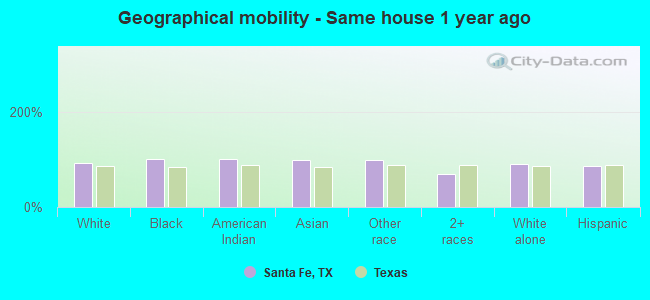
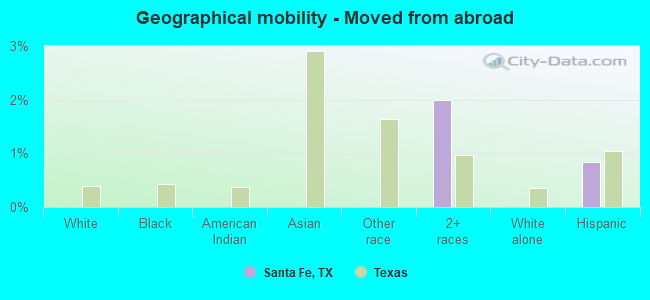
Geographical mobility in Santa Fe

- Same house 1 year ago
- 8,21291.9%White (Caucasian)
- 9100.0%Black or African American
- 78100.0%American Indian / Alaska Native
- 16699.3%Asian
- 75698.4%Other race
- 2,00068.6%Two or more races
- 8,09491.3%White alone, not Hispanic / Latino
- 2,41086.3%Hispanic or Latino
-
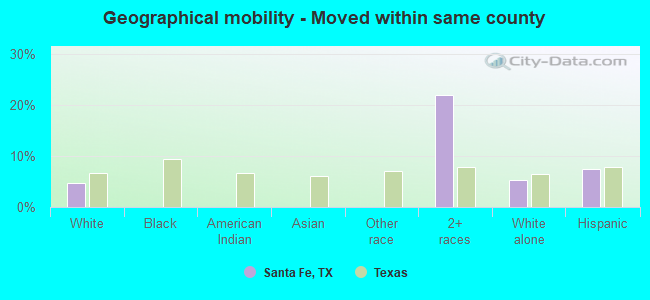
- Moved within same county
- 4234.7%White / Caucasian
- 63721.8%Two or more races
- 4755.4%White alone, not Hispanic / Latino
- 2067.4%Hispanic or Latino
-
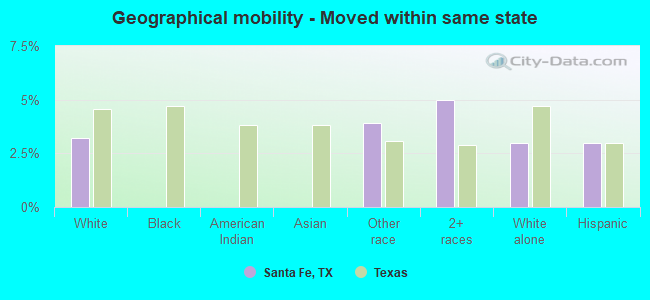
- Moved within same state
- 2863.2%White / Caucasian
- 303.9%Other race
- 1465.0%Two or more races
- 2623.0%White alone, not Hispanic / Latino
- 843.0%Hispanic or Latino
-
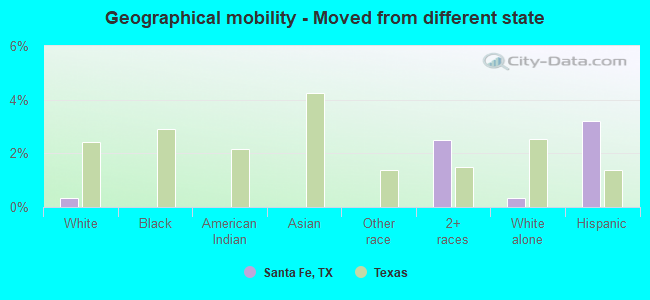
- Moved from different state
- 290.3%White / Caucasian
- 732.5%Two or more races
- 300.3%White alone, not Hispanic / Latino
- 893.2%Hispanic or Latino
-
- Moved from abroad
- 582.0%Two or more races
- 240.8%Hispanic or Latino
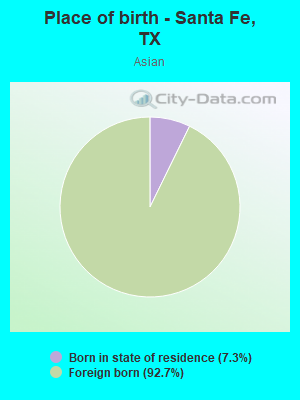
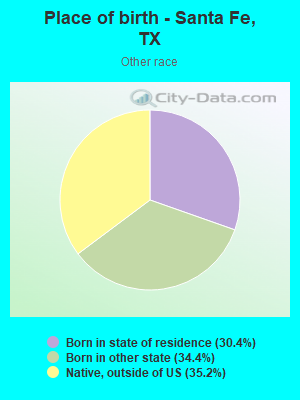
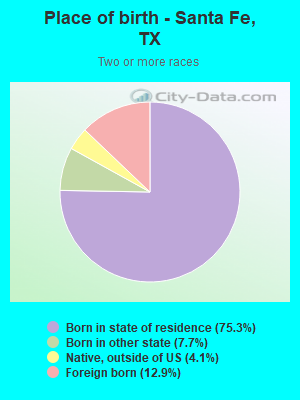
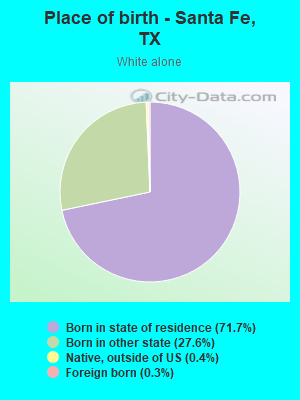
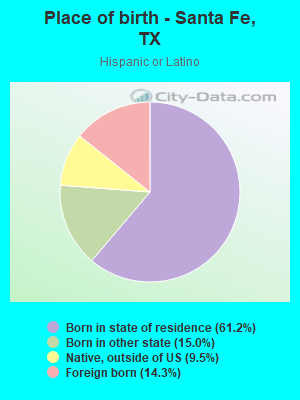
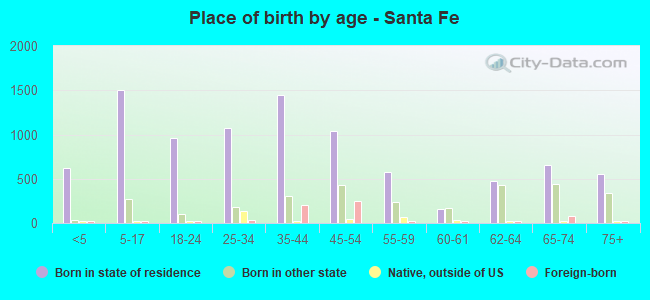
Children Nativity (place of birth) in Santa Fe
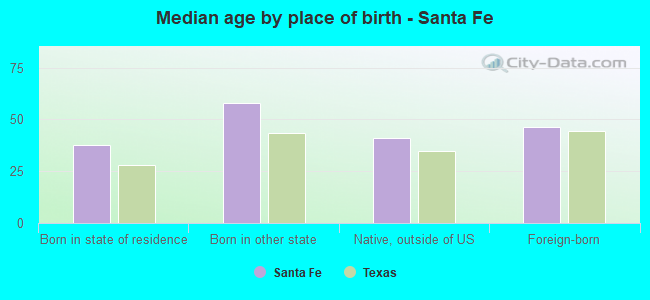
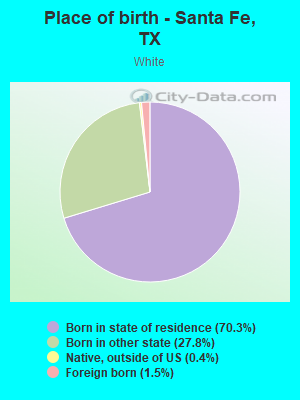
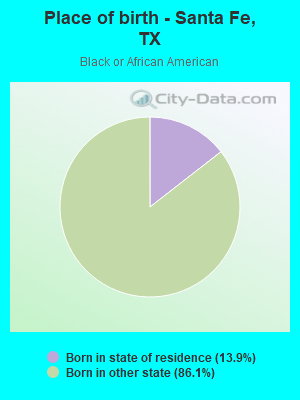
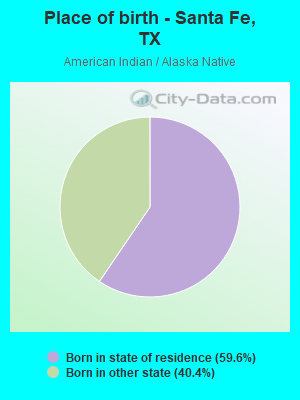
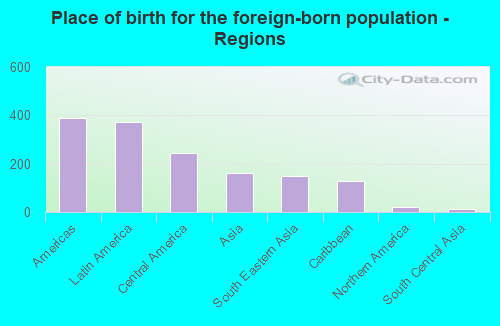
Place of birth for residents in Santa Fe
![Place of birth for the foreign-born population - Regions]()
- 391Americas
- 372Latin America
- 244Central America
- 161Asia
- 149South Eastern Asia
- 127Caribbean
- 19Northern America
- 11South Central Asia
- 1Eastern Asia
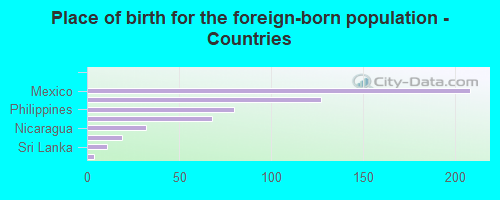
![Place of birth for the foreign-born population - Countries]()
- 208Mexico
- 127Cuba
- 80Philippines
- 68Thailand
- 32Nicaragua
- 19Canada
- 11Sri Lanka
- 4El Salvador
- 1Korea
Grandparents responsible for own grandchildren in Santa Fe
Zip codes: 77510.