Races in Shawangunk, New York (NY) Detailed Stats
Ancestries, Foreign-born residents, place of birth
4.4% of Shawangunk, NY residents are foreign-born (1.7% born in Europe, 1.6% born in Latin America, 0.7% born in Asia), which is 400.9% less than the foreign-born rate of 22.0% across the entire state of New York.
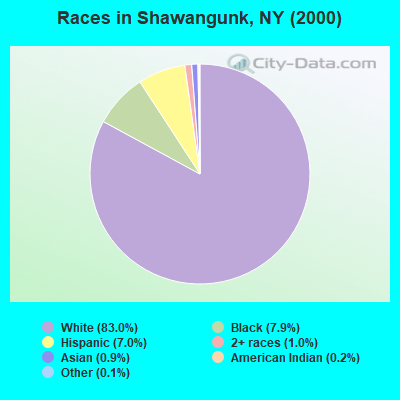
Race distribution in Shawangunk

- 9,97583.0%White alone
- 9457.9%Black alone
- 8377.0%Hispanic
- 1171.0%Two or more races
- 1070.9%Asian alone
- 260.2%American Indian alone
- 140.1%Other race alone
- 10.01%Native Hawaiian and Other
Pacific Islander alone
2000
2022
-
- 11,760,98162.0%White alone
- 2,867,58315.1%Hispanic
- 2,812,62314.8%Black alone
- 1,035,9265.5%Asian alone
- 366,1161.9%Two or more races
- 75,4990.4%Other race alone
- 52,4990.3%American Indian alone
- 5,2300.03%Native Hawaiian and Other
Pacific Islander alone

-
- 10,408,93352.9%White alone
- 3,867,29919.7%Hispanic
- 2,633,84013.4%Black alone
- 1,776,2869.0%Asian alone
- 732,6703.7%Two or more races
- 216,1101.1%Other race alone
- 35,0820.2%American Indian alone
- 6,9310.04%Native Hawaiian and Other
Pacific Islander alone

Income and house value in Shawangunk
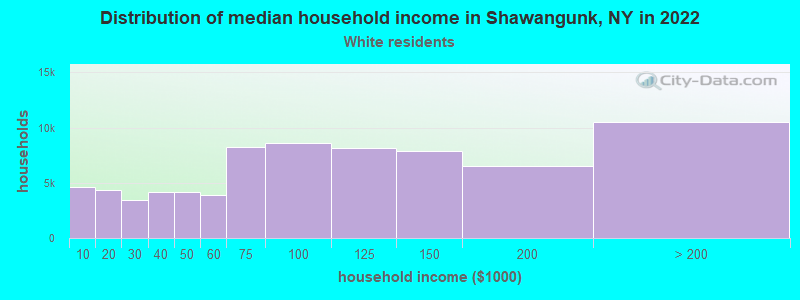
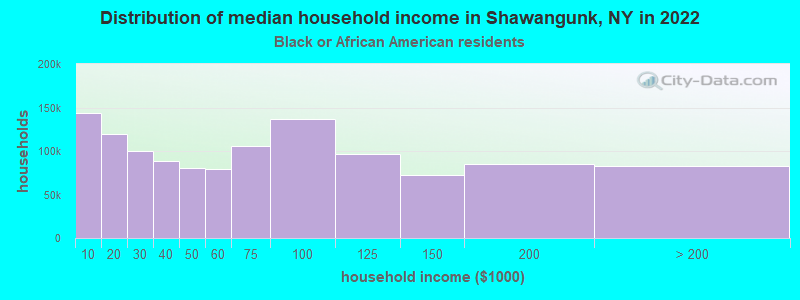
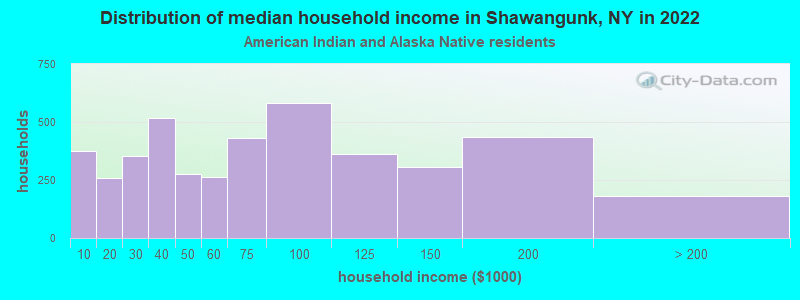
- Median household income in 2022
- $102,728White non-Hispanic householders
- $139,094Black householders
- $10,835American Indian and Alaska Native householders
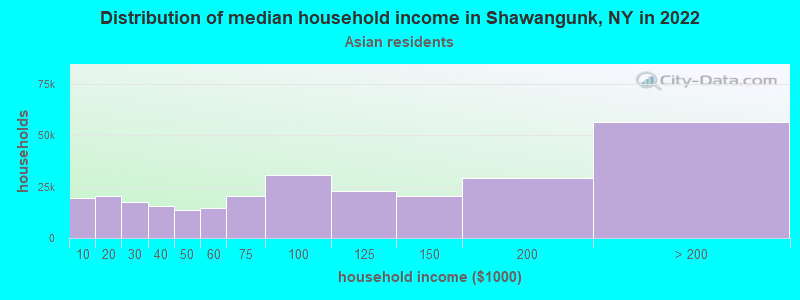
- $160,649Asian householders
- $73,678Some other race householders
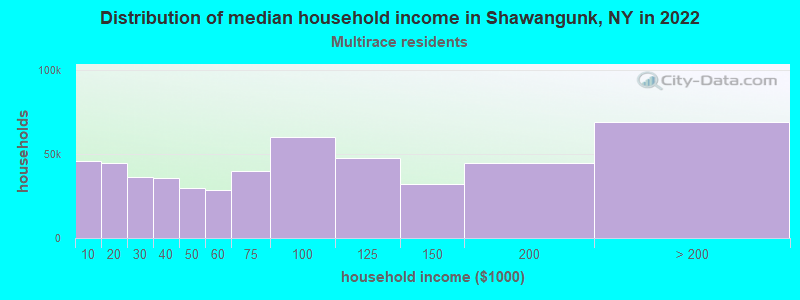
- $82,217Two or more races householders
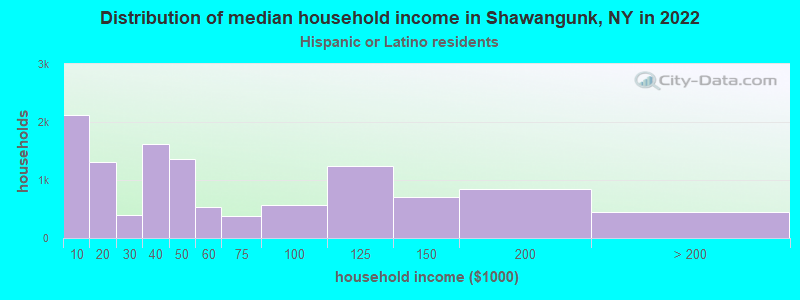
- $68,911Hispanic or Latino race householders
- Median 2022 house value
- $408,450White Non-Hispanic householders
- $485,544Black or African American householders
- $566,872Asian householders
- $415,706Two or more races householders
- $415,706Hispanic or Latino householders
Household income for White non-Hispanic householders
Household income for Black householders
Household income for American Indian and Alaska Native householders
Household income for Asian householders
Household income for Two or more races householders
Household income for Hispanic or Latino race householders
Foreign-born residents in Shawangunk
528 residents are foreign born (1.7% Europe, 1.6% Latin America, 0.7% Asia).
| This city: | 4.4% |
| New York: | 20.4% |
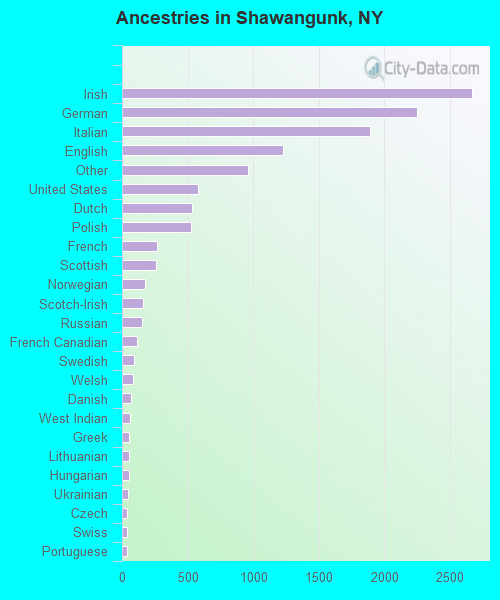
Ancestries in Shawangunk

- 2,66521.4%Irish
- 2,24918.1%German
- 1,89215.2%Italian
- 1,2259.8%English
- 9637.7%Other
- 5784.6%United States
- 5344.3%Dutch
- 5264.2%Polish
- 2692.2%French
- 2582.1%Scottish
- 1781.4%Norwegian
- 1591.3%Scotch-Irish
- 1521.2%Russian
- 1170.9%French Canadian
- 910.7%Swedish
- 830.7%Welsh
- 660.5%Danish
- 590.5%West Indian
- 540.4%Greek
- 540.4%Lithuanian
- 510.4%Hungarian
- 420.3%Ukrainian
- 410.3%Czech
- 400.3%Swiss
- 370.3%Portuguese
- 290.2%Arab
- 290.2%Slovak
Zip codes: 12589.