Races in South Bannock, Idaho (ID) Detailed Stats
Ancestries, Foreign-born residents, place of birth
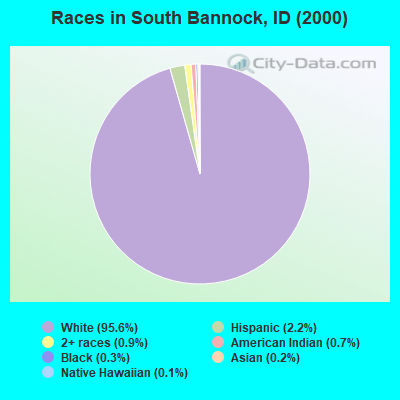
Race distribution in South Bannock

- 5,28695.6%White alone
- 1192.2%Hispanic
- 500.9%Two or more races
- 400.7%American Indian alone
- 140.3%Black alone
- 120.2%Asian alone
- 60.1%Native Hawaiian and Other
Pacific Islander alone - 10.02%Other race alone
2000
2022
-
- 1,139,29188.0%White alone
- 101,6907.9%Hispanic
- 18,2611.4%Two or more races
- 15,7891.2%American Indian alone
- 11,6410.9%Asian alone
- 4,8890.4%Black alone
- 1,1920.09%Other race alone
- 1,2000.09%Native Hawaiian and Other
Pacific Islander alone

-
- 1,531,21979.0%White alone
- 261,92113.5%Hispanic
- 81,1124.2%Two or more races
- 25,1741.3%Asian alone
- 15,8250.8%American Indian alone
- 11,8680.6%Black alone
- 8,7520.5%Other race alone
- 3,1620.2%Native Hawaiian and Other
Pacific Islander alone

Income and house value in South Bannock
- Median household income in 2022
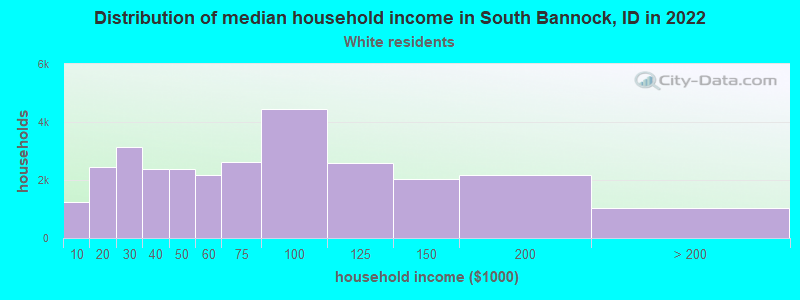
- $61,806White non-Hispanic householders
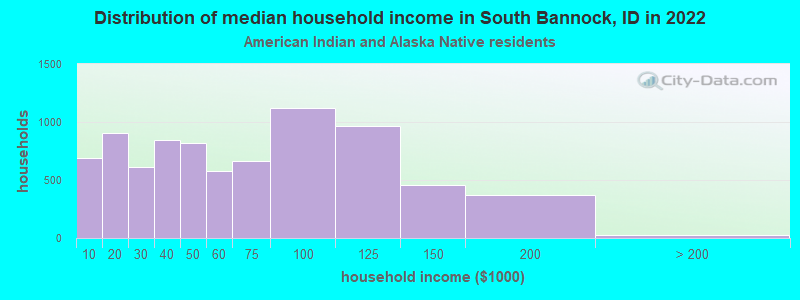
- $79,316American Indian and Alaska Native householders
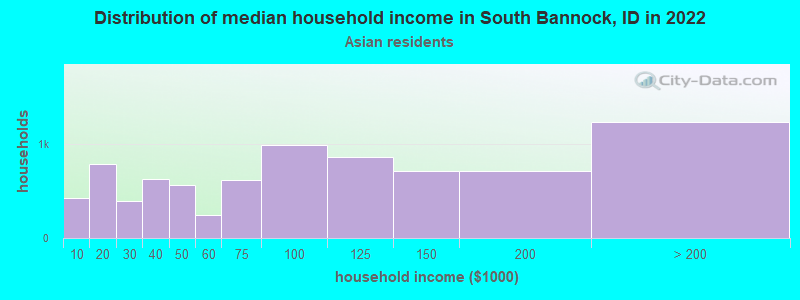
- $97,017Asian householders
- over $200,000Some other race householders
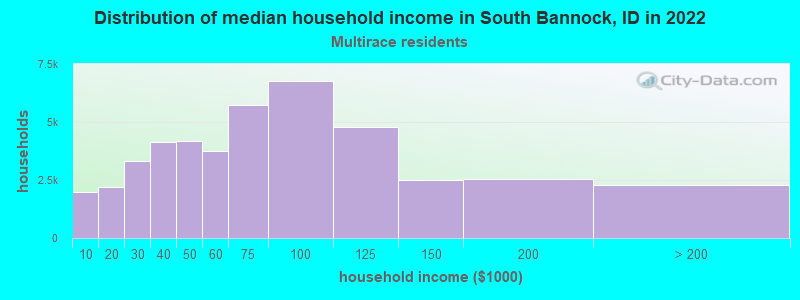
- $120,165Two or more races householders
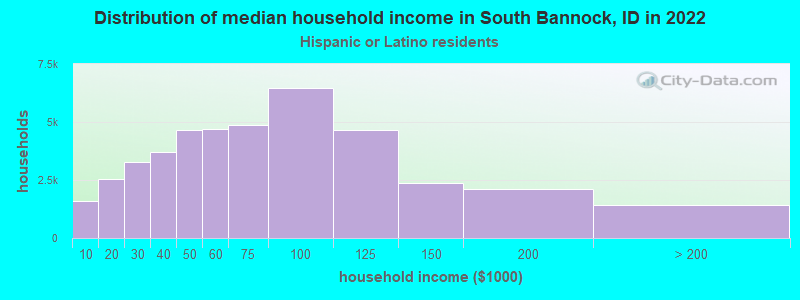
- $73,442Hispanic or Latino race householders
- Median 2022 house value
- $310,121White Non-Hispanic householders
- $319,475American Indian or Alaska Native householders
- $305,804Asian householders
- $305,804Some other race householders
- $622,042Two or more races householders
- $305,804Hispanic or Latino householders
Household income for White non-Hispanic householders
Household income for American Indian and Alaska Native householders
Household income for Asian householders
Household income for Two or more races householders
Household income for Hispanic or Latino race householders
Zip code: 83214