Races in South Plainfield, New Jersey (NJ) Detailed Stats
Data:
Races - White alone (%)
Races - White alone (% change since 2000)
Races - Black alone (%)
Races - Black alone (% change since 2000)
Races - American Indian alone (%)
Races - American Indian alone (% change since 2000)
Races - Asian alone (%)
Races - Asian alone (% change since 2000)
Races - Hispanic (%)
Races - Hispanic (% change since 2000)
Races - Native Hawaiian and Other Pacific Islander alone (%)
Races - Native Hawaiian and Other Pacific Islander alone (% change since 2000)
Races - Two or more races(%)
Races - Two or more races(% change since 2000)
Races - Other race alone (%)
Races - Other race alone (% change since 2000)
Racial diversity
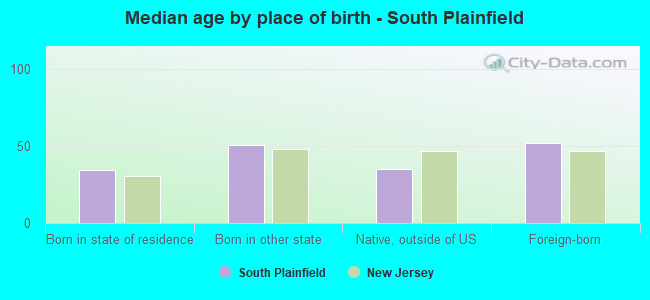
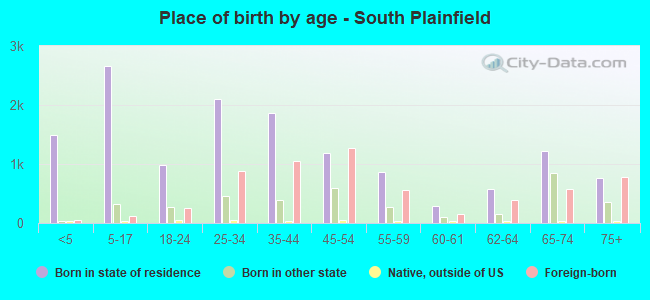
Place of birth - Born in state of residence (%)
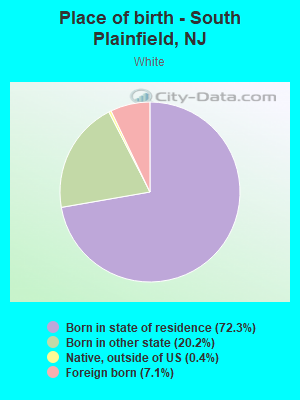
Place of birth - Born in state of residence (%) - White
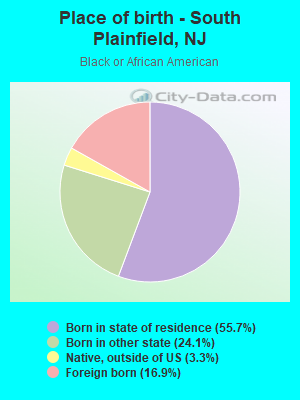
Place of birth - Born in state of residence (%) - Black or African American
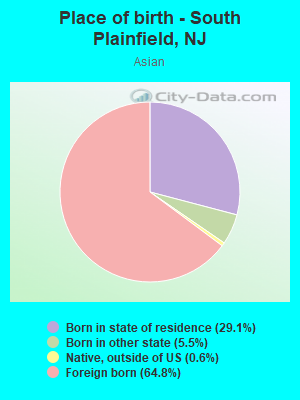
Place of birth - Born in state of residence (%) - Asian
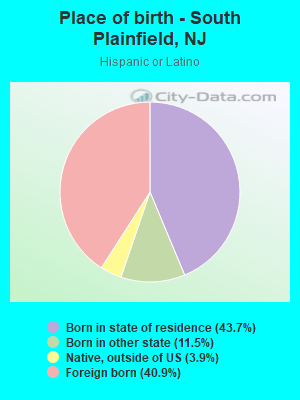
Place of birth - Born in state of residence (%) - Hispanic or Latino
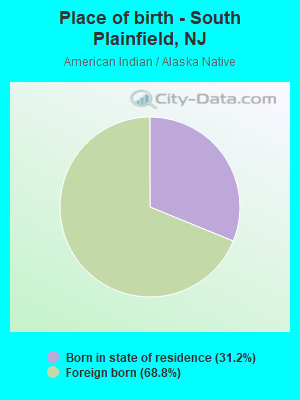
Place of birth - Born in state of residence (%) - American Indian and Alaska Native
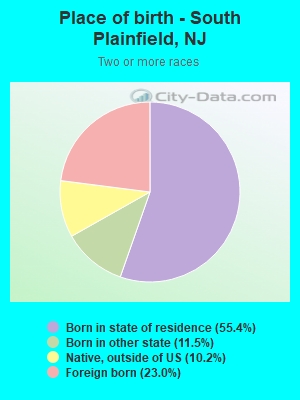
Place of birth - Born in state of residence (%) - Multirace
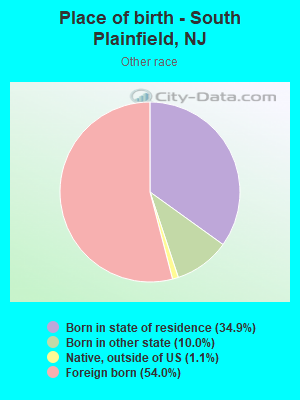
Place of birth - Born in state of residence (%) - Other Race
Place of birth - Born in other state (%)
Place of birth - Born in other state (%) - White
Place of birth - Born in other state (%) - Black or African American
Place of birth - Born in other state (%) - Asian
Place of birth - Born in other state (%) - Hispanic or Latino
Place of birth - Born in other state (%) - American Indian and Alaska Native
Place of birth - Born in other state (%) - Multirace
Place of birth - Born in other state (%) - Other Race
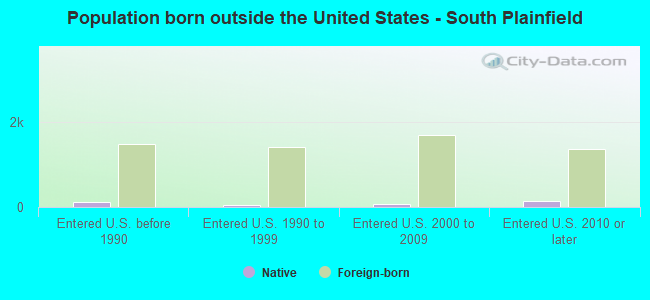
Place of birth - Native, outside of US (%)
Place of birth - Native, outside of US (%) - White
Place of birth - Native, outside of US (%) - Black or African American
Place of birth - Native, outside of US (%) - Asian
Place of birth - Native, outside of US (%) - Hispanic or Latino
Place of birth - Native, outside of US (%) - American Indian and Alaska Native
Place of birth - Native, outside of US (%) - Multirace
Place of birth - Native, outside of US (%) - Other Race
Place of birth - Foreign born (%)
Place of birth - Foreign born (%) - White
Place of birth - Foreign born (%) - Black or African American
Place of birth - Foreign born (%) - Asian
Place of birth - Foreign born (%) - Hispanic or Latino
Place of birth - Foreign born (%) - American Indian and Alaska Native
Place of birth - Foreign born (%) - Multirace
Place of birth - Foreign born (%) - Other Race
Residents speaking English at home (%)
Residents speaking English at home - Born in the United States (%)
Residents speaking English at home - Native, born elsewhere (%)
Residents speaking English at home - Foreign born (%)
Residents speaking Spanish at home (%)
Residents speaking Spanish at home - Born in the United States (%)
Residents speaking Spanish at home - Native, born elsewhere (%)
Residents speaking Spanish at home - Foreign born (%)
Residents speaking other language at home (%)
Residents speaking other language at home - Born in the United States (%)
Residents speaking other language at home - Native, born elsewhere (%)
Residents speaking other language at home - Foreign born (%)
Marital status - Never married (%)
Marital status - Now married (%)
Marital status - Separated (%)
Marital status - Widowed (%)
Marital status - Divorced (%)
Ancestries Reported - Arab (%)
Ancestries Reported - Czech (%)
Ancestries Reported - Danish (%)
Ancestries Reported - Dutch (%)
Ancestries Reported - English (%)
Ancestries Reported - French (%)
Ancestries Reported - French Canadian (%)
Ancestries Reported - German (%)
Ancestries Reported - Greek (%)
Ancestries Reported - Hungarian (%)
Ancestries Reported - Irish (%)
Ancestries Reported - Italian (%)
Ancestries Reported - Lithuanian (%)
Ancestries Reported - Norwegian (%)
Ancestries Reported - Polish (%)
Ancestries Reported - Portuguese (%)
Ancestries Reported - Russian (%)
Ancestries Reported - Scotch-Irish (%)
Ancestries Reported - Scottish (%)
Ancestries Reported - Slovak (%)
Ancestries Reported - Subsaharan African (%)
Ancestries Reported - Swedish (%)
Ancestries Reported - Swiss (%)
Ancestries Reported - Ukrainian (%)
Ancestries Reported - United States (%)
Ancestries Reported - Welsh (%)
Ancestries Reported - West Indian (%)
Ancestries Reported - Other (%)
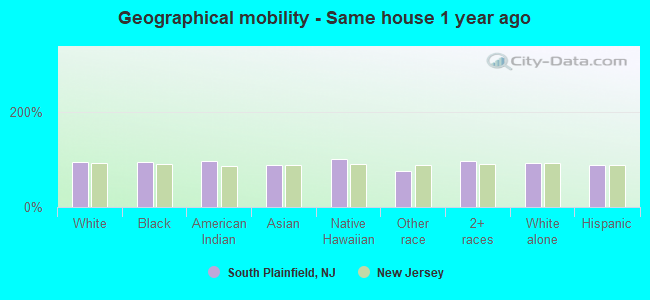
Geographical mobility - Same house 1 year ago (%)
Geographical mobility - Same house 1 year ago (%) - White
Geographical mobility - Same house 1 year ago (%) - Black or African American
Geographical mobility - Same house 1 year ago (%) - Asian
Geographical mobility - Same house 1 year ago (%) - Hispanic or Latino
Geographical mobility - Same house 1 year ago (%) - American Indian and Alaska Native
Geographical mobility - Same house 1 year ago (%) - Multirace
Geographical mobility - Same house 1 year ago (%) - Other Race
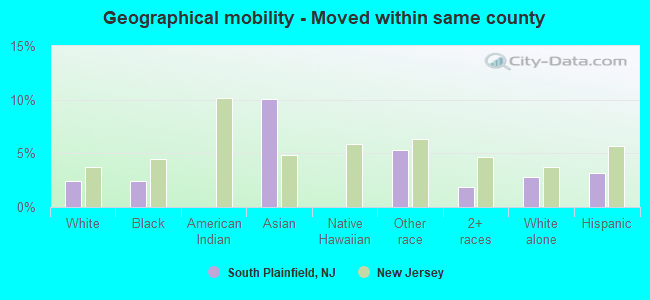
Geographical mobility - Moved within same county (%)
Geographical mobility - Moved within same county (%) - White
Geographical mobility - Moved within same county (%) - Black or African American
Geographical mobility - Moved within same county (%) - Asian
Geographical mobility - Moved within same county (%) - Hispanic or Latino
Geographical mobility - Moved within same county (%) - American Indian and Alaska Native
Geographical mobility - Moved within same county (%) - Multirace
Geographical mobility - Moved within same county (%) - Other Race
Geographical mobility - Moved from different county within same state (%)
Geographical mobility - Moved from different county within same state (%) - White
Geographical mobility - Moved from different county within same state (%) - Black or African American
Geographical mobility - Moved from different county within same state (%) - Asian
Geographical mobility - Moved from different county within same state (%) - Hispanic or Latino
Geographical mobility - Moved from different county within same state (%) - American Indian and Alaska Native
Geographical mobility - Moved from different county within same state (%) - Multirace
Geographical mobility - Moved from different county within same state (%) - Other Race
Geographical mobility - Moved from different state (%)
Geographical mobility - Moved from different state (%) - White
Geographical mobility - Moved from different state (%) - Black or African American
Geographical mobility - Moved from different state (%) - Asian
Geographical mobility - Moved from different state (%) - Hispanic or Latino
Geographical mobility - Moved from different state (%) - American Indian and Alaska Native
Geographical mobility - Moved from different state (%) - Multirace
Geographical mobility - Moved from different state (%) - Other Race
Geographical mobility - Moved from abroad (%)
Geographical mobility - Moved from abroad (%) - White
Geographical mobility - Moved from abroad (%) - Black or African American
Geographical mobility - Moved from abroad (%) - Asian
Geographical mobility - Moved from abroad (%) - Hispanic or Latino
Geographical mobility - Moved from abroad (%) - American Indian and Alaska Native
Geographical mobility - Moved from abroad (%) - Multirace
Geographical mobility - Moved from abroad (%) - Other Race
Place of birth for the foreign-born population - Ireland (%)
Place of birth for the foreign-born population - Denmark (%)
Place of birth for the foreign-born population - Norway (%)
Place of birth for the foreign-born population - Sweden (%)
Place of birth for the foreign-born population - United Kingdom (%)
Place of birth for the foreign-born population - England (%)
Place of birth for the foreign-born population - Scotland (%)
Place of birth for the foreign-born population - Other Northern Europe (%)
Place of birth for the foreign-born population - Austria (%)
Place of birth for the foreign-born population - Belgium (%)
Place of birth for the foreign-born population - France (%)
Place of birth for the foreign-born population - Germany (%)
Place of birth for the foreign-born population - Netherlands (%)
Place of birth for the foreign-born population - Switzerland (%)
Place of birth for the foreign-born population - Other Western Europe (%)
Place of birth for the foreign-born population - Greece (%)
Place of birth for the foreign-born population - Italy (%)
Place of birth for the foreign-born population - Portugal (%)
Place of birth for the foreign-born population - Spain (%)
Place of birth for the foreign-born population - Other Southern Europe (%)
Place of birth for the foreign-born population - Albania (%)
Place of birth for the foreign-born population - Belarus (%)
Place of birth for the foreign-born population - Bosnia and Herzegovina (%)
Place of birth for the foreign-born population - Bulgaria (%)
Place of birth for the foreign-born population - Croatia (%)
Place of birth for the foreign-born population - Czechoslovakia (%)
Place of birth for the foreign-born population - Hungary (%)
Place of birth for the foreign-born population - Latvia (%)
Place of birth for the foreign-born population - Lithuania (%)
Place of birth for the foreign-born population - North Macedonia (Macedonia) (%)
Place of birth for the foreign-born population - Moldova (%)
Place of birth for the foreign-born population - Poland (%)
Place of birth for the foreign-born population - Romania (%)
Place of birth for the foreign-born population - Russia (%)
Place of birth for the foreign-born population - Serbia (%)
Place of birth for the foreign-born population - Ukraine (%)
Place of birth for the foreign-born population - Other Eastern Europe (%)
Place of birth for the foreign-born population - China (%)
Place of birth for the foreign-born population - Hong Kong (%)
Place of birth for the foreign-born population - Taiwan (%)
Place of birth for the foreign-born population - Japan (%)
Place of birth for the foreign-born population - Korea (%)
Place of birth for the foreign-born population - Other Eastern Asia (%)
Place of birth for the foreign-born population - Afghanistan (%)
Place of birth for the foreign-born population - Bangladesh (%)
Place of birth for the foreign-born population - India (%)
Place of birth for the foreign-born population - Iran (%)
Place of birth for the foreign-born population - Kazakhstan (%)
Place of birth for the foreign-born population - Nepal (%)
Place of birth for the foreign-born population - Pakistan (%)
Place of birth for the foreign-born population - Sri Lanka (%)
Place of birth for the foreign-born population - Uzbekistan (%)
Place of birth for the foreign-born population - Other South Central Asia (%)
Place of birth for the foreign-born population - Burma (%)
Place of birth for the foreign-born population - Cambodia (%)
Place of birth for the foreign-born population - Indonesia (%)
Place of birth for the foreign-born population - Laos (%)
Place of birth for the foreign-born population - Malaysia (%)
Place of birth for the foreign-born population - Philippines (%)
Place of birth for the foreign-born population - Singapore (%)
Place of birth for the foreign-born population - Thailand (%)
Place of birth for the foreign-born population - Vietnam (%)
Place of birth for the foreign-born population - Other South Eastern Asia (%)
Place of birth for the foreign-born population - Armenia (%)
Place of birth for the foreign-born population - Iraq (%)
Place of birth for the foreign-born population - Israel (%)
Place of birth for the foreign-born population - Jordan (%)
Place of birth for the foreign-born population - Kuwait (%)
Place of birth for the foreign-born population - Lebanon (%)
Place of birth for the foreign-born population - Saudi Arabia (%)
Place of birth for the foreign-born population - Syria (%)
Place of birth for the foreign-born population - Turkey (%)
Place of birth for the foreign-born population - Yemen (%)
Place of birth for the foreign-born population - Other Western Asia (%)
Place of birth for the foreign-born population - Eritrea (%)
Place of birth for the foreign-born population - Ethiopia (%)
Place of birth for the foreign-born population - Kenya (%)
Place of birth for the foreign-born population - Somalia (%)
Place of birth for the foreign-born population - Uganda (%)
Place of birth for the foreign-born population - Zimbabwe (%)
Place of birth for the foreign-born population - Other Eastern Africa (%)
Place of birth for the foreign-born population - Cameroon (%)
Place of birth for the foreign-born population - Congo (%)
Place of birth for the foreign-born population - Democratic Republic of Congo (Zaire) (%)
Place of birth for the foreign-born population - Other Middle Africa (%)
Place of birth for the foreign-born population - Egypt (%)
Place of birth for the foreign-born population - Morocco (%)
Place of birth for the foreign-born population - Sudan (%)
Place of birth for the foreign-born population - Other Northern Africa (%)
Place of birth for the foreign-born population - South Africa (%)
Place of birth for the foreign-born population - Other Southern Africa (%)
Place of birth for the foreign-born population - Cabo Verde (%)
Place of birth for the foreign-born population - Ghana (%)
Place of birth for the foreign-born population - Liberia (%)
Place of birth for the foreign-born population - Nigeria (%)
Place of birth for the foreign-born population - Senegal (%)
Place of birth for the foreign-born population - Sierra Leone (%)
Place of birth for the foreign-born population - Other Western Africa (%)
Place of birth for the foreign-born population - Australia (%)
Place of birth for the foreign-born population - New Zealand (%)
Place of birth for the foreign-born population - Fiji (%)
Place of birth for the foreign-born population - Micronesia (%)
Place of birth for the foreign-born population - Bahamas (%)
Place of birth for the foreign-born population - Barbados (%)
Place of birth for the foreign-born population - Cuba (%)
Place of birth for the foreign-born population - Dominica (%)
Place of birth for the foreign-born population - Dominican Republic (%)
Place of birth for the foreign-born population - Grenada (%)
Place of birth for the foreign-born population - Haiti (%)
Place of birth for the foreign-born population - Jamaica (%)
Place of birth for the foreign-born population - St. Vincent and the Grenadines (%)
Place of birth for the foreign-born population - Trinidad and Tobago (%)
Place of birth for the foreign-born population - West Indies (%)
Place of birth for the foreign-born population - Other Caribbean (%)
Place of birth for the foreign-born population - Belize (%)
Place of birth for the foreign-born population - Costa Rica (%)
Place of birth for the foreign-born population - El Salvador (%)
Place of birth for the foreign-born population - Guatemala (%)
Place of birth for the foreign-born population - Honduras (%)
Place of birth for the foreign-born population - Mexico (%)
Place of birth for the foreign-born population - Nicaragua (%)
Place of birth for the foreign-born population - Panama (%)
Place of birth for the foreign-born population - Other Central America (%)
Place of birth for the foreign-born population - Argentina (%)
Place of birth for the foreign-born population - Bolivia (%)
Place of birth for the foreign-born population - Brazil (%)
Place of birth for the foreign-born population - Chile (%)
Place of birth for the foreign-born population - Colombia (%)
Place of birth for the foreign-born population - Ecuador (%)
Place of birth for the foreign-born population - Guyana (%)
Place of birth for the foreign-born population - Peru (%)
Place of birth for the foreign-born population - Uruguay (%)
Place of birth for the foreign-born population - Venezuela (%)
Place of birth for the foreign-born population - Other South America (%)
Place of birth for the foreign-born population - Canada (%)
Place of birth for the foreign-born population - Other Northern America (%)
Place of birth for the foreign-born population - Other (%)
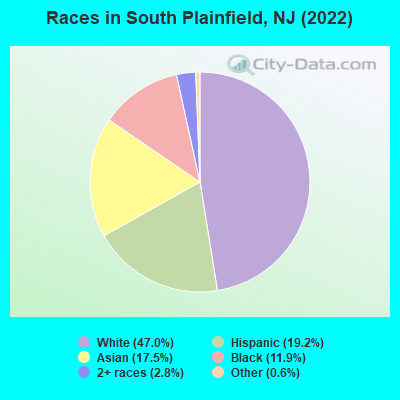
According to 2022 data, the most numerous races in South Plainfield, NJ are White alone (11,424 residents), Hispanic (4,666 residents), and Black alone (2,897 residents). 65.7% of South Plainfield residents speak English at home. 24.3% of South Plainfield, NJ residents are foreign-born (12.7% born in Asia, 8.5% born in Latin America), which is 5.3% greater than the foreign-born rate of 23.0% across the entire state of New Jersey.
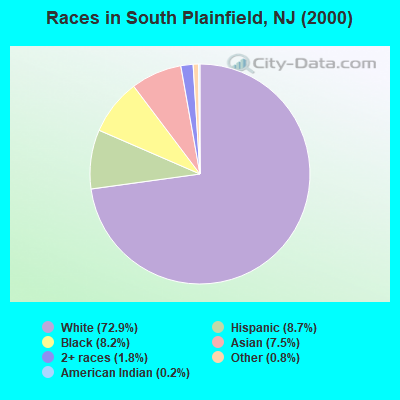
Race distribution in South Plainfield
2000 2022
5,557,209 66.0% White alone 1,117,191 13.3% Hispanic 1,096,171 13.0% Black alone 477,012 5.7% Asian alone 133,689 1.6% Two or more races 19,565 0.2% Other race alone 11,338 0.1% American Indian alone 2,175 0.03% Native Hawaiian and Other
4,766,476 51.5% White alone 2,028,470 21.9% Hispanic 1,111,632 12.0% Black alone 923,546 10.0% Asian alone 332,237 3.6% Two or more races 89,847 1.0% Other race alone 8,557 0.09% American Indian alone 934 0.01% Native Hawaiian and Other
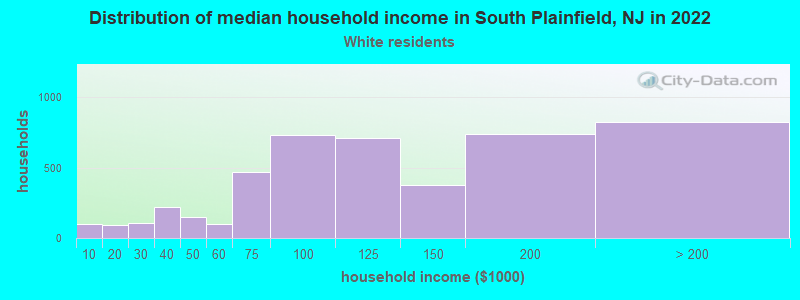
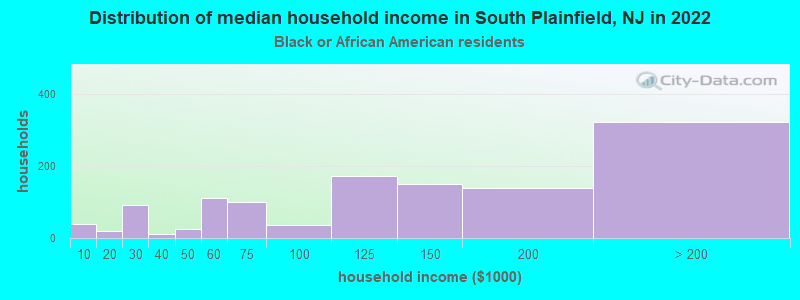
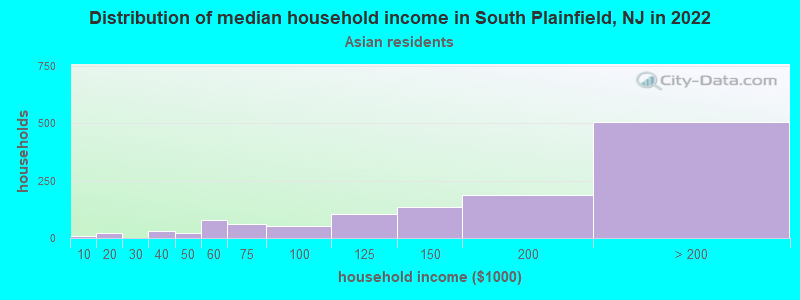
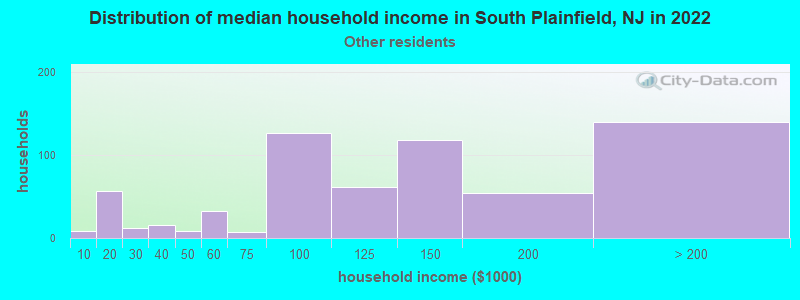
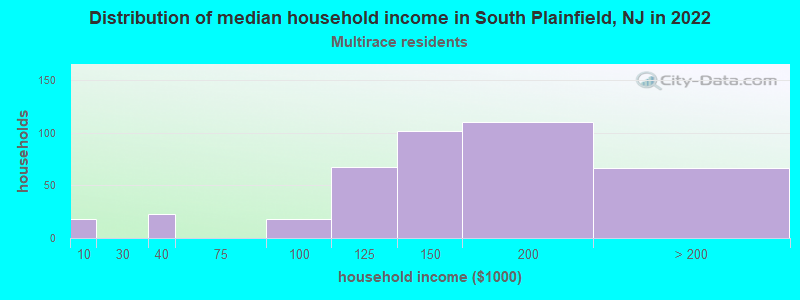
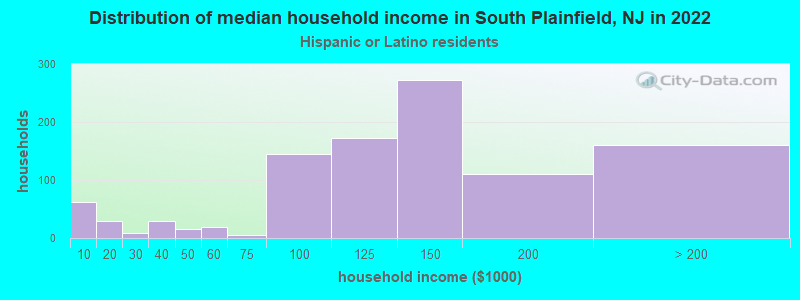
Income and house value in South Plainfield Median household income in 2022 $110,478 White non-Hispanic householders$123,802 Black householders$153,903 Asian householders$118,116 Some other race householders$127,372 Two or more races householders$125,137 Hispanic or Latino race householdersMedian 2022 house value $440,952 White Non-Hispanic householders$448,444 Black or African American householders$301,014 American Indian or Alaska Native householders $477,341 Asian householders$426,235 Some other race householders$489,649 Two or more races householders$439,346 Hispanic or Latino householders
Median age by race in South Plainfield
48.2 Median age for White residents45.8 52.3 42.3 Median age for Black or African American residents35.9 46.9 74.0 Median age for American Indian / Alaska Native residents-624,624,624.0 -739,999,999.3 34.9 Median age for Asian residents34.6 35.5 -939,393,938.5 Median age for Native Hawaiian / Pacific Islander residents-860,335,194.7 -713,070,378.3 39.4 Median age for Other race residents40.2 33.3 27.4 Median age for Two or more races residents30.0 20.4 48.7 Median age for White alone residents46.5 51.7 32.4 Median age for Hispanic or Latino residents37.5 29.3
Owner/renter occupied households by race in South Plainfield
House owners and renters - White residents 4,285 90.3% Owner occupied458 9.7% Renter occupiedHouse owners and renters - Black or African American residents 755 64.1% Owner occupied423 35.9% Renter occupiedHouse owners and renters - American Indian / Alaska Native residents 21 100.0% Owner occupiedHouse owners and renters - Asian residents 1,120 90.1% Owner occupied123 9.9% Renter occupiedHouse owners and renters - Other race residents 572 84.7% Owner occupied103 15.3% Renter occupiedHouse owners and renters - Two or more races residents 409 88.7% Owner occupied52 11.3% Renter occupiedHouse owners and renters - White alone residents 4,216 89.7% Owner occupied485 10.3% Renter occupiedHouse owners and renters - Hispanic or Latino residents 945 84.7% Owner occupied171 15.3% Renter occupied
Language usage in South Plainfield
English speakers - Total 65.7% of residents of South Plainfield speak English at home.
12.8% of residents speak Spanish at home 1,818 62.5% Speak English very well1,093 37.5% Speak English less than very well21.1% of residents speak other language at home 3,573 74.7% Speak English very well1,213 25.3% Speak English less than very well
English speakers - Born in the United States 86.2% of residents of South Plainfield speak English at home.
9.3% of residents speak Spanish at home 219 61.3% Speak English very well138 38.7% Speak English less than very well4.6% of residents speak other language at home 144 82.3% Speak English very well31 17.7% Speak English less than very well
English speakers - Native, born elsewhere 54.7% of residents of South Plainfield speak English at home.
42.7% of residents speak Spanish at home 74 54.8% Speak English very well61 45.2% Speak English less than very well5.4% of residents speak other language at home 17 100.0% Speak English very well
English speakers - Foreign-born 13.5% of residents of South Plainfield speak English at home.
27.3% of residents speak Spanish at home 879 53.8% Speak English very well756 46.2% Speak English less than very well57.5% of residents speak other language at home 2,377 69.0% Speak English very well1,069 31.0% Speak English less than very well
White (Caucasian) - Speak only English Native:
96.4% (9,871)Foreign-born:
15.5% (124)
White (Caucasian) - Speak another language Native:
5.6% (570)Foreign-born:
82.7% (661)
Black or African American - Speak only English Native:
94.7% (2,280)Foreign-born:
61.3% (314)
Black or African American - Speak another language Native:
5.6% (134)Foreign-born:
29.9% (153)
Asian - Speak only English Native:
32.7% (382)Foreign-born:
4.9% (134)
Asian - Speak another language Native:
67.7% (791)Foreign-born:
94.8% (2,606)
Other race - Speak only English Native:
52.2% (602)Foreign-born:
19.0% (314)
Other race - Speak another language Native:
53.1% (613)Foreign-born:
84.9% (1,402)
Two or more races - Speak only English Native:
66.3% (838)Foreign-born:
6.9% (32)
Two or more races - Speak another language Native:
33.4% (422)Foreign-born:
93.4% (440)
White alone - Speak only English Native:
96.0% (9,721)Foreign-born:
12.9% (93)
White alone - Speak another language Native:
4.4% (446)Foreign-born:
86.2% (625)
Hispanic or Latino - Speak only English Native:
47.4% (1,038)Foreign-born:
6.7% (124)
Hispanic or Latino - Speak another language Native:
53.5% (1,171)Foreign-born:
93.1% (1,734)
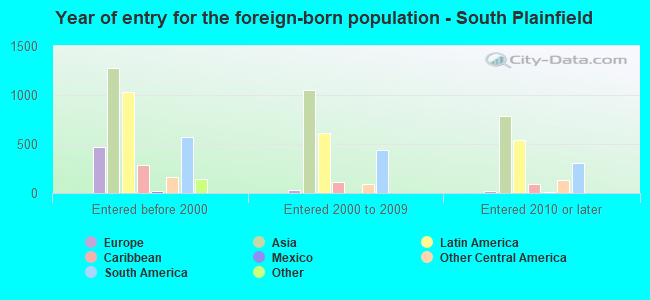
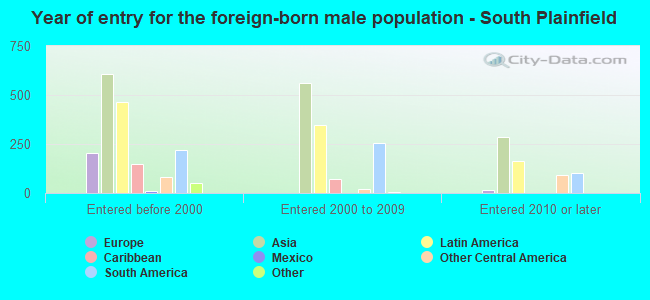
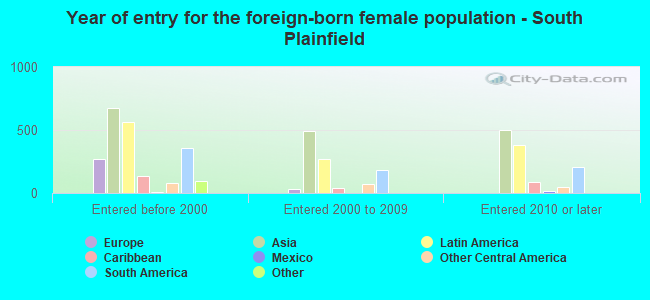
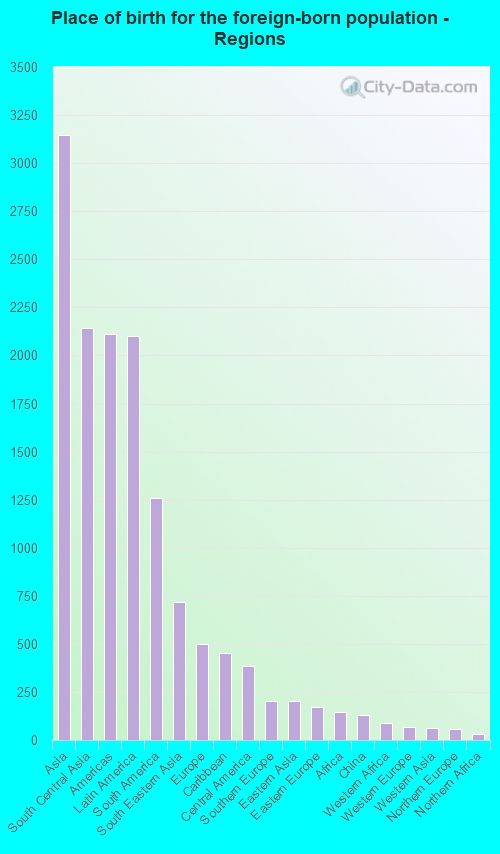
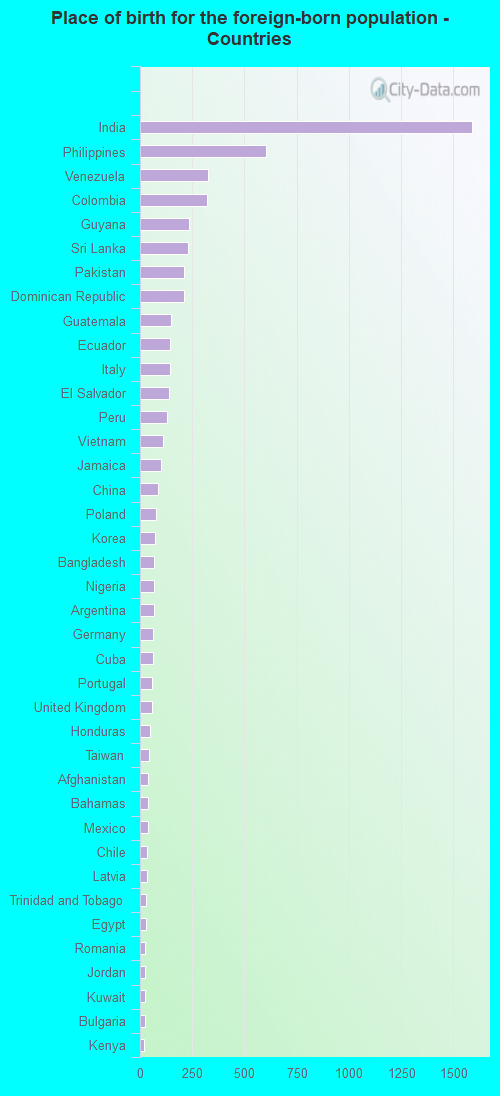
Foreign-born residents in South Plainfield 5,902 residents are foreign born (12.7% Asia , 8.5% Latin America ).
This city:
24.3%New Jersey:
23.2%
Marital status for residents in South Plainfield Marital status - White (Caucasian) population 15 years and over
Males 30.8% Never married60.8% Now married0.7% Separated2.6% Widowed5.1% DivorcedFemales 20.3% Never married60.7% Now married0.3% Separated10.9% Widowed7.8% DivorcedWomen who gave birth in the past 12 months Now married:
90.1% (89)Unmarried:
9.9% (10)
Women who did not give birth in the past 12 months Now married:
56.8% (1,059)Unmarried:
43.2% (806)
Marital status - Black or African American population 15 years and over
Males 39.2% Never married48.3% Now married2.5% Separated0.6% Widowed9.5% DivorcedFemales 35.5% Never married41.9% Now married1.7% Separated8.3% Widowed12.6% DivorcedWomen who did not give birth in the past 12 months Now married:
15.9% (94)Unmarried:
84.1% (497)
Marital status - American Indian / Alaska Native population 15 years and over
Males 0.0% Never married0.0% Now married0.0% Separated0.0% Widowed100.0% DivorcedFemales 0.0% Never married0.0% Now married0.0% Separated0.0% Widowed100.0% DivorcedMarital status - Asian population 15 years and over
Males 26.1% Never married71.6% Now married0.0% Separated1.2% Widowed1.1% DivorcedFemales 20.0% Never married71.0% Now married0.0% Separated8.7% Widowed0.3% DivorcedWomen who gave birth in the past 12 months Now married:
100.0% (22)Unmarried:
0.0% (0)
Women who did not give birth in the past 12 months Now married:
71.0% (692)Unmarried:
29.0% (282)
Marital status - Other race population 15 years and over
Males 29.8% Never married61.1% Now married0.0% Separated0.0% Widowed9.1% DivorcedFemales 33.5% Never married49.6% Now married0.3% Separated12.4% Widowed4.2% DivorcedWomen who gave birth in the past 12 months Now married:
91.9% (144)Unmarried:
8.1% (13)
Women who did not give birth in the past 12 months Now married:
45.4% (257)Unmarried:
54.6% (310)
Marital status - Two or more races population 15 years and over
Males 41.3% Never married53.4% Now married0.0% Separated2.9% Widowed2.5% DivorcedFemales 19.2% Never married65.1% Now married0.0% Separated2.6% Widowed13.2% DivorcedWomen who gave birth in the past 12 months Now married:
100.0% (41)Unmarried:
0.0% (0)
Women who did not give birth in the past 12 months Now married:
41.5% (145)Unmarried:
58.5% (204)
Marital status - White alone, not Hispanic / Latino population 15 years and over
Males 30.1% Never married61.0% Now married0.7% Separated2.9% Widowed5.3% DivorcedFemales 19.8% Never married60.4% Now married0.3% Separated11.9% Widowed7.7% DivorcedWomen who gave birth in the past 12 months Now married:
88.8% (91)Unmarried:
11.2% (12)
Women who did not give birth in the past 12 months Now married:
55.9% (1,054)Unmarried:
44.1% (831)
Marital status - Hispanic or Latino population 15 years and over
Males 33.6% Never married59.8% Now married0.0% Separated1.2% Widowed5.3% DivorcedFemales 27.5% Never married59.6% Now married0.5% Separated7.5% Widowed4.8% DivorcedWomen who gave birth in the past 12 months Now married:
94.2% (154)Unmarried:
5.8% (9)
Women who did not give birth in the past 12 months Now married:
53.5% (470)Unmarried:
46.5% (409)
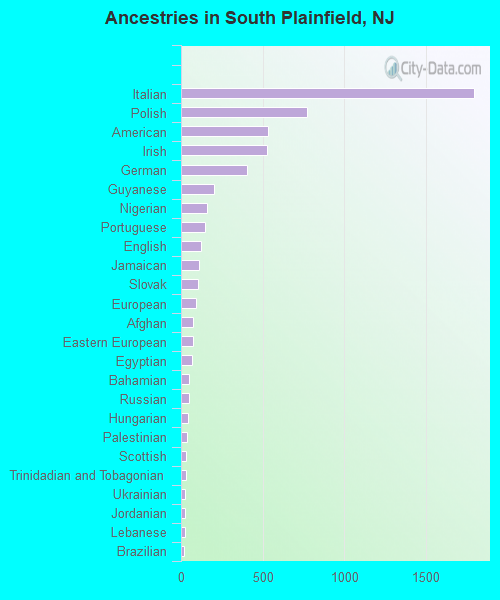
Ancestries in South Plainfield
1,798 13.4% Italian770 5.7% Polish532 4.0% American527 3.9% Irish405 3.0% German203 1.5% Guyanese161 1.2% Nigerian145 1.1% Portuguese120 0.9% English110 0.8% Jamaican106 0.8% Slovak89 0.7% European76 0.6% Afghan75 0.6% Eastern European65 0.5% Egyptian50 0.4% Bahamian48 0.4% Russian40 0.3% Hungarian38 0.3% Palestinian31 0.2% Scottish28 0.2% Trinidadian and Tobagonian24 0.2% Ukrainian23 0.2% Jordanian22 0.2% Lebanese21 0.2% Brazilian20 0.1% Greek20 0.1% South African20 0.1% British18 0.1% Pennsylvania German18 0.1% Croatian17 0.1% Romanian17 0.1% Bulgarian14 0.1% Norwegian10 0.07% Czech9 0.07% Ethiopian8 0.06% Danish8 0.06% Swiss8 0.06% Haitian7 0.05% Canadian7 0.05% West Indian6 0.04% Scotch-Irish4 0.03% Syrian4 0.03% Liberian2 0.01% Arab2 0.01% French
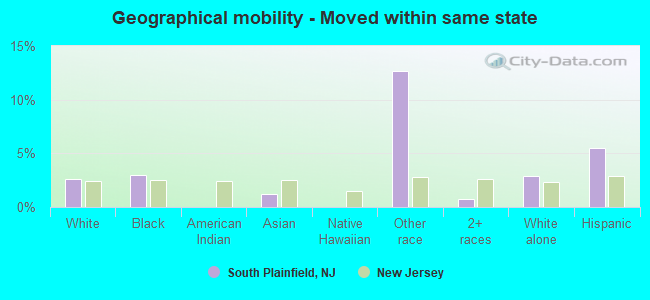
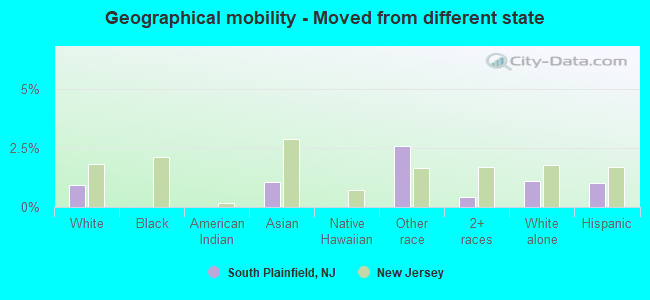
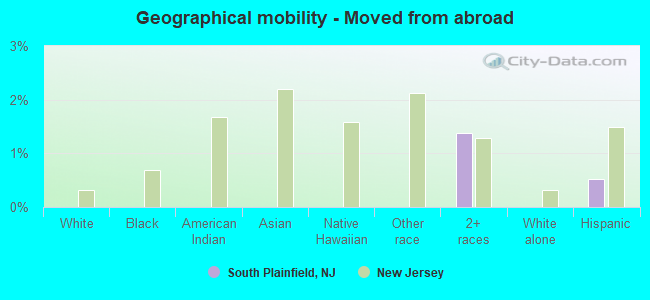
Geographical mobility in South Plainfield Same house 1 year ago 10,697 94.4% White (Caucasian)2,885 93.8% Black or African American38 96.6% American Indian / Alaska Native3,739 87.8% Asian6 100.0% Native Hawaiian / Pacific Islander2,226 75.7% Other race1,955 97.4% Two or more races10,550 93.2% White alone, not Hispanic / Latino4,018 88.8% Hispanic or LatinoMoved within same county 270 2.4% White / Caucasian73 2.4% Black or African American429 10.1% Asian156 5.3% Other race37 1.8% Two or more races315 2.8% White alone, not Hispanic / Latino145 3.2% Hispanic or LatinoMoved within same state 293 2.6% White / Caucasian93 3.0% Black or African American52 1.2% Asian373 12.7% Other race14 0.7% Two or more races328 2.9% White alone, not Hispanic / Latino248 5.5% Hispanic or LatinoMoved from different state 105 0.9% White / Caucasian45 1.1% Asian75 2.6% Other race8 0.4% Two or more races124 1.1% White alone, not Hispanic / Latino46 1.0% Hispanic or LatinoMoved from abroad 28 1.4% Two or more races24 0.5% Hispanic or Latino
Children Nativity (place of birth) in South Plainfield
Children under 6 years - Living with two parents Both parents native 731 100.0% NativeBoth parents foreign-born 549 86.5% Native85 13.5% Foreign-bornOne native, one foreign-born parent 284 100.0% NativeChildren under 6 years - Living with one parent Native parent 143 100.0% NativeForeign-born parent 72 92.4% Native6 7.6% Foreign-bornChildren 6 to 17 years - Living with two parents Both parents native 1,524 100.0% NativeBoth parents foreign-born 583 86.4% Native92 13.6% Foreign-bornOne native, one foreign-born parent 125 100.0% NativeChildren 6 to 17 years - Living with one parent Native parent 399 100.0% NativeForeign-born parent 142 53.8% Native122 46.2% Foreign-born
Grandparents responsible for own grandchildren in South Plainfield
Grandparents (30 to 59 years) White / Caucasian 7 23.2% Responsible for grandchildren23 76.8% Not responsible for grandchildrenAsian 34 100.0% Not responsible for grandchildrenOther race 22 100.0% Not responsible for grandchildrenTwo or more races 3 9.4% Responsible for grandchildren31 90.6% Not responsible for grandchildrenWhite alone, not Hispanic / Latino 8 23.1% Responsible for grandchildren27 76.9% Not responsible for grandchildrenHispanic or Latino 2 5.1% Responsible for grandchildren46 94.9% Not responsible for grandchildrenGrandparents (60 years and over) White / Caucasian 12 10.0% Responsible for grandchildren110 90.0% Not responsible for grandchildrenAsian 26 17.9% Responsible for grandchildren118 82.1% Not responsible for grandchildrenOther race 180 100.0% Not responsible for grandchildrenTwo or more races 34 100.0% Not responsible for grandchildrenWhite alone, not Hispanic / Latino 16 13.0% Responsible for grandchildren110 87.0% Not responsible for grandchildrenHispanic or Latino 183 100.0% Not responsible for grandchildren