Races in South Snyderville Basin, Utah (UT) Detailed Stats
Ancestries, Foreign-born residents, place of birth

Discuss South Snyderville Basin, Utah races on our local forum with over 2,400,000 registered users
2.9% of South Snyderville Basin, UT residents are foreign-born (1.7% born in Europe, 0.6% born in Latin America, 0.6% born in Asia), which is 177.0% less than the foreign-born rate of 8.0% across the entire state of Utah.
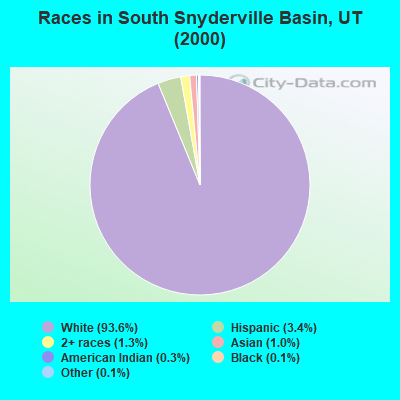
Race distribution in South Snyderville Basin

- 3,40493.6%White alone
- 1253.4%Hispanic
- 491.3%Two or more races
- 351.0%Asian alone
- 100.3%American Indian alone
- 50.1%Black alone
- 50.1%Other race alone
- 30.08%Native Hawaiian and Other
Pacific Islander alone
2000
2022
-
- 1,904,26585.3%White alone
- 201,5599.0%Hispanic
- 36,4831.6%Asian alone
- 31,3081.4%Two or more races
- 26,6631.2%American Indian alone
- 14,8060.7%Native Hawaiian and Other
Pacific Islander alone - 16,1370.7%Black alone
- 1,9480.09%Other race alone

-
- 2,557,46675.6%White alone
- 512,08615.1%Hispanic
- 119,3083.5%Two or more races
- 82,3882.4%Asian alone
- 36,9781.1%Native Hawaiian and Other
Pacific Islander alone - 34,8731.0%Black alone
- 22,8030.7%American Indian alone
- 14,8980.4%Other race alone

Income and house value in South Snyderville Basin
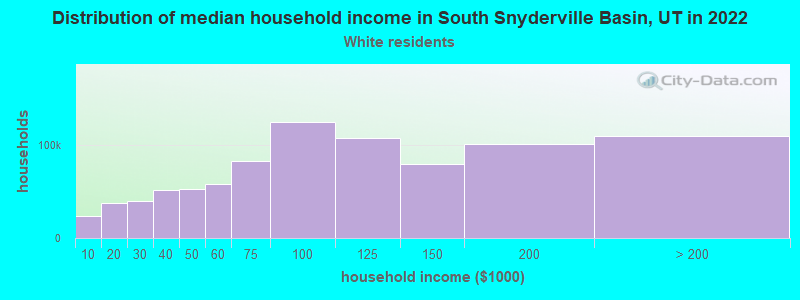
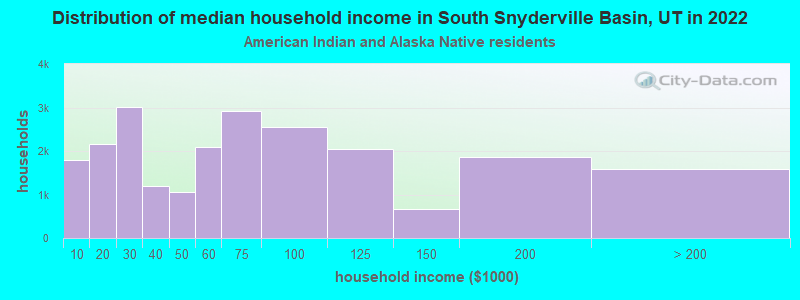
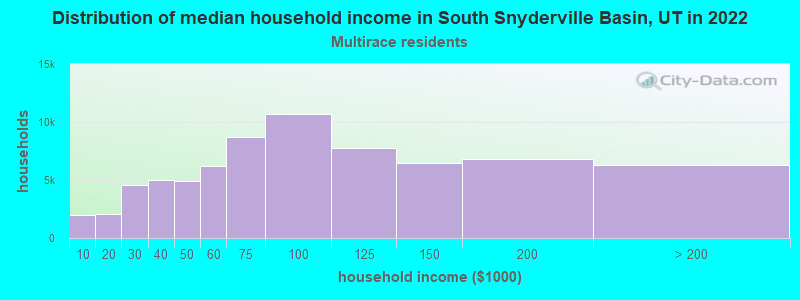
- Median household income in 2022
- $171,963White non-Hispanic householders
- $126,938American Indian and Alaska Native householders
- $190,286Some other race householders
- $170,632Two or more races householders
- over $200,000Hispanic or Latino race householders
- Median 2022 house value
- over $1,000,000White Non-Hispanic householders
- $874,510American Indian or Alaska Native householders
- over $1,000,000Two or more races householders
- over $1,000,000Hispanic or Latino householders
Household income for White non-Hispanic householders
Household income for American Indian and Alaska Native householders
Household income for Two or more races householders
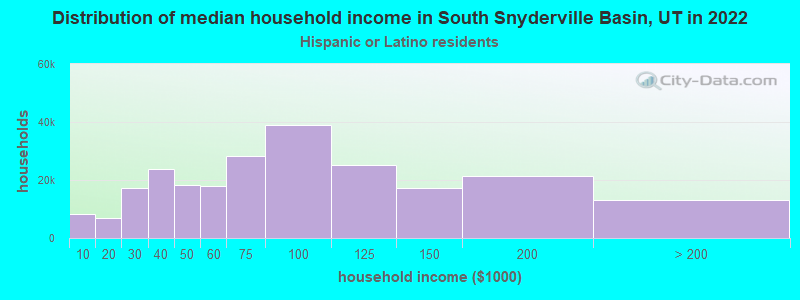
Household income for Hispanic or Latino race householders
Foreign-born residents in South Snyderville Basin
105 residents are foreign born (1.7% Europe, 0.6% Latin America, 0.6% Asia).
| This city: | 2.9% |
| Utah: | 7.1% |
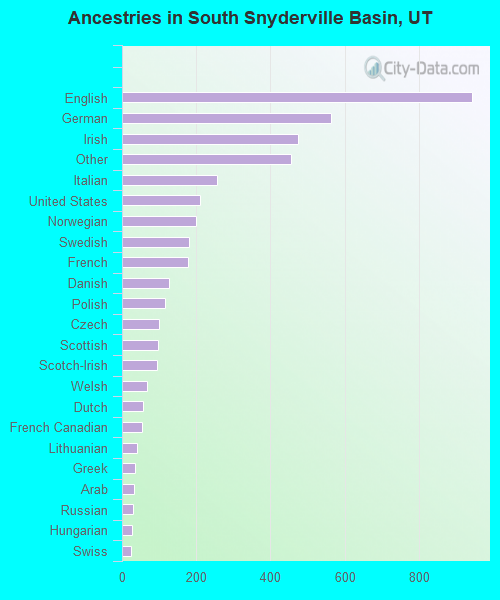
Ancestries in South Snyderville Basin

- 94221.5%English
- 56212.8%German
- 47410.8%Irish
- 45510.4%Other
- 2555.8%Italian
- 2104.8%United States
- 2004.6%Norwegian
- 1804.1%Swedish
- 1794.1%French
- 1262.9%Danish
- 1162.6%Polish
- 1002.3%Czech
- 982.2%Scottish
- 952.2%Scotch-Irish
- 671.5%Welsh
- 571.3%Dutch
- 551.3%French Canadian
- 410.9%Lithuanian
- 360.8%Greek
- 320.7%Arab
- 290.7%Russian
- 270.6%Hungarian
- 250.6%Swiss
- 80.2%Ukrainian
- 70.2%Portuguese
- 70.2%West Indian
Zip codes: 84098.