Races in South Venice, Florida (FL) Detailed Stats
Data:
Races - White alone (%)
Races - White alone (% change since 2000)
Races - Black alone (%)
Races - Black alone (% change since 2000)
Races - American Indian alone (%)
Races - American Indian alone (% change since 2000)
Races - Asian alone (%)
Races - Asian alone (% change since 2000)
Races - Hispanic (%)
Races - Hispanic (% change since 2000)
Races - Native Hawaiian and Other Pacific Islander alone (%)
Races - Native Hawaiian and Other Pacific Islander alone (% change since 2000)
Races - Two or more races(%)
Races - Two or more races(% change since 2000)
Races - Other race alone (%)
Races - Other race alone (% change since 2000)
Racial diversity
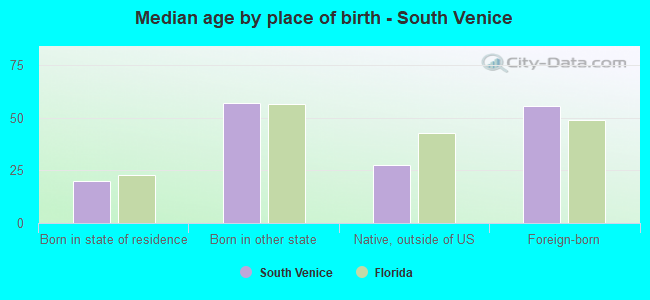
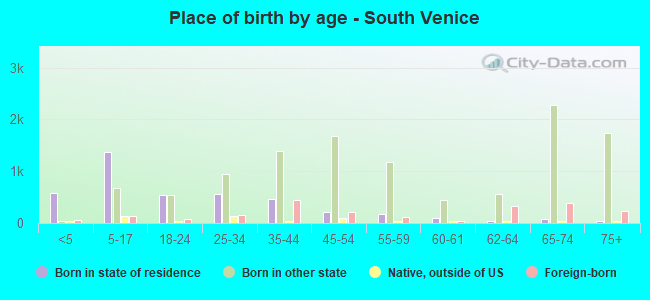
Place of birth - Born in state of residence (%)
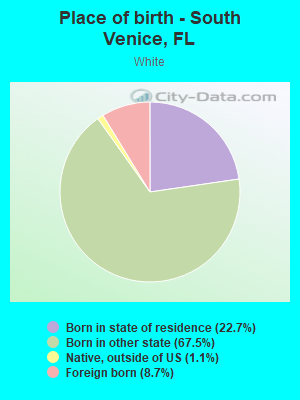
Place of birth - Born in state of residence (%) - White
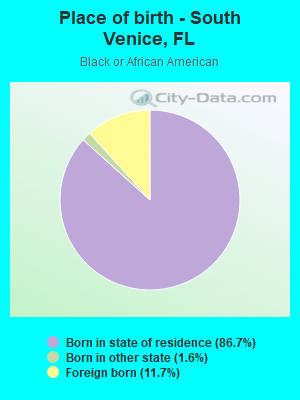
Place of birth - Born in state of residence (%) - Black or African American
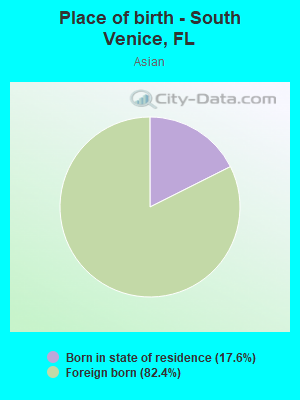
Place of birth - Born in state of residence (%) - Asian
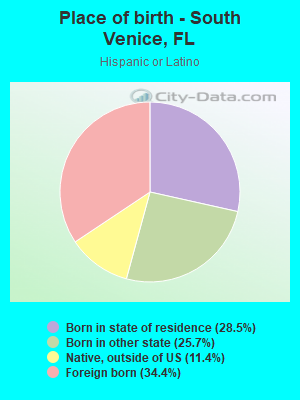
Place of birth - Born in state of residence (%) - Hispanic or Latino
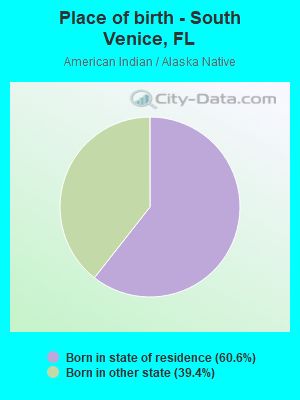
Place of birth - Born in state of residence (%) - American Indian and Alaska Native
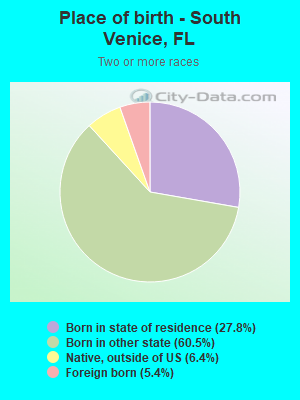
Place of birth - Born in state of residence (%) - Multirace
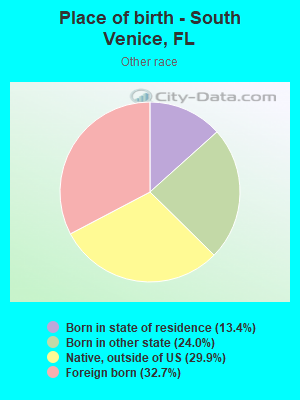
Place of birth - Born in state of residence (%) - Other Race
Place of birth - Born in other state (%)
Place of birth - Born in other state (%) - White
Place of birth - Born in other state (%) - Black or African American
Place of birth - Born in other state (%) - Asian
Place of birth - Born in other state (%) - Hispanic or Latino
Place of birth - Born in other state (%) - American Indian and Alaska Native
Place of birth - Born in other state (%) - Multirace
Place of birth - Born in other state (%) - Other Race
Place of birth - Native, outside of US (%)
Place of birth - Native, outside of US (%) - White
Place of birth - Native, outside of US (%) - Black or African American
Place of birth - Native, outside of US (%) - Asian
Place of birth - Native, outside of US (%) - Hispanic or Latino
Place of birth - Native, outside of US (%) - American Indian and Alaska Native
Place of birth - Native, outside of US (%) - Multirace
Place of birth - Native, outside of US (%) - Other Race
Place of birth - Foreign born (%)
Place of birth - Foreign born (%) - White
Place of birth - Foreign born (%) - Black or African American
Place of birth - Foreign born (%) - Asian
Place of birth - Foreign born (%) - Hispanic or Latino
Place of birth - Foreign born (%) - American Indian and Alaska Native
Place of birth - Foreign born (%) - Multirace
Place of birth - Foreign born (%) - Other Race
Residents speaking English at home (%)
Residents speaking English at home - Born in the United States (%)
Residents speaking English at home - Native, born elsewhere (%)
Residents speaking English at home - Foreign born (%)
Residents speaking Spanish at home (%)
Residents speaking Spanish at home - Born in the United States (%)
Residents speaking Spanish at home - Native, born elsewhere (%)
Residents speaking Spanish at home - Foreign born (%)
Residents speaking other language at home (%)
Residents speaking other language at home - Born in the United States (%)
Residents speaking other language at home - Native, born elsewhere (%)
Residents speaking other language at home - Foreign born (%)
Marital status - Never married (%)
Marital status - Now married (%)
Marital status - Separated (%)
Marital status - Widowed (%)
Marital status - Divorced (%)
Ancestries Reported - Arab (%)
Ancestries Reported - Czech (%)
Ancestries Reported - Danish (%)
Ancestries Reported - Dutch (%)
Ancestries Reported - English (%)
Ancestries Reported - French (%)
Ancestries Reported - French Canadian (%)
Ancestries Reported - German (%)
Ancestries Reported - Greek (%)
Ancestries Reported - Hungarian (%)
Ancestries Reported - Irish (%)
Ancestries Reported - Italian (%)
Ancestries Reported - Lithuanian (%)
Ancestries Reported - Norwegian (%)
Ancestries Reported - Polish (%)
Ancestries Reported - Portuguese (%)
Ancestries Reported - Russian (%)
Ancestries Reported - Scotch-Irish (%)
Ancestries Reported - Scottish (%)
Ancestries Reported - Slovak (%)
Ancestries Reported - Subsaharan African (%)
Ancestries Reported - Swedish (%)
Ancestries Reported - Swiss (%)
Ancestries Reported - Ukrainian (%)
Ancestries Reported - United States (%)
Ancestries Reported - Welsh (%)
Ancestries Reported - West Indian (%)
Ancestries Reported - Other (%)
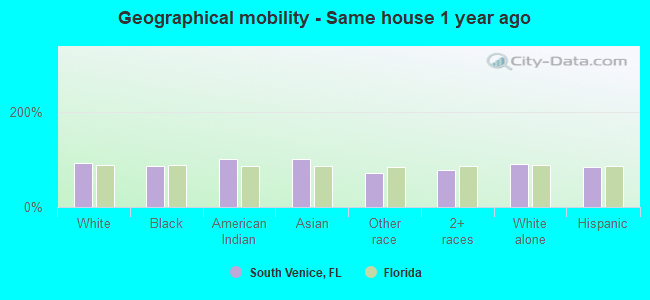
Geographical mobility - Same house 1 year ago (%)
Geographical mobility - Same house 1 year ago (%) - White
Geographical mobility - Same house 1 year ago (%) - Black or African American
Geographical mobility - Same house 1 year ago (%) - Asian
Geographical mobility - Same house 1 year ago (%) - Hispanic or Latino
Geographical mobility - Same house 1 year ago (%) - American Indian and Alaska Native
Geographical mobility - Same house 1 year ago (%) - Multirace
Geographical mobility - Same house 1 year ago (%) - Other Race
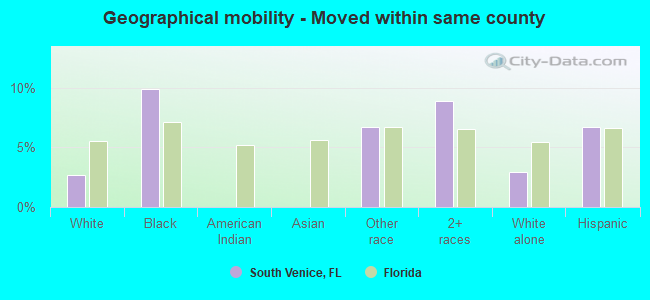
Geographical mobility - Moved within same county (%)
Geographical mobility - Moved within same county (%) - White
Geographical mobility - Moved within same county (%) - Black or African American
Geographical mobility - Moved within same county (%) - Asian
Geographical mobility - Moved within same county (%) - Hispanic or Latino
Geographical mobility - Moved within same county (%) - American Indian and Alaska Native
Geographical mobility - Moved within same county (%) - Multirace
Geographical mobility - Moved within same county (%) - Other Race
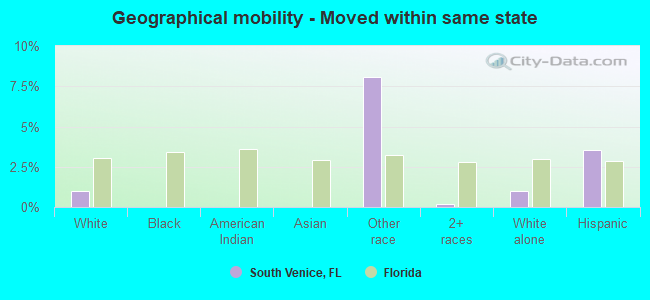
Geographical mobility - Moved from different county within same state (%)
Geographical mobility - Moved from different county within same state (%) - White
Geographical mobility - Moved from different county within same state (%) - Black or African American
Geographical mobility - Moved from different county within same state (%) - Asian
Geographical mobility - Moved from different county within same state (%) - Hispanic or Latino
Geographical mobility - Moved from different county within same state (%) - American Indian and Alaska Native
Geographical mobility - Moved from different county within same state (%) - Multirace
Geographical mobility - Moved from different county within same state (%) - Other Race
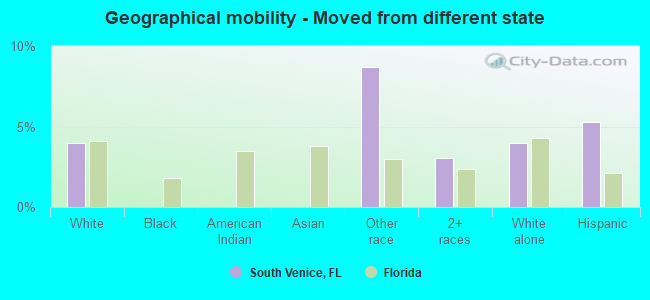
Geographical mobility - Moved from different state (%)
Geographical mobility - Moved from different state (%) - White
Geographical mobility - Moved from different state (%) - Black or African American
Geographical mobility - Moved from different state (%) - Asian
Geographical mobility - Moved from different state (%) - Hispanic or Latino
Geographical mobility - Moved from different state (%) - American Indian and Alaska Native
Geographical mobility - Moved from different state (%) - Multirace
Geographical mobility - Moved from different state (%) - Other Race
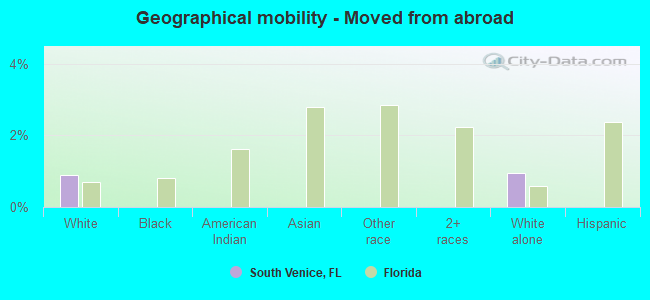
Geographical mobility - Moved from abroad (%)
Geographical mobility - Moved from abroad (%) - White
Geographical mobility - Moved from abroad (%) - Black or African American
Geographical mobility - Moved from abroad (%) - Asian
Geographical mobility - Moved from abroad (%) - Hispanic or Latino
Geographical mobility - Moved from abroad (%) - American Indian and Alaska Native
Geographical mobility - Moved from abroad (%) - Multirace
Geographical mobility - Moved from abroad (%) - Other Race
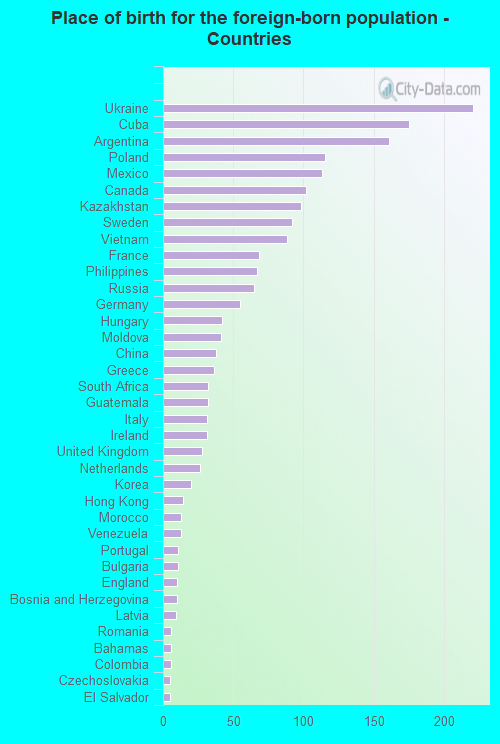
Place of birth for the foreign-born population - Ireland (%)
Place of birth for the foreign-born population - Denmark (%)
Place of birth for the foreign-born population - Norway (%)
Place of birth for the foreign-born population - Sweden (%)
Place of birth for the foreign-born population - United Kingdom (%)
Place of birth for the foreign-born population - England (%)
Place of birth for the foreign-born population - Scotland (%)
Place of birth for the foreign-born population - Other Northern Europe (%)
Place of birth for the foreign-born population - Austria (%)
Place of birth for the foreign-born population - Belgium (%)
Place of birth for the foreign-born population - France (%)
Place of birth for the foreign-born population - Germany (%)
Place of birth for the foreign-born population - Netherlands (%)
Place of birth for the foreign-born population - Switzerland (%)
Place of birth for the foreign-born population - Other Western Europe (%)
Place of birth for the foreign-born population - Greece (%)
Place of birth for the foreign-born population - Italy (%)
Place of birth for the foreign-born population - Portugal (%)
Place of birth for the foreign-born population - Spain (%)
Place of birth for the foreign-born population - Other Southern Europe (%)
Place of birth for the foreign-born population - Albania (%)
Place of birth for the foreign-born population - Belarus (%)
Place of birth for the foreign-born population - Bosnia and Herzegovina (%)
Place of birth for the foreign-born population - Bulgaria (%)
Place of birth for the foreign-born population - Croatia (%)
Place of birth for the foreign-born population - Czechoslovakia (%)
Place of birth for the foreign-born population - Hungary (%)
Place of birth for the foreign-born population - Latvia (%)
Place of birth for the foreign-born population - Lithuania (%)
Place of birth for the foreign-born population - North Macedonia (Macedonia) (%)
Place of birth for the foreign-born population - Moldova (%)
Place of birth for the foreign-born population - Poland (%)
Place of birth for the foreign-born population - Romania (%)
Place of birth for the foreign-born population - Russia (%)
Place of birth for the foreign-born population - Serbia (%)
Place of birth for the foreign-born population - Ukraine (%)
Place of birth for the foreign-born population - Other Eastern Europe (%)
Place of birth for the foreign-born population - China (%)
Place of birth for the foreign-born population - Hong Kong (%)
Place of birth for the foreign-born population - Taiwan (%)
Place of birth for the foreign-born population - Japan (%)
Place of birth for the foreign-born population - Korea (%)
Place of birth for the foreign-born population - Other Eastern Asia (%)
Place of birth for the foreign-born population - Afghanistan (%)
Place of birth for the foreign-born population - Bangladesh (%)
Place of birth for the foreign-born population - India (%)
Place of birth for the foreign-born population - Iran (%)
Place of birth for the foreign-born population - Kazakhstan (%)
Place of birth for the foreign-born population - Nepal (%)
Place of birth for the foreign-born population - Pakistan (%)
Place of birth for the foreign-born population - Sri Lanka (%)
Place of birth for the foreign-born population - Uzbekistan (%)
Place of birth for the foreign-born population - Other South Central Asia (%)
Place of birth for the foreign-born population - Burma (%)
Place of birth for the foreign-born population - Cambodia (%)
Place of birth for the foreign-born population - Indonesia (%)
Place of birth for the foreign-born population - Laos (%)
Place of birth for the foreign-born population - Malaysia (%)
Place of birth for the foreign-born population - Philippines (%)
Place of birth for the foreign-born population - Singapore (%)
Place of birth for the foreign-born population - Thailand (%)
Place of birth for the foreign-born population - Vietnam (%)
Place of birth for the foreign-born population - Other South Eastern Asia (%)
Place of birth for the foreign-born population - Armenia (%)
Place of birth for the foreign-born population - Iraq (%)
Place of birth for the foreign-born population - Israel (%)
Place of birth for the foreign-born population - Jordan (%)
Place of birth for the foreign-born population - Kuwait (%)
Place of birth for the foreign-born population - Lebanon (%)
Place of birth for the foreign-born population - Saudi Arabia (%)
Place of birth for the foreign-born population - Syria (%)
Place of birth for the foreign-born population - Turkey (%)
Place of birth for the foreign-born population - Yemen (%)
Place of birth for the foreign-born population - Other Western Asia (%)
Place of birth for the foreign-born population - Eritrea (%)
Place of birth for the foreign-born population - Ethiopia (%)
Place of birth for the foreign-born population - Kenya (%)
Place of birth for the foreign-born population - Somalia (%)
Place of birth for the foreign-born population - Uganda (%)
Place of birth for the foreign-born population - Zimbabwe (%)
Place of birth for the foreign-born population - Other Eastern Africa (%)
Place of birth for the foreign-born population - Cameroon (%)
Place of birth for the foreign-born population - Congo (%)
Place of birth for the foreign-born population - Democratic Republic of Congo (Zaire) (%)
Place of birth for the foreign-born population - Other Middle Africa (%)
Place of birth for the foreign-born population - Egypt (%)
Place of birth for the foreign-born population - Morocco (%)
Place of birth for the foreign-born population - Sudan (%)
Place of birth for the foreign-born population - Other Northern Africa (%)
Place of birth for the foreign-born population - South Africa (%)
Place of birth for the foreign-born population - Other Southern Africa (%)
Place of birth for the foreign-born population - Cabo Verde (%)
Place of birth for the foreign-born population - Ghana (%)
Place of birth for the foreign-born population - Liberia (%)
Place of birth for the foreign-born population - Nigeria (%)
Place of birth for the foreign-born population - Senegal (%)
Place of birth for the foreign-born population - Sierra Leone (%)
Place of birth for the foreign-born population - Other Western Africa (%)
Place of birth for the foreign-born population - Australia (%)
Place of birth for the foreign-born population - New Zealand (%)
Place of birth for the foreign-born population - Fiji (%)
Place of birth for the foreign-born population - Micronesia (%)
Place of birth for the foreign-born population - Bahamas (%)
Place of birth for the foreign-born population - Barbados (%)
Place of birth for the foreign-born population - Cuba (%)
Place of birth for the foreign-born population - Dominica (%)
Place of birth for the foreign-born population - Dominican Republic (%)
Place of birth for the foreign-born population - Grenada (%)
Place of birth for the foreign-born population - Haiti (%)
Place of birth for the foreign-born population - Jamaica (%)
Place of birth for the foreign-born population - St. Vincent and the Grenadines (%)
Place of birth for the foreign-born population - Trinidad and Tobago (%)
Place of birth for the foreign-born population - West Indies (%)
Place of birth for the foreign-born population - Other Caribbean (%)
Place of birth for the foreign-born population - Belize (%)
Place of birth for the foreign-born population - Costa Rica (%)
Place of birth for the foreign-born population - El Salvador (%)
Place of birth for the foreign-born population - Guatemala (%)
Place of birth for the foreign-born population - Honduras (%)
Place of birth for the foreign-born population - Mexico (%)
Place of birth for the foreign-born population - Nicaragua (%)
Place of birth for the foreign-born population - Panama (%)
Place of birth for the foreign-born population - Other Central America (%)
Place of birth for the foreign-born population - Argentina (%)
Place of birth for the foreign-born population - Bolivia (%)
Place of birth for the foreign-born population - Brazil (%)
Place of birth for the foreign-born population - Chile (%)
Place of birth for the foreign-born population - Colombia (%)
Place of birth for the foreign-born population - Ecuador (%)
Place of birth for the foreign-born population - Guyana (%)
Place of birth for the foreign-born population - Peru (%)
Place of birth for the foreign-born population - Uruguay (%)
Place of birth for the foreign-born population - Venezuela (%)
Place of birth for the foreign-born population - Other South America (%)
Place of birth for the foreign-born population - Canada (%)
Place of birth for the foreign-born population - Other Northern America (%)
Place of birth for the foreign-born population - Other (%)
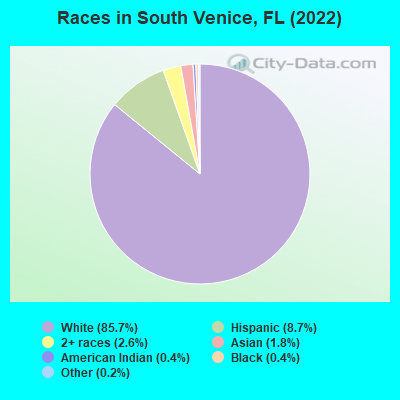
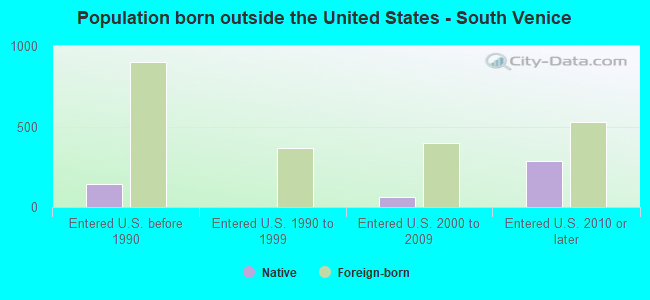
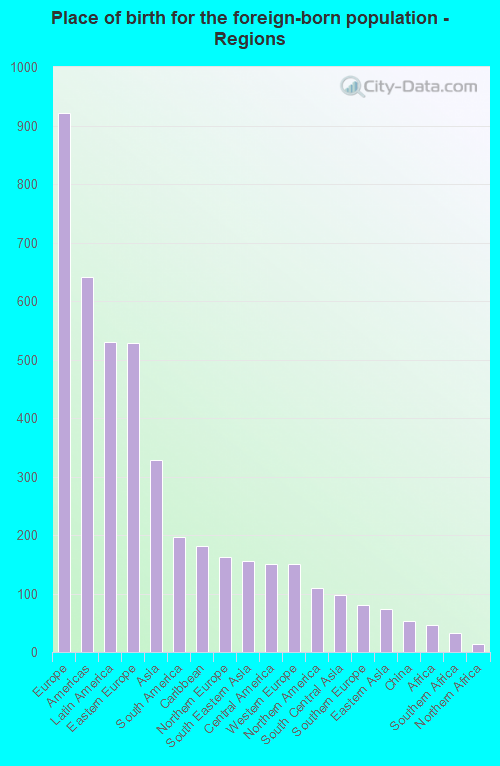
According to 2022 data, the most numerous races in South Venice, FL are White alone (15,756 residents), Hispanic (1,597 residents), and Black alone (66 residents). 87.3% of South Venice residents speak English at home. 10.5% of South Venice, FL residents are foreign-born (5.0% born in Europe, 2.9% born in Latin America, 1.8% born in Asia), which is 99.2% less than the foreign-born rate of 21.0% across the entire state of Florida.
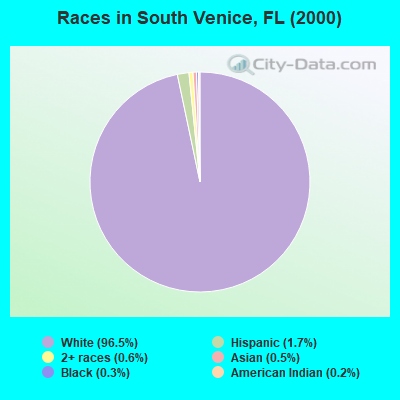
Race distribution in South Venice
2000 2022
10,458,509 65.4% White alone 2,682,715 16.8% Hispanic 2,264,268 14.2% Black alone 261,693 1.6% Asian alone 236,954 1.5% Two or more races 42,358 0.3% American Indian alone 28,994 0.2% Other race alone 6,887 0.04% Native Hawaiian and Other
11,309,403 50.8% White alone 6,025,039 27.1% Hispanic 3,241,015 14.6% Black alone 861,630 3.9% Two or more races 623,692 2.8% Asian alone 152,054 0.7% Other race alone 22,504 0.1% American Indian alone 9,486 0.04% Native Hawaiian and Other
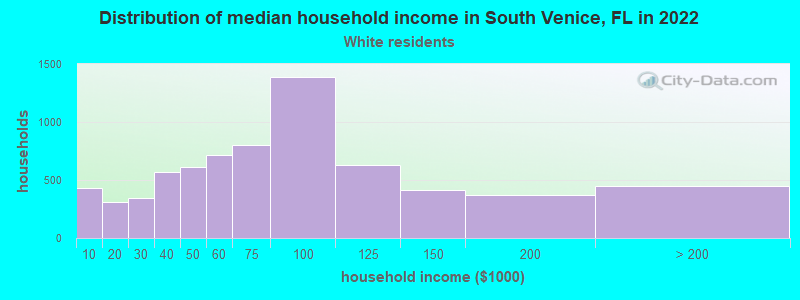
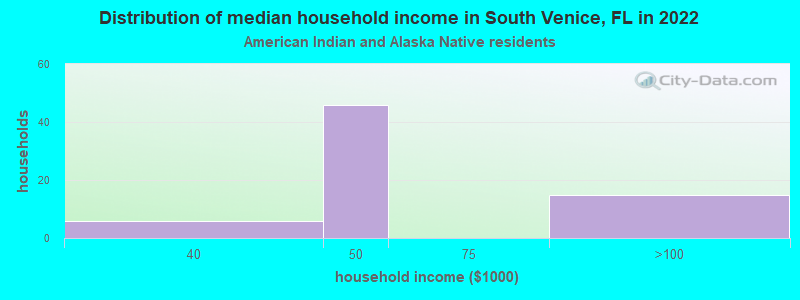
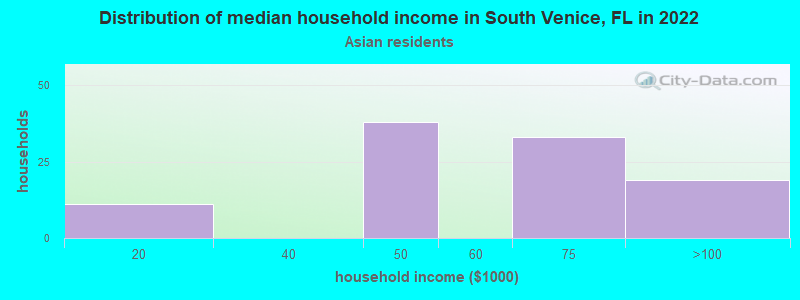
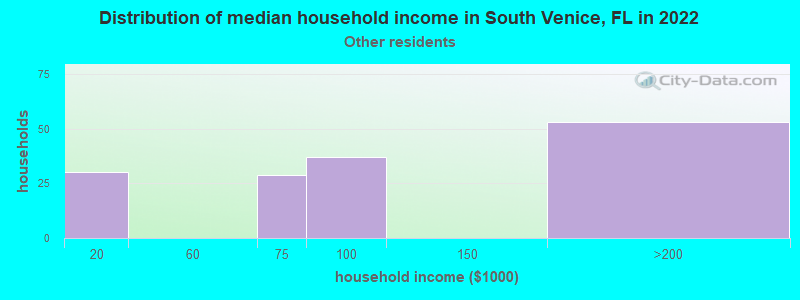
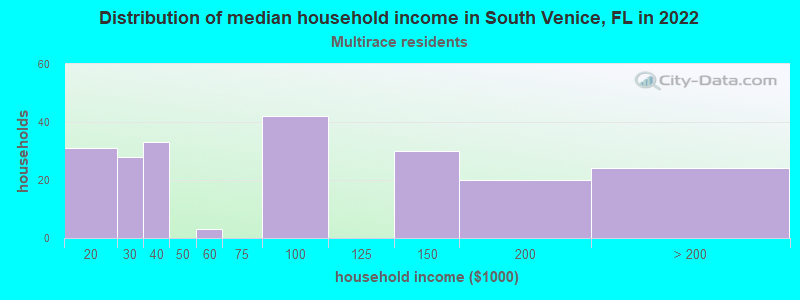
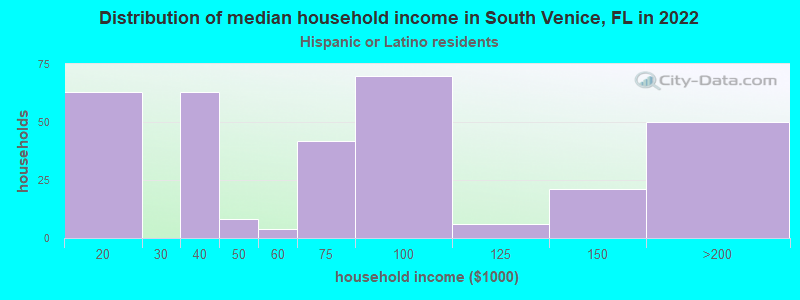
Income and house value in South Venice Median household income in 2022 $72,098 White non-Hispanic householders$51,866 American Indian and Alaska Native householders$86,059 Asian householders$103,072 Some other race householders$69,771 Hispanic or Latino race householdersMedian 2022 house value $328,702 White Non-Hispanic householders$359,340 Black or African American householders$614,661 American Indian or Alaska Native householders $344,210 Asian householders$245,864 Some other race householders$359,340 Two or more races householders$295,794 Hispanic or Latino householders
Median age by race in South Venice
51.9 Median age for White residents52.2 51.6 29.8 Median age for Black or African American residents32.6 6.9 52.2 Median age for American Indian / Alaska Native residents-856,941,507.2 24.8 49.0 Median age for Asian residents57.0 44.7 -679,849,340.2 Median age for Native Hawaiian / Pacific Islander residents-858,307,848.3 -443,298,968.6 33.3 Median age for Other race residents31.2 54.4 31.0 Median age for Two or more races residents31.1 31.0 52.4 Median age for White alone residents52.5 52.0 30.0 Median age for Hispanic or Latino residents27.7 32.3
Owner/renter occupied households by race in South Venice
House owners and renters - White residents 5,989 83.9% Owner occupied1,149 16.1% Renter occupiedHouse owners and renters - Black or African American residents 5 100.0% Renter occupiedHouse owners and renters - American Indian / Alaska Native residents 44 72.7% Owner occupied17 27.3% Renter occupiedHouse owners and renters - Asian residents 128 100.0% Owner occupiedHouse owners and renters - Other race residents 45 30.0% Owner occupied105 70.0% Renter occupiedHouse owners and renters - Two or more races residents 162 59.3% Owner occupied111 40.7% Renter occupiedHouse owners and renters - White alone residents 5,975 84.1% Owner occupied1,128 15.9% Renter occupiedHouse owners and renters - Hispanic or Latino residents 171 51.1% Owner occupied164 48.9% Renter occupied
Language usage in South Venice
English speakers - Total 87.3% of residents of South Venice speak English at home.
4.5% of residents speak Spanish at home 457 56.8% Speak English very well347 43.2% Speak English less than very well8.2% of residents speak other language at home 814 56.4% Speak English very well630 43.6% Speak English less than very well
English speakers - Born in the United States 97.1% of residents of South Venice speak English at home.
1.3% of residents speak Spanish at home 103 68.2% Speak English very well48 31.8% Speak English less than very well1.7% of residents speak other language at home 173 90.6% Speak English very well18 9.4% Speak English less than very well
English speakers - Native, born elsewhere 56.4% of residents of South Venice speak English at home.
25.1% of residents speak Spanish at home 79 76.0% Speak English very well25 24.0% Speak English less than very well20.5% of residents speak other language at home 85 100.0% Speak English less than very well
English speakers - Foreign-born 31.2% of residents of South Venice speak English at home.
21.3% of residents speak Spanish at home 244 53.6% Speak English very well211 46.4% Speak English less than very well48.3% of residents speak other language at home 567 54.9% Speak English very well466 45.1% Speak English less than very well
White (Caucasian) - Speak only English Native:
97.7% (13,628)Foreign-born:
37.3% (498)
White (Caucasian) - Speak another language Native:
2.5% (349)Foreign-born:
62.8% (840)
Black or African American - Speak only English Native:
92.6% (48)Foreign-born:
100.0% (7)
Asian - Speak another language Native:
89.1% (54)Foreign-born:
76.1% (196)
Other race - Speak only English Native:
74.9% (369)Foreign-born:
40.4% (113)
Other race - Speak another language Native:
27.1% (133)Foreign-born:
65.1% (182)
Two or more races - Speak another language Native:
16.7% (167)Foreign-born:
100.0% (63)
White alone - Speak only English Native:
97.5% (13,566)Foreign-born:
39.5% (530)
White alone - Speak another language Native:
2.5% (350)Foreign-born:
61.3% (824)
Hispanic or Latino - Speak only English Native:
78.6% (717)Foreign-born:
8.7% (43)
Hispanic or Latino - Speak another language Native:
25.6% (234)Foreign-born:
90.3% (444)
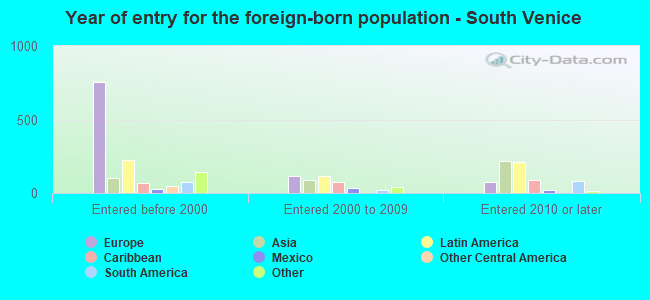
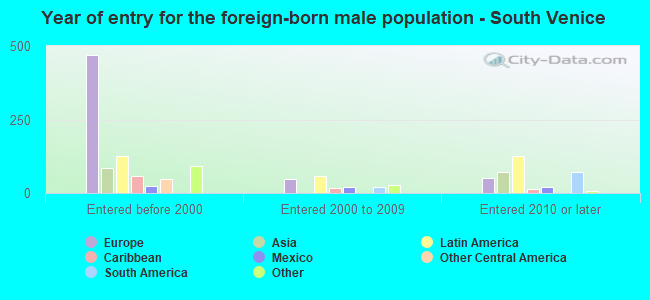
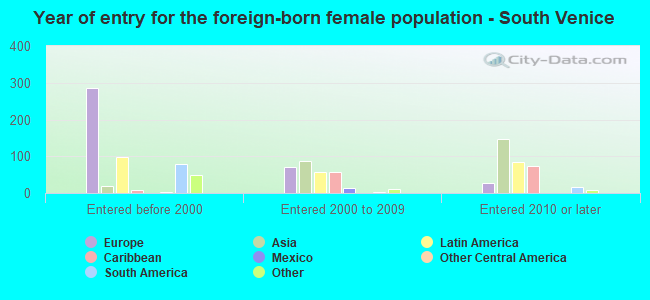
Foreign-born residents in South Venice 1,938 residents are foreign born (5.0% Europe , 2.9% Latin America , 1.8% Asia ).
This city:
10.5%Florida:
21.1%
Marital status for residents in South Venice Marital status - White (Caucasian) population 15 years and over
Males 21.8% Never married64.9% Now married0.3% Separated2.6% Widowed10.5% DivorcedFemales 15.3% Never married60.6% Now married0.8% Separated9.4% Widowed14.0% DivorcedWomen who gave birth in the past 12 months Now married:
100.0% (17)Unmarried:
0.0% (0)
Women who did not give birth in the past 12 months Now married:
58.1% (1,541)Unmarried:
41.9% (1,110)
Marital status - Black or African American population 15 years and over
Males 86.5% Never married0.0% Now married0.0% Separated0.0% Widowed13.5% DivorcedFemales 14.3% Never married85.7% Now married0.0% Separated0.0% Widowed0.0% DivorcedWomen who gave birth in the past 12 months Now married:
100.0% (6)Unmarried:
0.0% (0)
Women who did not give birth in the past 12 months Now married:
0.0% (0)Unmarried:
100.0% (1)
Marital status - Asian population 15 years and over
Males 0.0% Never married100.0% Now married0.0% Separated0.0% Widowed0.0% DivorcedFemales 0.0% Never married100.0% Now married0.0% Separated0.0% Widowed0.0% DivorcedWomen who did not give birth in the past 12 months Now married:
100.0% (82)Unmarried:
0.0% (0)
Marital status - Other race population 15 years and over
Males 31.0% Never married56.1% Now married6.6% Separated0.0% Widowed6.3% DivorcedFemales 36.5% Never married60.4% Now married0.0% Separated0.0% Widowed3.1% DivorcedWomen who gave birth in the past 12 months Now married:
100.0% (37)Unmarried:
0.0% (0)
Women who did not give birth in the past 12 months Now married:
18.4% (13)Unmarried:
81.6% (57)
Marital status - Two or more races population 15 years and over
Males 36.8% Never married49.4% Now married0.0% Separated0.0% Widowed13.8% DivorcedFemales 27.7% Never married56.0% Now married0.0% Separated0.0% Widowed16.3% DivorcedWomen who did not give birth in the past 12 months Now married:
55.3% (182)Unmarried:
44.7% (147)
Marital status - White alone, not Hispanic / Latino population 15 years and over
Males 21.4% Never married65.1% Now married0.3% Separated2.6% Widowed10.7% DivorcedFemales 14.8% Never married60.9% Now married0.8% Separated9.8% Widowed13.8% DivorcedWomen who gave birth in the past 12 months Now married:
100.0% (17)Unmarried:
0.0% (0)
Women who did not give birth in the past 12 months Now married:
57.9% (1,498)Unmarried:
42.1% (1,088)
Marital status - Hispanic or Latino population 15 years and over
Males 37.6% Never married53.1% Now married4.2% Separated0.0% Widowed5.1% DivorcedFemales 39.0% Never married45.9% Now married0.0% Separated0.0% Widowed15.1% DivorcedWomen who gave birth in the past 12 months Now married:
100.0% (28)Unmarried:
0.0% (0)
Women who did not give birth in the past 12 months Now married:
47.0% (166)Unmarried:
53.0% (187)
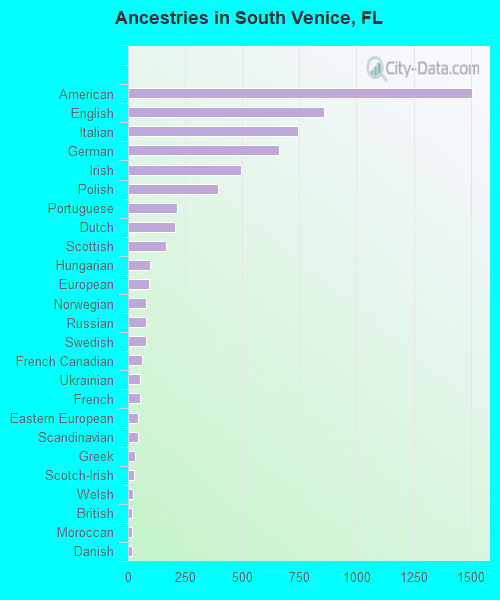
Ancestries in South Venice
1,505 20.0% American858 11.4% English744 9.9% Italian660 8.8% German494 6.6% Irish395 5.2% Polish215 2.9% Portuguese206 2.7% Dutch165 2.2% Scottish97 1.3% Hungarian93 1.2% European78 1.0% Norwegian78 1.0% Russian78 1.0% Swedish61 0.8% French Canadian53 0.7% Ukrainian52 0.7% French42 0.6% Eastern European42 0.6% Scandinavian32 0.4% Greek28 0.4% Scotch-Irish21 0.3% Welsh18 0.2% British16 0.2% Moroccan16 0.2% Danish12 0.2% Bulgarian12 0.2% Czech12 0.2% Romanian11 0.1% Lithuanian7 0.09% Finnish6 0.08% Canadian6 0.08% Slovak5 0.07% Czechoslovakian5 0.07% Swiss
Children Nativity (place of birth) in South Venice
Children under 6 years - Living with two parents Both parents native 574 100.0% NativeBoth parents foreign-born 149 100.0% NativeOne native, one foreign-born parent 66 100.0% NativeChildren under 6 years - Living with one parent Native parent 139 100.0% NativeForeign-born parent 66 54.5% Native55 45.5% Foreign-bornChildren 6 to 17 years - Living with two parents Both parents native 1,052 100.0% NativeBoth parents foreign-born 69 49.2% Native71 50.8% Foreign-bornOne native, one foreign-born parent 130 100.0% NativeChildren 6 to 17 years - Living with one parent Native parent 310 100.0% NativeForeign-born parent 46 58.1% Native33 41.9% Foreign-born
Grandparents responsible for own grandchildren in South Venice
Grandparents (30 to 59 years) White / Caucasian 39 12.9% Responsible for grandchildren264 87.1% Not responsible for grandchildrenOther race 47 100.0% Not responsible for grandchildrenWhite alone, not Hispanic / Latino 41 17.7% Responsible for grandchildren190 82.3% Not responsible for grandchildrenHispanic or Latino 95 100.0% Not responsible for grandchildrenGrandparents (60 years and over) White / Caucasian 45 75.3% Responsible for grandchildren15 24.7% Not responsible for grandchildrenWhite alone, not Hispanic / Latino 47 74.8% Responsible for grandchildren16 25.2% Not responsible for grandchildren