Races in Spokane Valley, Washington (WA) Detailed Stats
Data:
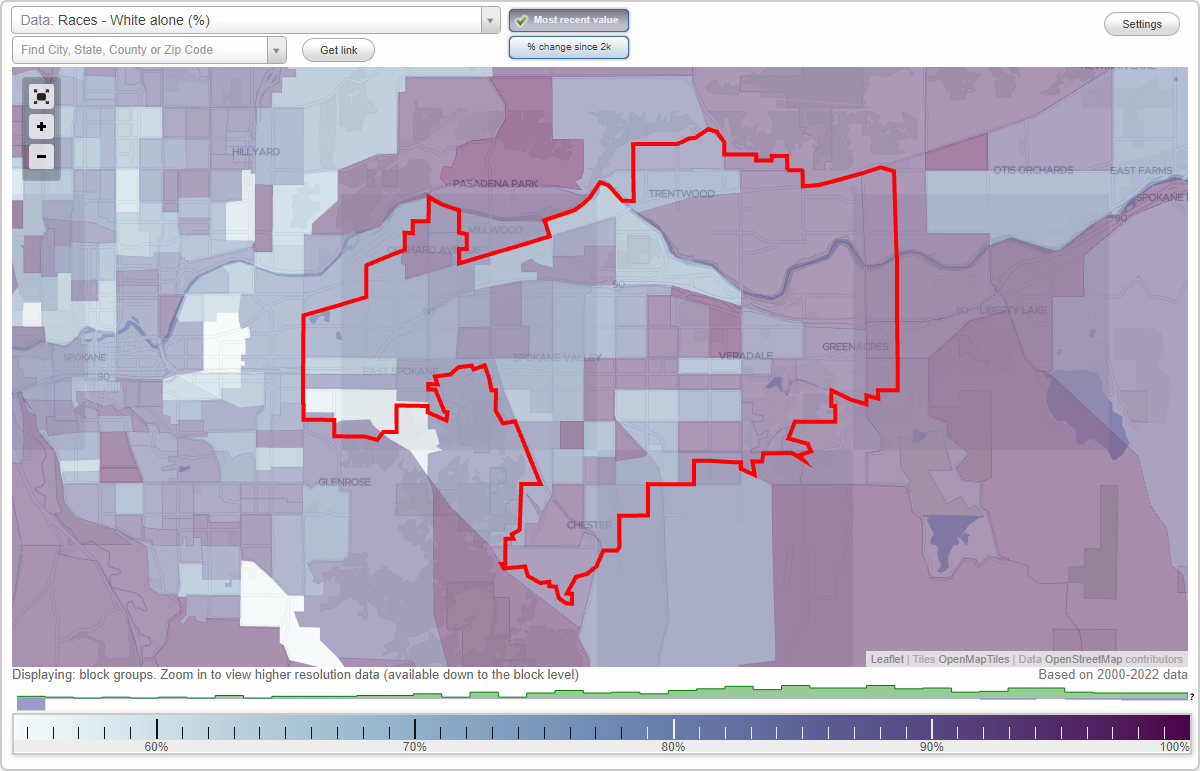
Races - White alone (%)
Races - White alone (% change since 2000)
Races - Black alone (%)
Races - Black alone (% change since 2000)
Races - American Indian alone (%)
Races - American Indian alone (% change since 2000)
Races - Asian alone (%)
Races - Asian alone (% change since 2000)
Races - Hispanic (%)
Races - Hispanic (% change since 2000)
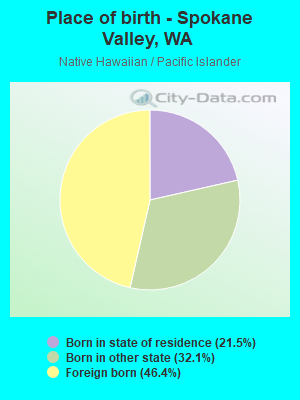
Races - Native Hawaiian and Other Pacific Islander alone (%)
Races - Native Hawaiian and Other Pacific Islander alone (% change since 2000)
Races - Two or more races(%)
Races - Two or more races(% change since 2000)
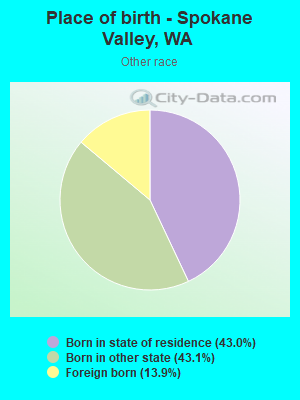
Races - Other race alone (%)
Races - Other race alone (% change since 2000)
Racial diversity
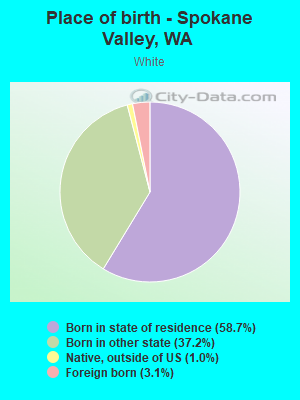
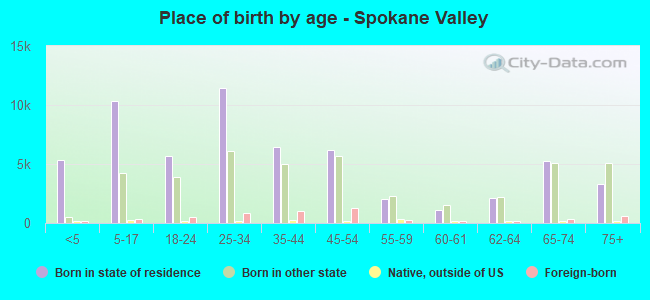
Place of birth - Born in state of residence (%)
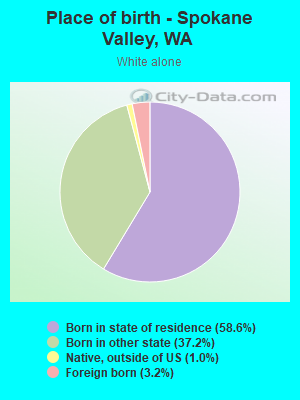
Place of birth - Born in state of residence (%) - White
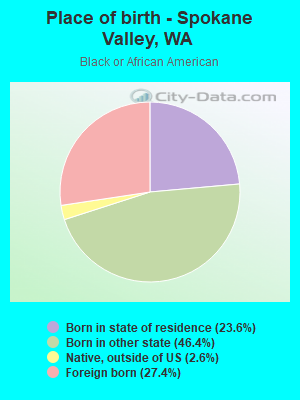
Place of birth - Born in state of residence (%) - Black or African American
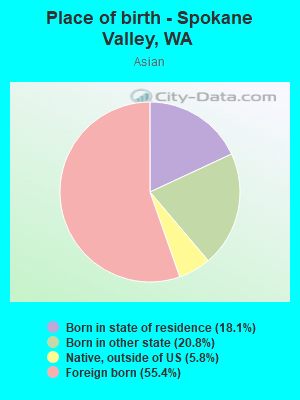
Place of birth - Born in state of residence (%) - Asian
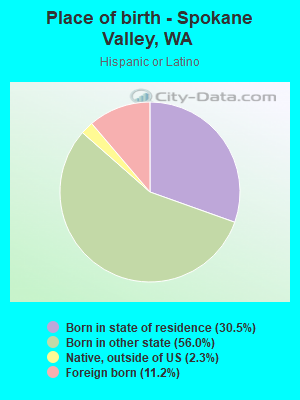
Place of birth - Born in state of residence (%) - Hispanic or Latino
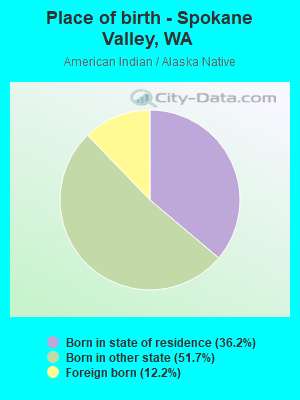
Place of birth - Born in state of residence (%) - American Indian and Alaska Native
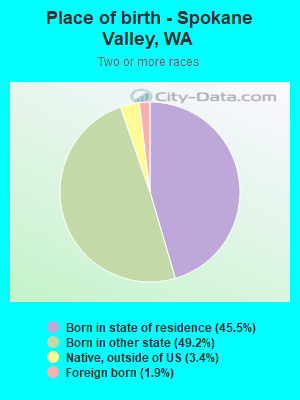
Place of birth - Born in state of residence (%) - Multirace
Place of birth - Born in state of residence (%) - Other Race
Place of birth - Born in other state (%)
Place of birth - Born in other state (%) - White
Place of birth - Born in other state (%) - Black or African American
Place of birth - Born in other state (%) - Asian
Place of birth - Born in other state (%) - Hispanic or Latino
Place of birth - Born in other state (%) - American Indian and Alaska Native
Place of birth - Born in other state (%) - Multirace
Place of birth - Born in other state (%) - Other Race
Place of birth - Native, outside of US (%)
Place of birth - Native, outside of US (%) - White
Place of birth - Native, outside of US (%) - Black or African American
Place of birth - Native, outside of US (%) - Asian
Place of birth - Native, outside of US (%) - Hispanic or Latino
Place of birth - Native, outside of US (%) - American Indian and Alaska Native
Place of birth - Native, outside of US (%) - Multirace
Place of birth - Native, outside of US (%) - Other Race
Place of birth - Foreign born (%)
Place of birth - Foreign born (%) - White
Place of birth - Foreign born (%) - Black or African American
Place of birth - Foreign born (%) - Asian
Place of birth - Foreign born (%) - Hispanic or Latino
Place of birth - Foreign born (%) - American Indian and Alaska Native
Place of birth - Foreign born (%) - Multirace
Place of birth - Foreign born (%) - Other Race
Residents speaking English at home (%)
Residents speaking English at home - Born in the United States (%)
Residents speaking English at home - Native, born elsewhere (%)
Residents speaking English at home - Foreign born (%)
Residents speaking Spanish at home (%)
Residents speaking Spanish at home - Born in the United States (%)
Residents speaking Spanish at home - Native, born elsewhere (%)
Residents speaking Spanish at home - Foreign born (%)
Residents speaking other language at home (%)
Residents speaking other language at home - Born in the United States (%)
Residents speaking other language at home - Native, born elsewhere (%)
Residents speaking other language at home - Foreign born (%)
Marital status - Never married (%)
Marital status - Now married (%)
Marital status - Separated (%)
Marital status - Widowed (%)
Marital status - Divorced (%)
Ancestries Reported - Arab (%)
Ancestries Reported - Czech (%)
Ancestries Reported - Danish (%)
Ancestries Reported - Dutch (%)
Ancestries Reported - English (%)
Ancestries Reported - French (%)
Ancestries Reported - French Canadian (%)
Ancestries Reported - German (%)
Ancestries Reported - Greek (%)
Ancestries Reported - Hungarian (%)
Ancestries Reported - Irish (%)
Ancestries Reported - Italian (%)
Ancestries Reported - Lithuanian (%)
Ancestries Reported - Norwegian (%)
Ancestries Reported - Polish (%)
Ancestries Reported - Portuguese (%)
Ancestries Reported - Russian (%)
Ancestries Reported - Scotch-Irish (%)
Ancestries Reported - Scottish (%)
Ancestries Reported - Slovak (%)
Ancestries Reported - Subsaharan African (%)
Ancestries Reported - Swedish (%)
Ancestries Reported - Swiss (%)
Ancestries Reported - Ukrainian (%)
Ancestries Reported - United States (%)
Ancestries Reported - Welsh (%)
Ancestries Reported - West Indian (%)
Ancestries Reported - Other (%)
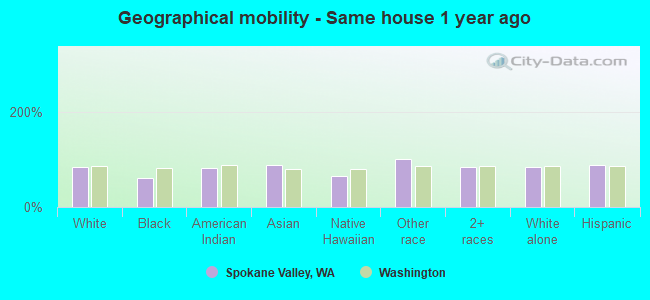
Geographical mobility - Same house 1 year ago (%)
Geographical mobility - Same house 1 year ago (%) - White
Geographical mobility - Same house 1 year ago (%) - Black or African American
Geographical mobility - Same house 1 year ago (%) - Asian
Geographical mobility - Same house 1 year ago (%) - Hispanic or Latino
Geographical mobility - Same house 1 year ago (%) - American Indian and Alaska Native
Geographical mobility - Same house 1 year ago (%) - Multirace
Geographical mobility - Same house 1 year ago (%) - Other Race
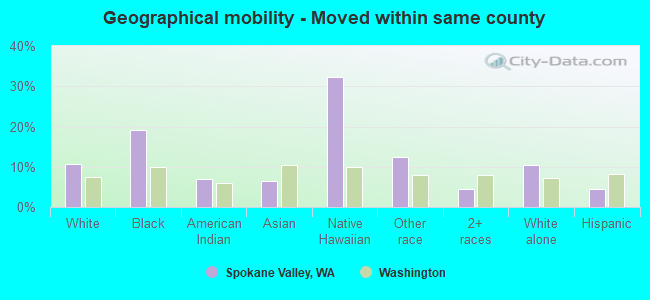
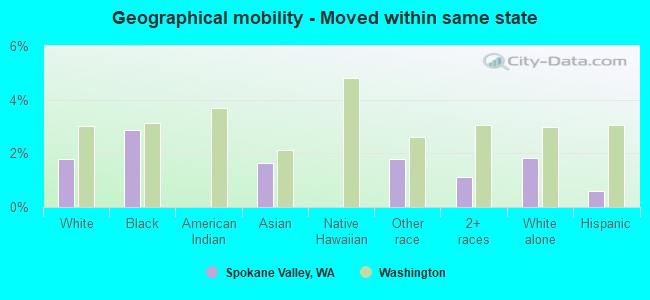
Geographical mobility - Moved within same county (%)
Geographical mobility - Moved within same county (%) - White
Geographical mobility - Moved within same county (%) - Black or African American
Geographical mobility - Moved within same county (%) - Asian
Geographical mobility - Moved within same county (%) - Hispanic or Latino
Geographical mobility - Moved within same county (%) - American Indian and Alaska Native
Geographical mobility - Moved within same county (%) - Multirace
Geographical mobility - Moved within same county (%) - Other Race
Geographical mobility - Moved from different county within same state (%)
Geographical mobility - Moved from different county within same state (%) - White
Geographical mobility - Moved from different county within same state (%) - Black or African American
Geographical mobility - Moved from different county within same state (%) - Asian
Geographical mobility - Moved from different county within same state (%) - Hispanic or Latino
Geographical mobility - Moved from different county within same state (%) - American Indian and Alaska Native
Geographical mobility - Moved from different county within same state (%) - Multirace
Geographical mobility - Moved from different county within same state (%) - Other Race
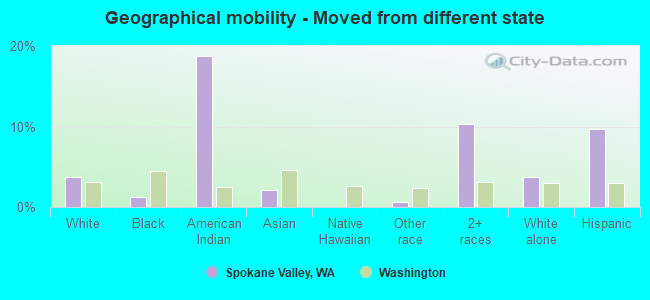
Geographical mobility - Moved from different state (%)
Geographical mobility - Moved from different state (%) - White
Geographical mobility - Moved from different state (%) - Black or African American
Geographical mobility - Moved from different state (%) - Asian
Geographical mobility - Moved from different state (%) - Hispanic or Latino
Geographical mobility - Moved from different state (%) - American Indian and Alaska Native
Geographical mobility - Moved from different state (%) - Multirace
Geographical mobility - Moved from different state (%) - Other Race
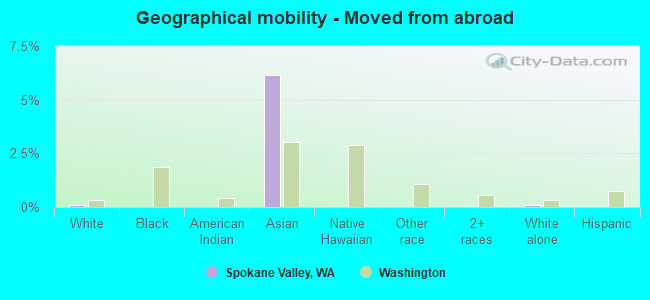
Geographical mobility - Moved from abroad (%)
Geographical mobility - Moved from abroad (%) - White
Geographical mobility - Moved from abroad (%) - Black or African American
Geographical mobility - Moved from abroad (%) - Asian
Geographical mobility - Moved from abroad (%) - Hispanic or Latino
Geographical mobility - Moved from abroad (%) - American Indian and Alaska Native
Geographical mobility - Moved from abroad (%) - Multirace
Geographical mobility - Moved from abroad (%) - Other Race
Place of birth for the foreign-born population - Ireland (%)
Place of birth for the foreign-born population - Denmark (%)
Place of birth for the foreign-born population - Norway (%)
Place of birth for the foreign-born population - Sweden (%)
Place of birth for the foreign-born population - United Kingdom (%)
Place of birth for the foreign-born population - England (%)
Place of birth for the foreign-born population - Scotland (%)
Place of birth for the foreign-born population - Other Northern Europe (%)
Place of birth for the foreign-born population - Austria (%)
Place of birth for the foreign-born population - Belgium (%)
Place of birth for the foreign-born population - France (%)
Place of birth for the foreign-born population - Germany (%)
Place of birth for the foreign-born population - Netherlands (%)
Place of birth for the foreign-born population - Switzerland (%)
Place of birth for the foreign-born population - Other Western Europe (%)
Place of birth for the foreign-born population - Greece (%)
Place of birth for the foreign-born population - Italy (%)
Place of birth for the foreign-born population - Portugal (%)
Place of birth for the foreign-born population - Spain (%)
Place of birth for the foreign-born population - Other Southern Europe (%)
Place of birth for the foreign-born population - Albania (%)
Place of birth for the foreign-born population - Belarus (%)
Place of birth for the foreign-born population - Bosnia and Herzegovina (%)
Place of birth for the foreign-born population - Bulgaria (%)
Place of birth for the foreign-born population - Croatia (%)
Place of birth for the foreign-born population - Czechoslovakia (%)
Place of birth for the foreign-born population - Hungary (%)
Place of birth for the foreign-born population - Latvia (%)
Place of birth for the foreign-born population - Lithuania (%)
Place of birth for the foreign-born population - North Macedonia (Macedonia) (%)
Place of birth for the foreign-born population - Moldova (%)
Place of birth for the foreign-born population - Poland (%)
Place of birth for the foreign-born population - Romania (%)
Place of birth for the foreign-born population - Russia (%)
Place of birth for the foreign-born population - Serbia (%)
Place of birth for the foreign-born population - Ukraine (%)
Place of birth for the foreign-born population - Other Eastern Europe (%)
Place of birth for the foreign-born population - China (%)
Place of birth for the foreign-born population - Hong Kong (%)
Place of birth for the foreign-born population - Taiwan (%)
Place of birth for the foreign-born population - Japan (%)
Place of birth for the foreign-born population - Korea (%)
Place of birth for the foreign-born population - Other Eastern Asia (%)
Place of birth for the foreign-born population - Afghanistan (%)
Place of birth for the foreign-born population - Bangladesh (%)
Place of birth for the foreign-born population - India (%)
Place of birth for the foreign-born population - Iran (%)
Place of birth for the foreign-born population - Kazakhstan (%)
Place of birth for the foreign-born population - Nepal (%)
Place of birth for the foreign-born population - Pakistan (%)
Place of birth for the foreign-born population - Sri Lanka (%)
Place of birth for the foreign-born population - Uzbekistan (%)
Place of birth for the foreign-born population - Other South Central Asia (%)
Place of birth for the foreign-born population - Burma (%)
Place of birth for the foreign-born population - Cambodia (%)
Place of birth for the foreign-born population - Indonesia (%)
Place of birth for the foreign-born population - Laos (%)
Place of birth for the foreign-born population - Malaysia (%)
Place of birth for the foreign-born population - Philippines (%)
Place of birth for the foreign-born population - Singapore (%)
Place of birth for the foreign-born population - Thailand (%)
Place of birth for the foreign-born population - Vietnam (%)
Place of birth for the foreign-born population - Other South Eastern Asia (%)
Place of birth for the foreign-born population - Armenia (%)
Place of birth for the foreign-born population - Iraq (%)
Place of birth for the foreign-born population - Israel (%)
Place of birth for the foreign-born population - Jordan (%)
Place of birth for the foreign-born population - Kuwait (%)
Place of birth for the foreign-born population - Lebanon (%)
Place of birth for the foreign-born population - Saudi Arabia (%)
Place of birth for the foreign-born population - Syria (%)
Place of birth for the foreign-born population - Turkey (%)
Place of birth for the foreign-born population - Yemen (%)
Place of birth for the foreign-born population - Other Western Asia (%)
Place of birth for the foreign-born population - Eritrea (%)
Place of birth for the foreign-born population - Ethiopia (%)
Place of birth for the foreign-born population - Kenya (%)
Place of birth for the foreign-born population - Somalia (%)
Place of birth for the foreign-born population - Uganda (%)
Place of birth for the foreign-born population - Zimbabwe (%)
Place of birth for the foreign-born population - Other Eastern Africa (%)
Place of birth for the foreign-born population - Cameroon (%)
Place of birth for the foreign-born population - Congo (%)
Place of birth for the foreign-born population - Democratic Republic of Congo (Zaire) (%)
Place of birth for the foreign-born population - Other Middle Africa (%)
Place of birth for the foreign-born population - Egypt (%)
Place of birth for the foreign-born population - Morocco (%)
Place of birth for the foreign-born population - Sudan (%)
Place of birth for the foreign-born population - Other Northern Africa (%)
Place of birth for the foreign-born population - South Africa (%)
Place of birth for the foreign-born population - Other Southern Africa (%)
Place of birth for the foreign-born population - Cabo Verde (%)
Place of birth for the foreign-born population - Ghana (%)
Place of birth for the foreign-born population - Liberia (%)
Place of birth for the foreign-born population - Nigeria (%)
Place of birth for the foreign-born population - Senegal (%)
Place of birth for the foreign-born population - Sierra Leone (%)
Place of birth for the foreign-born population - Other Western Africa (%)
Place of birth for the foreign-born population - Australia (%)
Place of birth for the foreign-born population - New Zealand (%)
Place of birth for the foreign-born population - Fiji (%)
Place of birth for the foreign-born population - Micronesia (%)
Place of birth for the foreign-born population - Bahamas (%)
Place of birth for the foreign-born population - Barbados (%)
Place of birth for the foreign-born population - Cuba (%)
Place of birth for the foreign-born population - Dominica (%)
Place of birth for the foreign-born population - Dominican Republic (%)
Place of birth for the foreign-born population - Grenada (%)
Place of birth for the foreign-born population - Haiti (%)
Place of birth for the foreign-born population - Jamaica (%)
Place of birth for the foreign-born population - St. Vincent and the Grenadines (%)
Place of birth for the foreign-born population - Trinidad and Tobago (%)
Place of birth for the foreign-born population - West Indies (%)
Place of birth for the foreign-born population - Other Caribbean (%)
Place of birth for the foreign-born population - Belize (%)
Place of birth for the foreign-born population - Costa Rica (%)
Place of birth for the foreign-born population - El Salvador (%)
Place of birth for the foreign-born population - Guatemala (%)
Place of birth for the foreign-born population - Honduras (%)
Place of birth for the foreign-born population - Mexico (%)
Place of birth for the foreign-born population - Nicaragua (%)
Place of birth for the foreign-born population - Panama (%)
Place of birth for the foreign-born population - Other Central America (%)
Place of birth for the foreign-born population - Argentina (%)
Place of birth for the foreign-born population - Bolivia (%)
Place of birth for the foreign-born population - Brazil (%)
Place of birth for the foreign-born population - Chile (%)
Place of birth for the foreign-born population - Colombia (%)
Place of birth for the foreign-born population - Ecuador (%)
Place of birth for the foreign-born population - Guyana (%)
Place of birth for the foreign-born population - Peru (%)
Place of birth for the foreign-born population - Uruguay (%)
Place of birth for the foreign-born population - Venezuela (%)
Place of birth for the foreign-born population - Other South America (%)
Place of birth for the foreign-born population - Canada (%)
Place of birth for the foreign-born population - Other Northern America (%)
Place of birth for the foreign-born population - Other (%)
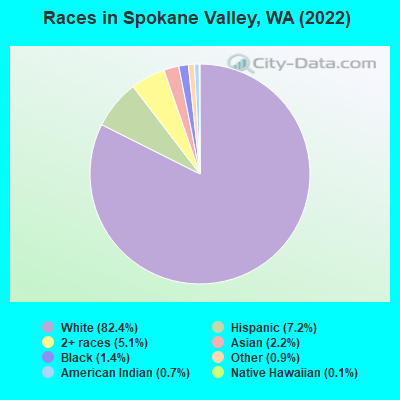
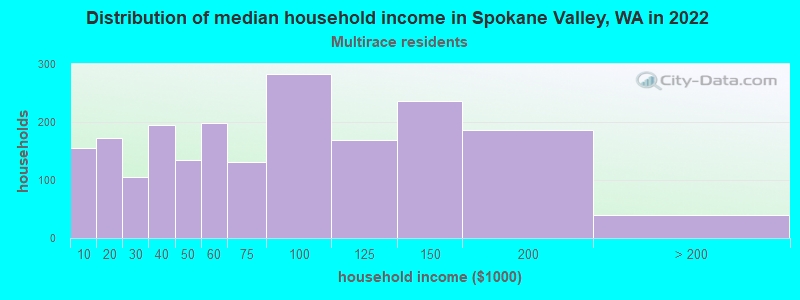
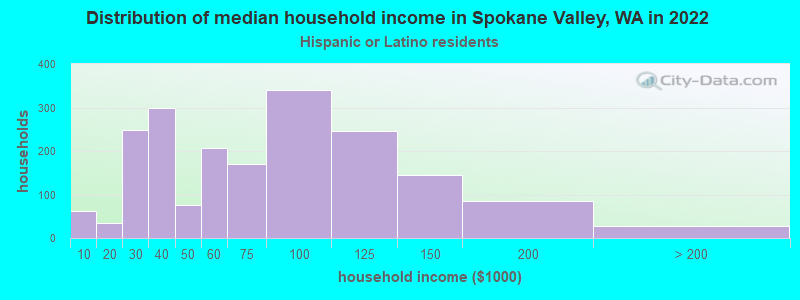
According to 2022 data, the most numerous races in Spokane Valley, WA are White alone (88,437 residents), Hispanic (7,707 residents), and Asian alone (2,355 residents). 93.8% of Spokane Valley residents speak English at home.
Race distribution in Spokane Valley 88,437 82.4% White alone 7,707 7.2% Hispanic 5,495 5.1% Two or more races 2,355 2.2% Asian alone 1,456 1.4% Black alone 939 0.9% Other race alone 790 0.7% American Indian alone 146 0.1% Native Hawaiian and Other
2000 2022
4,652,490 78.9% White alone 441,509 7.5% Hispanic 319,401 5.4% Asian alone 184,631 3.1% Black alone 175,926 3.0% Two or more races 85,396 1.4% American Indian alone 22,779 0.4% Native Hawaiian and Other 11,989 0.2% Other race alone
4,941,456 63.5% White alone 1,093,313 14.0% Hispanic 755,832 9.7% Asian alone 523,448 6.7% Two or more races 299,537 3.8% Black alone 69,024 0.9% American Indian alone 52,231 0.7% Native Hawaiian and Other 50,945 0.7% Other race alone
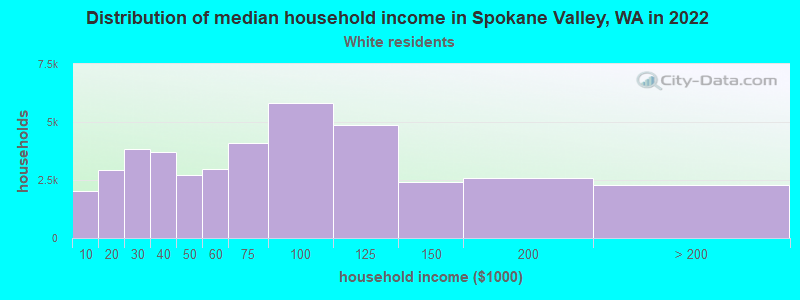
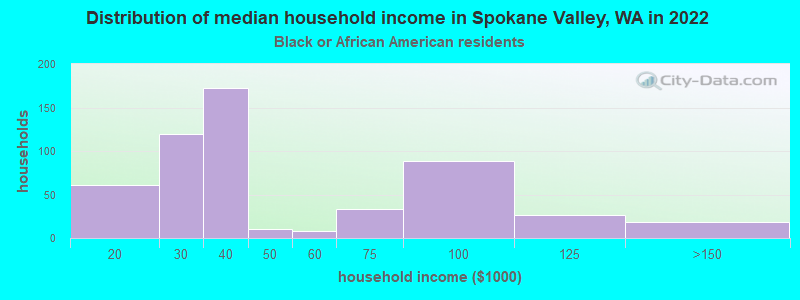
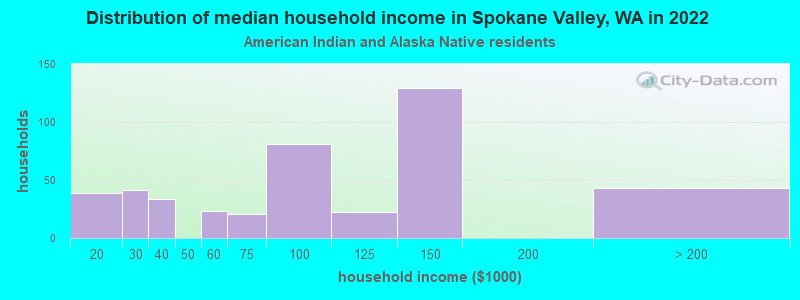
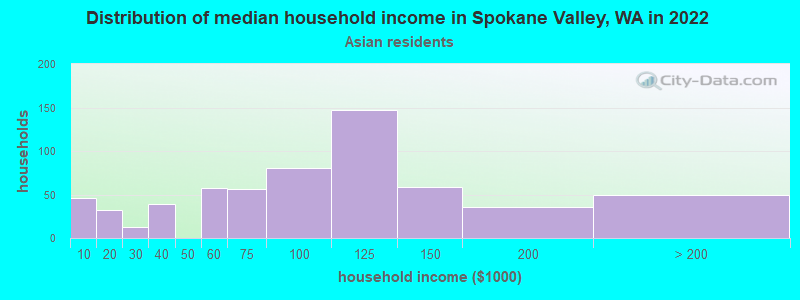
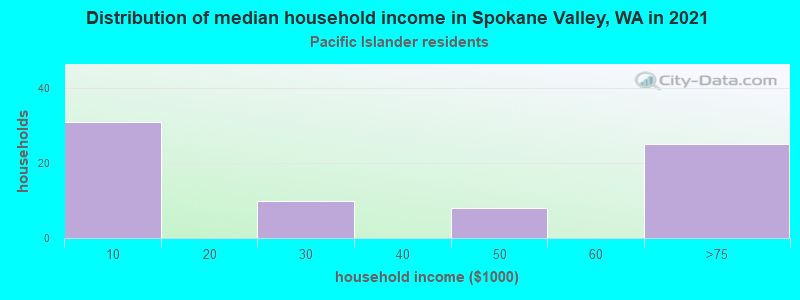
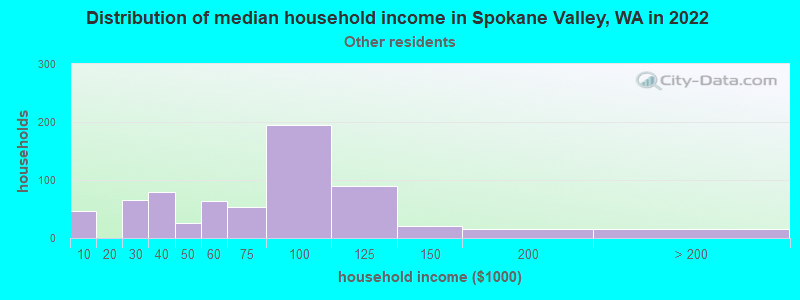
Income and house value in Spokane Valley Median household income in 2022 $65,378 White non-Hispanic householders$34,650 Black householders$106,315 American Indian and Alaska Native householders$108,137 Asian householders$88,151 Some other race householders$68,939 Two or more races householders$94,517 Hispanic or Latino race householders
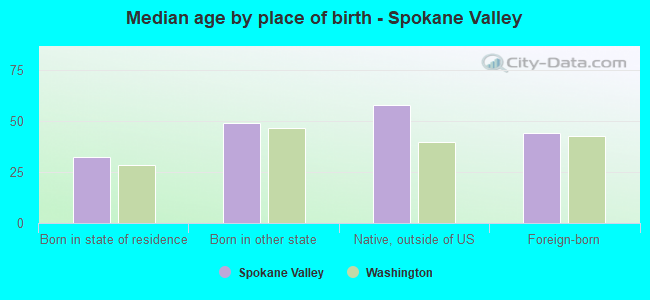
Median age by race in Spokane Valley
39.9 Median age for White residents38.8 41.9 36.4 Median age for Black or African American residents39.5 32.1 32.3 Median age for American Indian / Alaska Native residents42.6 25.9 48.1 Median age for Asian residents49.3 47.2 28.6 Median age for Native Hawaiian / Pacific Islander residents-666,666,666.0 -666,666,666.0 34.5 Median age for Other race residents33.9 34.8 23.5 Median age for Two or more races residents26.3 23.0 40.3 Median age for White alone residents39.1 42.4 28.8 Median age for Hispanic or Latino residents29.8 28.5
Owner/renter occupied households by race in Spokane Valley
House owners and renters - White residents 22,946 57.1% Owner occupied17,256 42.9% Renter occupiedHouse owners and renters - Black or African American residents 89 15.3% Owner occupied489 84.7% Renter occupiedHouse owners and renters - American Indian / Alaska Native residents 101 28.2% Owner occupied256 71.8% Renter occupiedHouse owners and renters - Asian residents 473 62.2% Owner occupied288 37.8% Renter occupiedHouse owners and renters - Native Hawaiian / Pacific Islander residents 24 29.6% Owner occupied56 70.4% Renter occupiedHouse owners and renters - Other race residents 729 79.7% Owner occupied186 20.3% Renter occupiedHouse owners and renters - Two or more races residents 1,345 65.4% Owner occupied713 34.6% Renter occupiedHouse owners and renters - White alone residents 22,820 57.8% Owner occupied16,628 42.2% Renter occupiedHouse owners and renters - Hispanic or Latino residents 1,288 50.8% Owner occupied1,245 49.2% Renter occupied
Language usage in Spokane Valley
English speakers - Total 93.8% of residents of Spokane Valley speak English at home.
1.7% of residents speak Spanish at home 1,354 76.5% Speak English very well416 23.5% Speak English less than very well4.5% of residents speak other language at home 2,678 59.3% Speak English very well1,839 40.7% Speak English less than very well
English speakers - Born in the United States 97.5% of residents of Spokane Valley speak English at home.
1.1% of residents speak Spanish at home 441 100.0% Speak English very well1.5% of residents speak other language at home 260 43.3% Speak English very well340 56.7% Speak English less than very well
English speakers - Native, born elsewhere 92.5% of residents of Spokane Valley speak English at home.
7.5% of residents speak other language at home 99 100.0% Speak English very well
English speakers - Foreign-born 27.5% of residents of Spokane Valley speak English at home.
14.4% of residents speak Spanish at home 343 45.2% Speak English very well416 54.8% Speak English less than very well58.1% of residents speak other language at home 1,565 51.1% Speak English very well1,499 48.9% Speak English less than very well
White (Caucasian) - Speak only English Native:
98.6% (81,356)Foreign-born:
35.1% (983)
White (Caucasian) - Speak another language Native:
1.4% (1,116)Foreign-born:
64.9% (1,821)
Black or African American - Speak only English Native:
100.0% (1,040)Foreign-born:
22.6% (121)
Black or African American - Speak another language Native:
1.2% (13)Foreign-born:
77.5% (414)
American Indian / Alaska Native - Speak only English Native:
87.6% (848)Foreign-born:
15.5% (17)
American Indian / Alaska Native - Speak another language Native:
11.8% (114)Foreign-born:
81.4% (88)
Asian - Speak only English Native:
45.2% (489)Foreign-born:
23.2% (311)
Asian - Speak another language Native:
54.8% (593)Foreign-born:
76.8% (1,031)
Native Hawaiian / Pacific Islander - Speak only English Native:
71.0% (114)Foreign-born:
4.0% (7)
Native Hawaiian / Pacific Islander - Speak another language Native:
29.3% (47)Foreign-born:
100.0% (180)
Other race - Speak only English Native:
67.2% (1,182)Foreign-born:
18.7% (61)
Other race - Speak another language Native:
33.2% (585)Foreign-born:
76.9% (249)
Two or more races - Speak only English Native:
93.7% (7,847)Foreign-born:
38.3% (69)
Two or more races - Speak another language Native:
6.3% (528)Foreign-born:
63.3% (113)
White alone - Speak only English Native:
98.7% (79,901)Foreign-born:
35.1% (983)
White alone - Speak another language Native:
1.3% (1,012)Foreign-born:
64.9% (1,821)
Hispanic or Latino - Speak only English Native:
81.1% (4,872)Foreign-born:
11.7% (80)
Hispanic or Latino - Speak another language Native:
18.9% (1,137)Foreign-born:
85.2% (582)
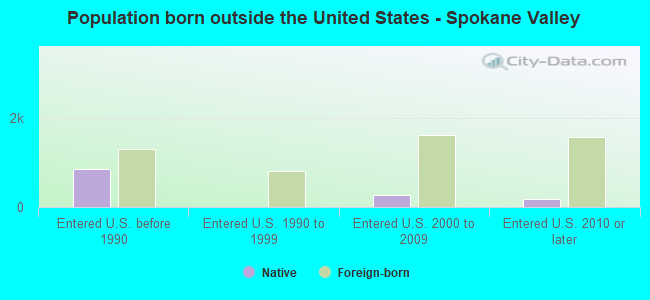
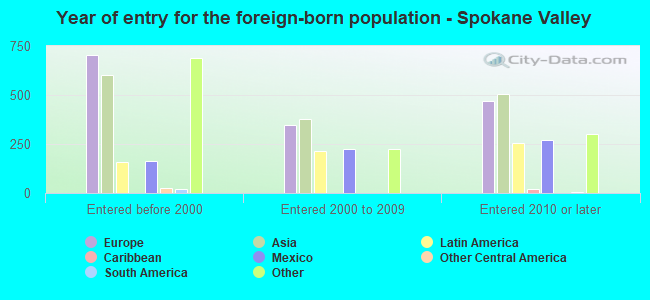
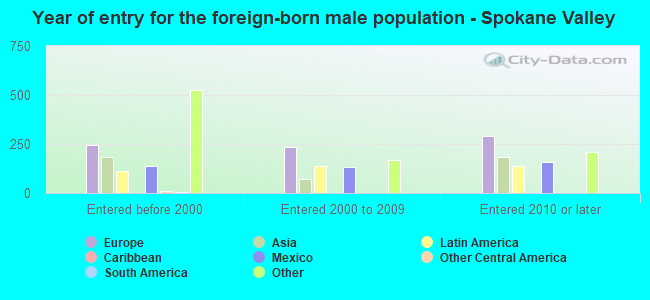
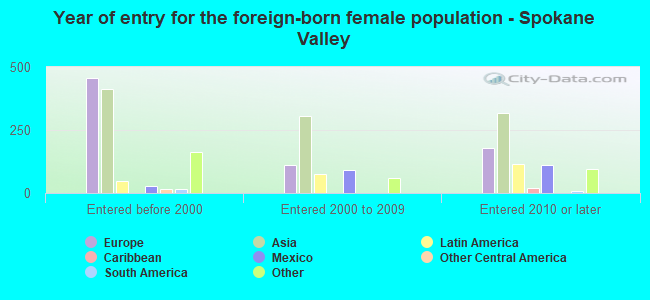
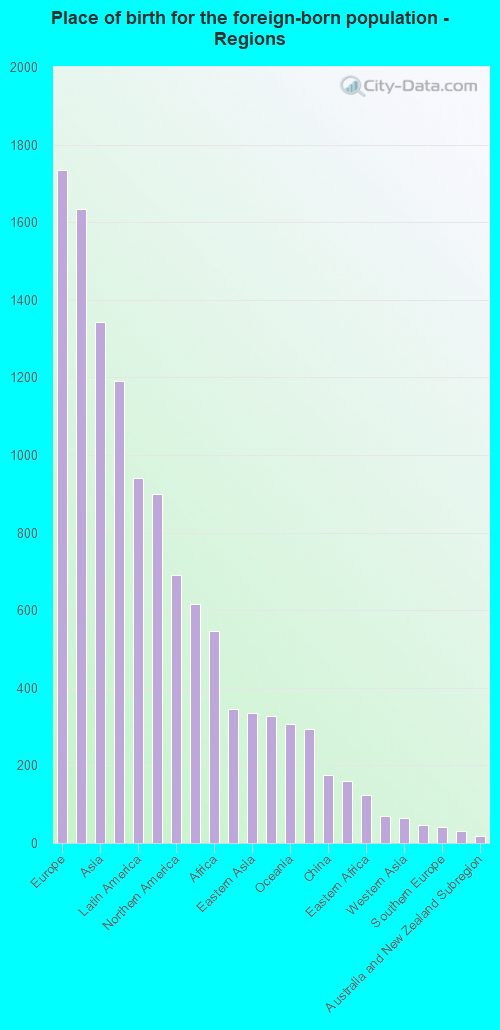
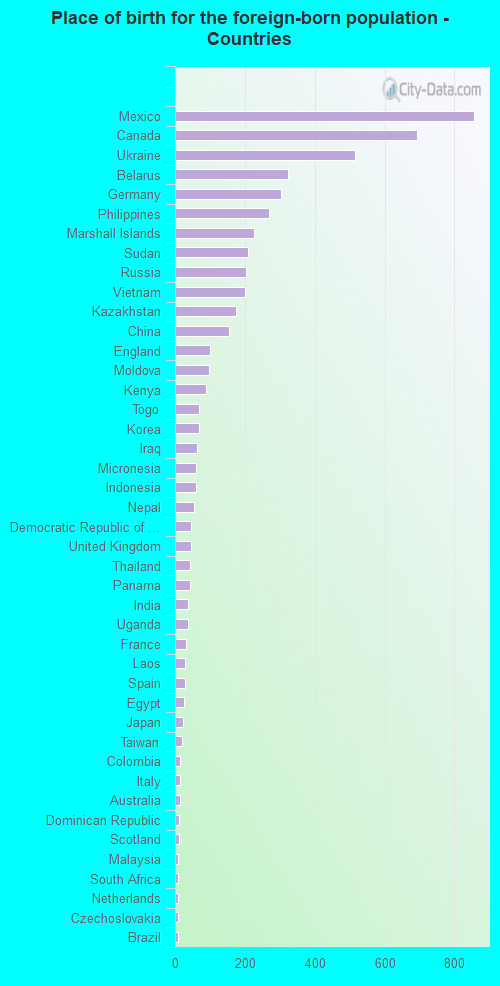
Foreign-born residents in Spokane Valley
Marital status for residents in Spokane Valley Marital status - White (Caucasian) population 15 years and over
Males 32.6% Never married50.4% Now married1.6% Separated2.7% Widowed12.7% DivorcedFemales 25.7% Never married45.5% Now married0.2% Separated10.3% Widowed18.3% DivorcedWomen who gave birth in the past 12 months Now married:
86.7% (1,229)Unmarried:
13.3% (189)
Women who did not give birth in the past 12 months Now married:
39.1% (7,055)Unmarried:
60.9% (10,972)
Marital status - Black or African American population 15 years and over
Males 50.2% Never married37.7% Now married4.5% Separated4.8% Widowed2.8% DivorcedFemales 36.4% Never married45.2% Now married0.0% Separated14.8% Widowed3.6% DivorcedWomen who did not give birth in the past 12 months Now married:
51.9% (111)Unmarried:
48.1% (103)
Marital status - American Indian / Alaska Native population 15 years and over
Males 48.7% Never married31.9% Now married2.7% Separated0.0% Widowed16.8% DivorcedFemales 30.8% Never married30.8% Now married0.0% Separated1.2% Widowed37.1% DivorcedWomen who gave birth in the past 12 months Now married:
100.0% (25)Unmarried:
0.0% (0)
Women who did not give birth in the past 12 months Now married:
30.1% (91)Unmarried:
69.9% (211)
Marital status - Asian population 15 years and over
Males 27.2% Never married55.3% Now married12.1% Separated3.0% Widowed2.5% DivorcedFemales 24.0% Never married61.6% Now married0.0% Separated12.3% Widowed2.2% DivorcedWomen who gave birth in the past 12 months Now married:
100.0% (19)Unmarried:
0.0% (0)
Women who did not give birth in the past 12 months Now married:
62.0% (462)Unmarried:
38.0% (283)
Marital status - Native Hawaiian / Pacific Islander population 15 years and over
Males 83.6% Never married16.4% Now married0.0% Separated0.0% Widowed0.0% DivorcedFemales 60.8% Never married19.6% Now married0.0% Separated0.0% Widowed19.6% DivorcedWomen who did not give birth in the past 12 months Now married:
21.1% (21)Unmarried:
78.9% (80)
Marital status - Other race population 15 years and over
Males 36.9% Never married56.8% Now married2.3% Separated0.0% Widowed4.1% DivorcedFemales 16.1% Never married80.6% Now married2.5% Separated0.7% Widowed0.0% DivorcedWomen who gave birth in the past 12 months Now married:
100.0% (32)Unmarried:
0.0% (0)
Women who did not give birth in the past 12 months Now married:
77.5% (437)Unmarried:
22.5% (127)
Marital status - Two or more races population 15 years and over
Males 65.2% Never married21.6% Now married0.0% Separated0.0% Widowed13.2% DivorcedFemales 50.8% Never married29.3% Now married4.2% Separated4.3% Widowed11.5% DivorcedWomen who gave birth in the past 12 months Now married:
100.0% (72)Unmarried:
0.0% (0)
Women who did not give birth in the past 12 months Now married:
27.3% (526)Unmarried:
72.7% (1,404)
Marital status - White alone, not Hispanic / Latino population 15 years and over
Males 31.9% Never married51.0% Now married1.6% Separated2.8% Widowed12.7% DivorcedFemales 25.4% Never married45.1% Now married0.2% Separated10.6% Widowed18.7% DivorcedWomen who gave birth in the past 12 months Now married:
86.0% (1,164)Unmarried:
14.0% (189)
Women who did not give birth in the past 12 months Now married:
38.7% (6,702)Unmarried:
61.3% (10,599)
Marital status - Hispanic or Latino population 15 years and over
Males 51.0% Never married35.7% Now married0.0% Separated0.0% Widowed13.2% DivorcedFemales 40.6% Never married47.5% Now married1.6% Separated1.0% Widowed9.3% DivorcedWomen who gave birth in the past 12 months Now married:
100.0% (94)Unmarried:
0.0% (0)
Women who did not give birth in the past 12 months Now married:
52.6% (967)Unmarried:
47.4% (872)
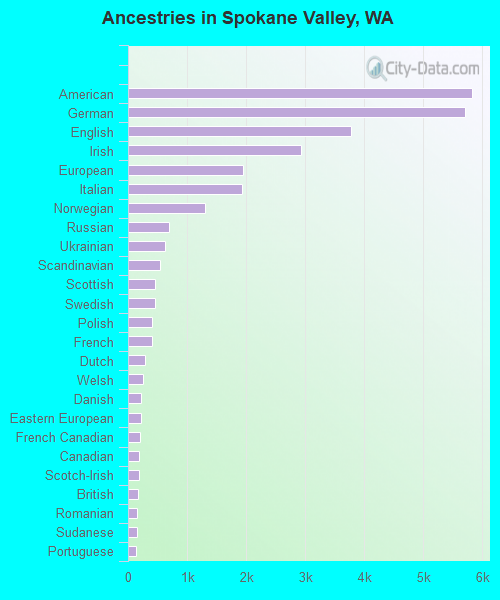
Ancestries in Spokane Valley
5,823 14.2% American5,716 14.0% German3,779 9.2% English2,937 7.2% Irish1,944 4.7% European1,933 4.7% Italian1,309 3.2% Norwegian700 1.7% Russian635 1.6% Ukrainian539 1.3% Scandinavian461 1.1% Scottish450 1.1% Swedish403 1.0% Polish402 1.0% French281 0.7% Dutch261 0.6% Welsh216 0.5% Danish215 0.5% Eastern European208 0.5% French Canadian182 0.4% Canadian178 0.4% Scotch-Irish167 0.4% British153 0.4% Romanian151 0.4% Sudanese130 0.3% Portuguese129 0.3% Northern European122 0.3% Arab119 0.3% Icelander83 0.2% Iraqi75 0.2% Yugoslavian73 0.2% Czech47 0.1% Greek45 0.1% Armenian45 0.1% Ugandan41 0.1% Kenyan40 0.10% Slovene36 0.09% Austrian33 0.08% Finnish31 0.08% Serbian26 0.06% African16 0.04% Lebanese12 0.03% Brazilian12 0.03% Hungarian11 0.03% Slovak10 0.02% Croatian5 0.01% Jordanian4 0.01% Swiss
Geographical mobility in Spokane Valley Same house 1 year ago 74,562 83.6% White (Caucasian)856 60.6% Black or African American931 81.1% American Indian / Alaska Native1,675 89.2% Asian263 64.4% Native Hawaiian / Pacific Islander2,487 100.0% Other race7,558 84.2% Two or more races73,491 84.0% White alone, not Hispanic / Latino7,088 89.5% Hispanic or LatinoMoved within same county 9,584 10.7% White / Caucasian270 19.1% Black or African American81 7.0% American Indian / Alaska Native120 6.4% Asian132 32.4% Native Hawaiian / Pacific Islander298 12.4% Other race393 4.4% Two or more races9,103 10.4% White alone, not Hispanic / Latino352 4.4% Hispanic or LatinoMoved within same state 1,604 1.8% White / Caucasian41 2.9% Black or African American31 1.7% Asian43 1.8% Other race99 1.1% Two or more races1,604 1.8% White alone, not Hispanic / Latino46 0.6% Hispanic or LatinoMoved from different state 3,321 3.7% White / Caucasian18 1.3% Black or African American216 18.8% American Indian / Alaska Native39 2.1% Asian15 0.6% Other race924 10.3% Two or more races3,250 3.7% White alone, not Hispanic / Latino770 9.7% Hispanic or LatinoMoved from abroad 92 0.1% White116 6.2% Asian92 0.1% White alone, not Hispanic / Latino
Children Nativity (place of birth) in Spokane Valley
Children under 6 years - Living with two parents Both parents native 3,900 100.0% NativeBoth parents foreign-born 457 83.8% Native89 16.2% Foreign-bornOne native, one foreign-born parent 730 100.0% NativeChildren under 6 years - Living with one parent Native parent 2,309 100.0% NativeForeign-born parent 35 100.0% NativeChildren 6 to 17 years - Living with two parents Both parents native 7,630 99.3% Native51 0.7% Foreign-bornBoth parents foreign-born 699 88.7% Native89 11.3% Foreign-bornOne native, one foreign-born parent 474 94.7% Native26 5.3% Foreign-bornChildren 6 to 17 years - Living with one parent Native parent 4,376 100.0% NativeForeign-born parent 269 60.7% Native174 39.3% Foreign-born
Grandparents responsible for own grandchildren in Spokane Valley
Grandparents (30 to 59 years) White / Caucasian 122 33.6% Responsible for grandchildren241 66.4% Not responsible for grandchildrenAmerican Indian / Alaska Native 14 100.0% Not responsible for grandchildrenNative Hawaiian / Pacific Islander 7 100.0% Not responsible for grandchildrenOther race 37 100.0% Not responsible for grandchildrenTwo or more races 15 100.0% Not responsible for grandchildrenWhite alone, not Hispanic / Latino 124 37.4% Responsible for grandchildren207 62.6% Not responsible for grandchildrenHispanic or Latino 42 100.0% Not responsible for grandchildrenGrandparents (60 years and over) White / Caucasian 215 20.0% Responsible for grandchildren860 80.0% Not responsible for grandchildrenAmerican Indian / Alaska Native 6 100.0% Responsible for grandchildrenTwo or more races 38 54.0% Responsible for grandchildren33 46.0% Not responsible for grandchildrenWhite alone, not Hispanic / Latino 211 20.2% Responsible for grandchildren837 79.8% Not responsible for grandchildrenHispanic or Latino 25 68.3% Responsible for grandchildren11 31.7% Not responsible for grandchildren