Races in St. Armand, New York (NY) Detailed Stats
Ancestries, Foreign-born residents, place of birth
2.0% of St. Armand, NY residents are foreign-born (0.9% born in Europe, 0.8% born in North America, 0.2% born in Oceania), which is 976.4% less than the foreign-born rate of 22.0% across the entire state of New York.
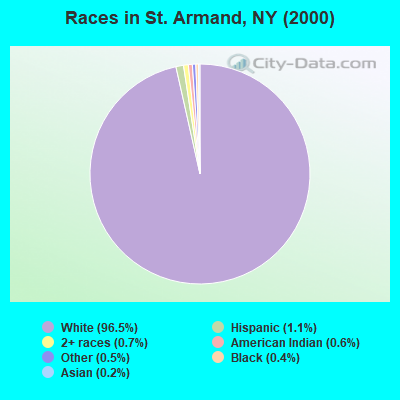
Race distribution in St. Armand

- 1,27596.5%White alone
- 151.1%Hispanic
- 90.7%Two or more races
- 80.6%American Indian alone
- 60.5%Other race alone
- 50.4%Black alone
- 30.2%Asian alone
2000
2022
-
- 11,760,98162.0%White alone
- 2,867,58315.1%Hispanic
- 2,812,62314.8%Black alone
- 1,035,9265.5%Asian alone
- 366,1161.9%Two or more races
- 75,4990.4%Other race alone
- 52,4990.3%American Indian alone
- 5,2300.03%Native Hawaiian and Other
Pacific Islander alone

-
- 10,408,93352.9%White alone
- 3,867,29919.7%Hispanic
- 2,633,84013.4%Black alone
- 1,776,2869.0%Asian alone
- 732,6703.7%Two or more races
- 216,1101.1%Other race alone
- 35,0820.2%American Indian alone
- 6,9310.04%Native Hawaiian and Other
Pacific Islander alone

Income and house value in St. Armand
- Median household income in 2022
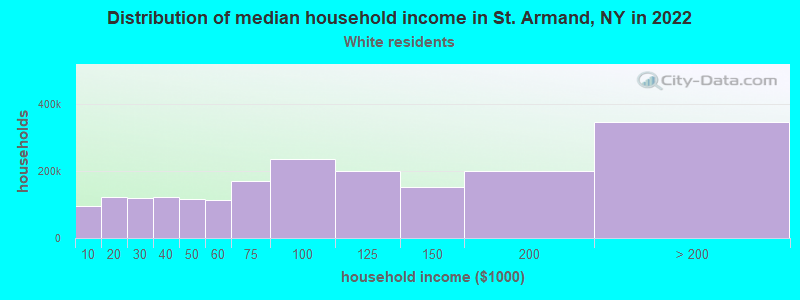
- $72,197White non-Hispanic householders
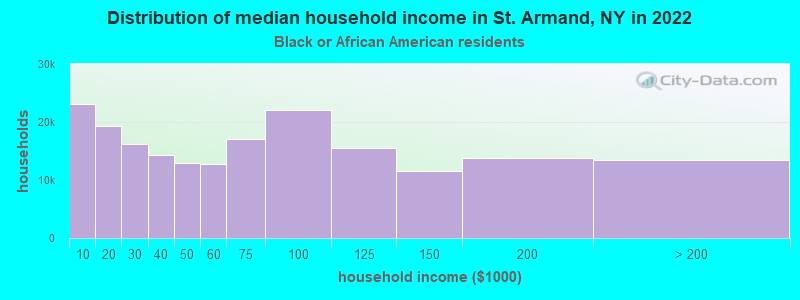
- $23,909Black householders
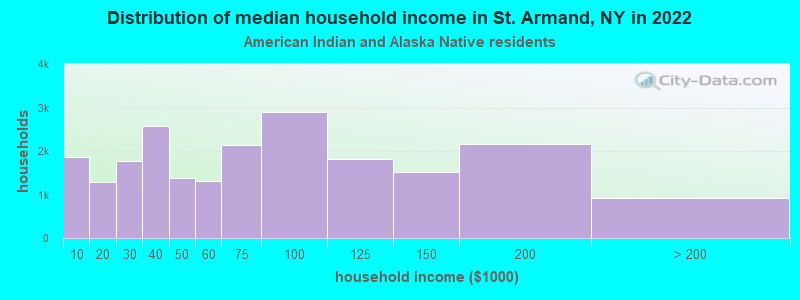
- $53,190American Indian and Alaska Native householders
- $23,684Two or more races householders
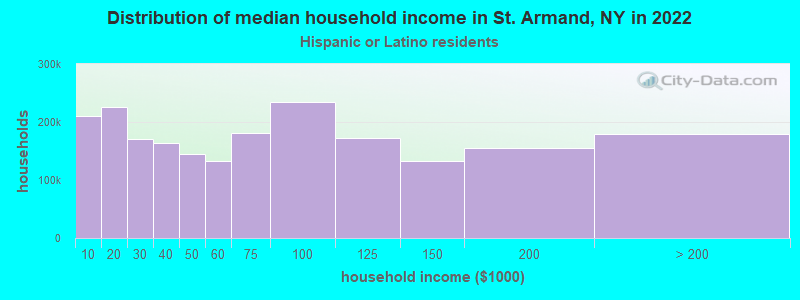
- $197,194Hispanic or Latino race householders
- Median 2022 house value
- $216,575White Non-Hispanic householders
- $45,012American Indian or Alaska Native householders
- $201,400Two or more races householders
- $218,633Hispanic or Latino householders
Household income for White non-Hispanic householders
Household income for Black householders
Household income for American Indian and Alaska Native householders
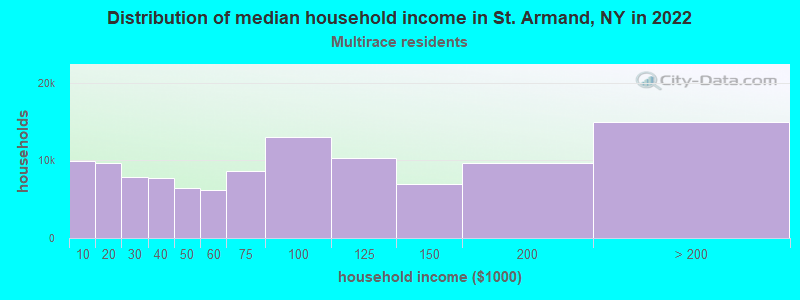
Household income for Two or more races householders
Household income for Hispanic or Latino race householders
Foreign-born residents in St. Armand
27 residents are foreign born (0.9% Europe, 0.8% North America, 0.2% Oceania).
| This city: | 2.0% |
| New York: | 20.4% |
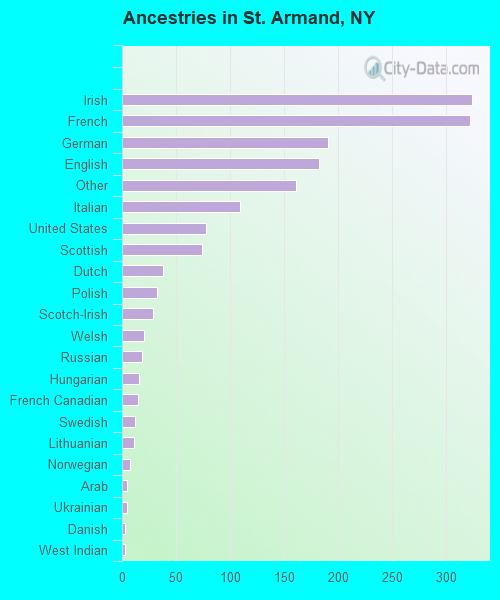
Ancestries in St. Armand

- 32419.5%Irish
- 32319.4%French
- 19111.5%German
- 18311.0%English
- 1619.7%Other
- 1096.6%Italian
- 784.7%United States
- 744.4%Scottish
- 382.3%Dutch
- 321.9%Polish
- 291.7%Scotch-Irish
- 201.2%Welsh
- 191.1%Russian
- 161.0%Hungarian
- 150.9%French Canadian
- 120.7%Swedish
- 110.7%Lithuanian
- 70.4%Norwegian
- 50.3%Arab
- 50.3%Ukrainian
- 30.2%Danish
- 30.2%West Indian
- 20.1%Czech
- 20.1%Portuguese
- 20.1%Swiss
Zip codes: 12913.