Races in St. Marys, Georgia (GA) Detailed Stats
Data:
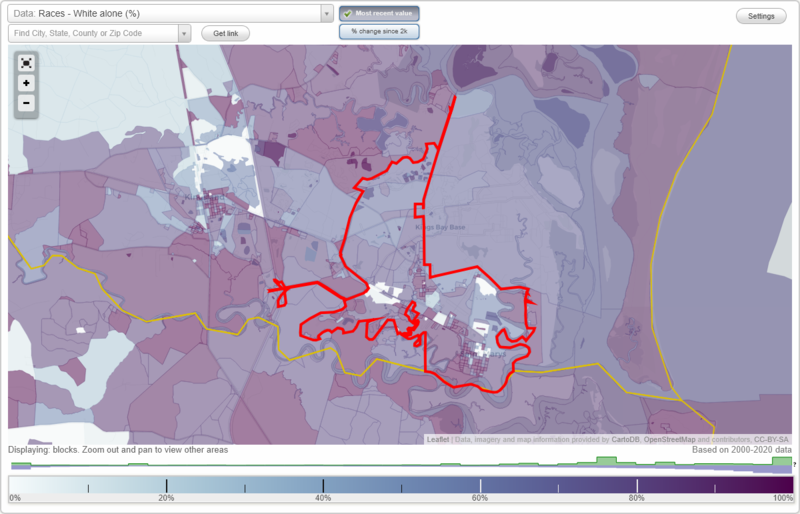
Races - White alone (%)
Races - White alone (% change since 2000)
Races - Black alone (%)
Races - Black alone (% change since 2000)
Races - American Indian alone (%)
Races - American Indian alone (% change since 2000)
Races - Asian alone (%)
Races - Asian alone (% change since 2000)
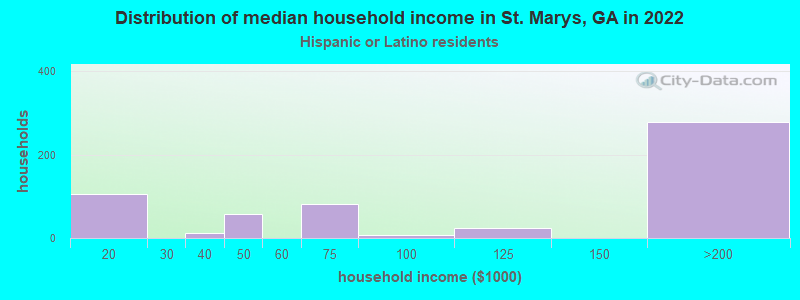
Races - Hispanic (%)
Races - Hispanic (% change since 2000)
Races - Native Hawaiian and Other Pacific Islander alone (%)
Races - Native Hawaiian and Other Pacific Islander alone (% change since 2000)
Races - Two or more races(%)
Races - Two or more races(% change since 2000)
Races - Other race alone (%)
Races - Other race alone (% change since 2000)
Racial diversity
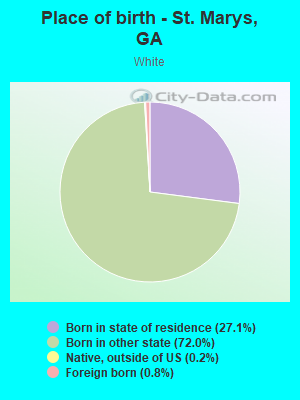
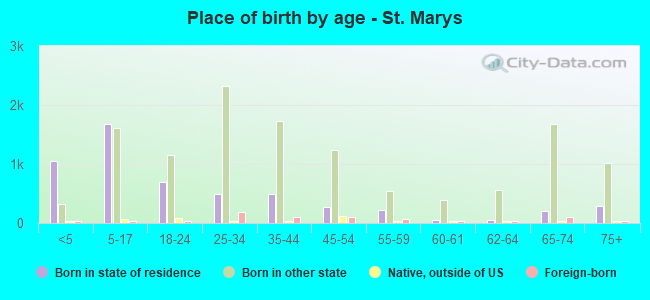
Place of birth - Born in state of residence (%)
Place of birth - Born in state of residence (%) - White
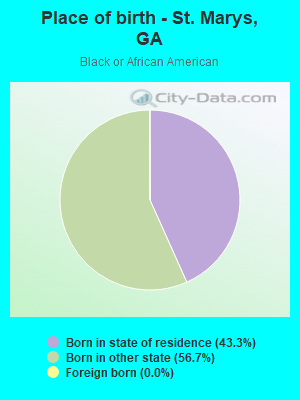
Place of birth - Born in state of residence (%) - Black or African American
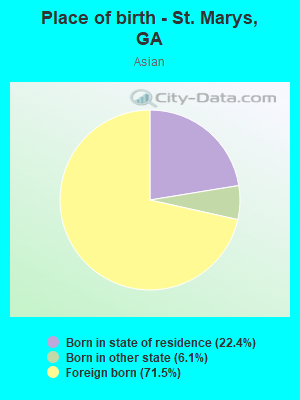
Place of birth - Born in state of residence (%) - Asian
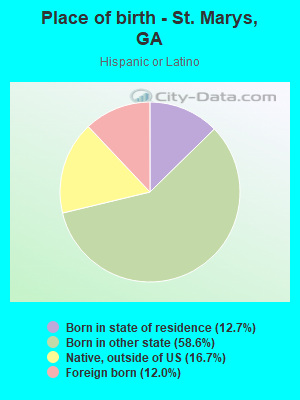
Place of birth - Born in state of residence (%) - Hispanic or Latino
Place of birth - Born in state of residence (%) - American Indian and Alaska Native
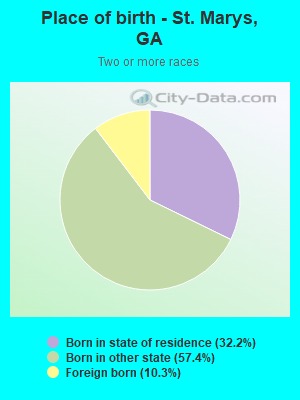
Place of birth - Born in state of residence (%) - Multirace
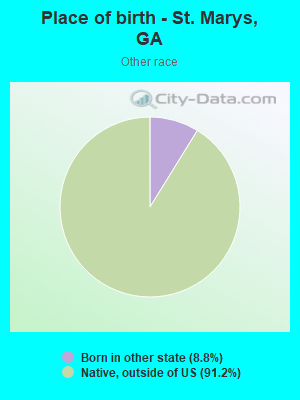
Place of birth - Born in state of residence (%) - Other Race
Place of birth - Born in other state (%)
Place of birth - Born in other state (%) - White
Place of birth - Born in other state (%) - Black or African American
Place of birth - Born in other state (%) - Asian
Place of birth - Born in other state (%) - Hispanic or Latino
Place of birth - Born in other state (%) - American Indian and Alaska Native
Place of birth - Born in other state (%) - Multirace
Place of birth - Born in other state (%) - Other Race
Place of birth - Native, outside of US (%)
Place of birth - Native, outside of US (%) - White
Place of birth - Native, outside of US (%) - Black or African American
Place of birth - Native, outside of US (%) - Asian
Place of birth - Native, outside of US (%) - Hispanic or Latino
Place of birth - Native, outside of US (%) - American Indian and Alaska Native
Place of birth - Native, outside of US (%) - Multirace
Place of birth - Native, outside of US (%) - Other Race
Place of birth - Foreign born (%)
Place of birth - Foreign born (%) - White
Place of birth - Foreign born (%) - Black or African American
Place of birth - Foreign born (%) - Asian
Place of birth - Foreign born (%) - Hispanic or Latino
Place of birth - Foreign born (%) - American Indian and Alaska Native
Place of birth - Foreign born (%) - Multirace
Place of birth - Foreign born (%) - Other Race
Residents speaking English at home (%)
Residents speaking English at home - Born in the United States (%)
Residents speaking English at home - Native, born elsewhere (%)
Residents speaking English at home - Foreign born (%)
Residents speaking Spanish at home (%)
Residents speaking Spanish at home - Born in the United States (%)
Residents speaking Spanish at home - Native, born elsewhere (%)
Residents speaking Spanish at home - Foreign born (%)
Residents speaking other language at home (%)
Residents speaking other language at home - Born in the United States (%)
Residents speaking other language at home - Native, born elsewhere (%)
Residents speaking other language at home - Foreign born (%)
Marital status - Never married (%)
Marital status - Now married (%)
Marital status - Separated (%)
Marital status - Widowed (%)
Marital status - Divorced (%)
Ancestries Reported - Arab (%)
Ancestries Reported - Czech (%)
Ancestries Reported - Danish (%)
Ancestries Reported - Dutch (%)
Ancestries Reported - English (%)
Ancestries Reported - French (%)
Ancestries Reported - French Canadian (%)
Ancestries Reported - German (%)
Ancestries Reported - Greek (%)
Ancestries Reported - Hungarian (%)
Ancestries Reported - Irish (%)
Ancestries Reported - Italian (%)
Ancestries Reported - Lithuanian (%)
Ancestries Reported - Norwegian (%)
Ancestries Reported - Polish (%)
Ancestries Reported - Portuguese (%)
Ancestries Reported - Russian (%)
Ancestries Reported - Scotch-Irish (%)
Ancestries Reported - Scottish (%)
Ancestries Reported - Slovak (%)
Ancestries Reported - Subsaharan African (%)
Ancestries Reported - Swedish (%)
Ancestries Reported - Swiss (%)
Ancestries Reported - Ukrainian (%)
Ancestries Reported - United States (%)
Ancestries Reported - Welsh (%)
Ancestries Reported - West Indian (%)
Ancestries Reported - Other (%)
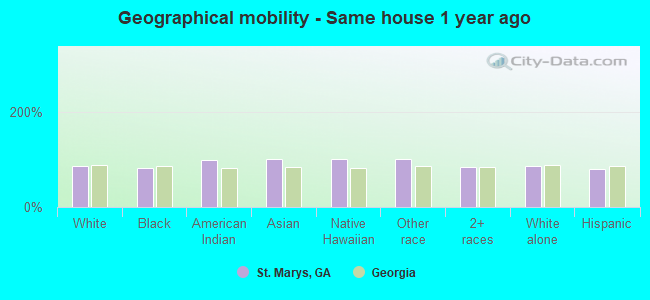
Geographical mobility - Same house 1 year ago (%)
Geographical mobility - Same house 1 year ago (%) - White
Geographical mobility - Same house 1 year ago (%) - Black or African American
Geographical mobility - Same house 1 year ago (%) - Asian
Geographical mobility - Same house 1 year ago (%) - Hispanic or Latino
Geographical mobility - Same house 1 year ago (%) - American Indian and Alaska Native
Geographical mobility - Same house 1 year ago (%) - Multirace
Geographical mobility - Same house 1 year ago (%) - Other Race
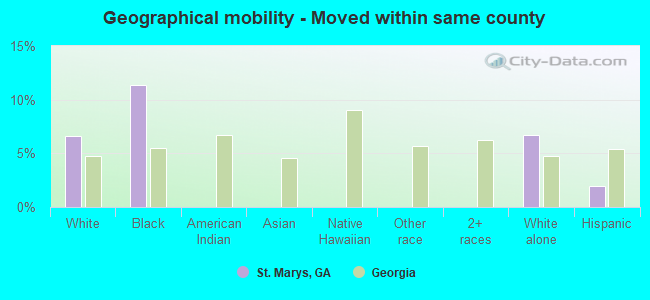
Geographical mobility - Moved within same county (%)
Geographical mobility - Moved within same county (%) - White
Geographical mobility - Moved within same county (%) - Black or African American
Geographical mobility - Moved within same county (%) - Asian
Geographical mobility - Moved within same county (%) - Hispanic or Latino
Geographical mobility - Moved within same county (%) - American Indian and Alaska Native
Geographical mobility - Moved within same county (%) - Multirace
Geographical mobility - Moved within same county (%) - Other Race
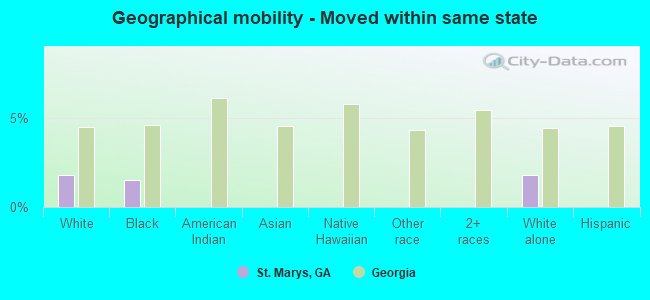
Geographical mobility - Moved from different county within same state (%)
Geographical mobility - Moved from different county within same state (%) - White
Geographical mobility - Moved from different county within same state (%) - Black or African American
Geographical mobility - Moved from different county within same state (%) - Asian
Geographical mobility - Moved from different county within same state (%) - Hispanic or Latino
Geographical mobility - Moved from different county within same state (%) - American Indian and Alaska Native
Geographical mobility - Moved from different county within same state (%) - Multirace
Geographical mobility - Moved from different county within same state (%) - Other Race
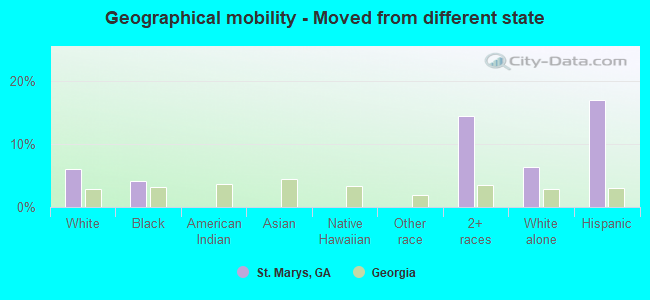
Geographical mobility - Moved from different state (%)
Geographical mobility - Moved from different state (%) - White
Geographical mobility - Moved from different state (%) - Black or African American
Geographical mobility - Moved from different state (%) - Asian
Geographical mobility - Moved from different state (%) - Hispanic or Latino
Geographical mobility - Moved from different state (%) - American Indian and Alaska Native
Geographical mobility - Moved from different state (%) - Multirace
Geographical mobility - Moved from different state (%) - Other Race
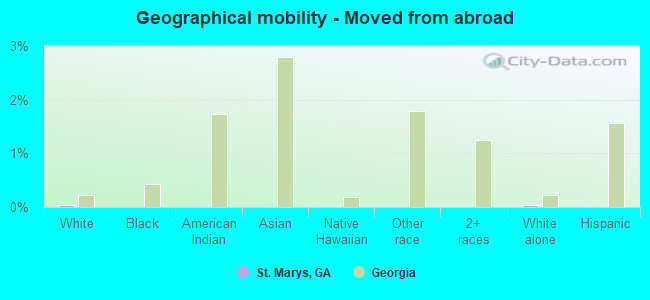
Geographical mobility - Moved from abroad (%)
Geographical mobility - Moved from abroad (%) - White
Geographical mobility - Moved from abroad (%) - Black or African American
Geographical mobility - Moved from abroad (%) - Asian
Geographical mobility - Moved from abroad (%) - Hispanic or Latino
Geographical mobility - Moved from abroad (%) - American Indian and Alaska Native
Geographical mobility - Moved from abroad (%) - Multirace
Geographical mobility - Moved from abroad (%) - Other Race
Place of birth for the foreign-born population - Ireland (%)
Place of birth for the foreign-born population - Denmark (%)
Place of birth for the foreign-born population - Norway (%)
Place of birth for the foreign-born population - Sweden (%)
Place of birth for the foreign-born population - United Kingdom (%)
Place of birth for the foreign-born population - England (%)
Place of birth for the foreign-born population - Scotland (%)
Place of birth for the foreign-born population - Other Northern Europe (%)
Place of birth for the foreign-born population - Austria (%)
Place of birth for the foreign-born population - Belgium (%)
Place of birth for the foreign-born population - France (%)
Place of birth for the foreign-born population - Germany (%)
Place of birth for the foreign-born population - Netherlands (%)
Place of birth for the foreign-born population - Switzerland (%)
Place of birth for the foreign-born population - Other Western Europe (%)
Place of birth for the foreign-born population - Greece (%)
Place of birth for the foreign-born population - Italy (%)
Place of birth for the foreign-born population - Portugal (%)
Place of birth for the foreign-born population - Spain (%)
Place of birth for the foreign-born population - Other Southern Europe (%)
Place of birth for the foreign-born population - Albania (%)
Place of birth for the foreign-born population - Belarus (%)
Place of birth for the foreign-born population - Bosnia and Herzegovina (%)
Place of birth for the foreign-born population - Bulgaria (%)
Place of birth for the foreign-born population - Croatia (%)
Place of birth for the foreign-born population - Czechoslovakia (%)
Place of birth for the foreign-born population - Hungary (%)
Place of birth for the foreign-born population - Latvia (%)
Place of birth for the foreign-born population - Lithuania (%)
Place of birth for the foreign-born population - North Macedonia (Macedonia) (%)
Place of birth for the foreign-born population - Moldova (%)
Place of birth for the foreign-born population - Poland (%)
Place of birth for the foreign-born population - Romania (%)
Place of birth for the foreign-born population - Russia (%)
Place of birth for the foreign-born population - Serbia (%)
Place of birth for the foreign-born population - Ukraine (%)
Place of birth for the foreign-born population - Other Eastern Europe (%)
Place of birth for the foreign-born population - China (%)
Place of birth for the foreign-born population - Hong Kong (%)
Place of birth for the foreign-born population - Taiwan (%)
Place of birth for the foreign-born population - Japan (%)
Place of birth for the foreign-born population - Korea (%)
Place of birth for the foreign-born population - Other Eastern Asia (%)
Place of birth for the foreign-born population - Afghanistan (%)
Place of birth for the foreign-born population - Bangladesh (%)
Place of birth for the foreign-born population - India (%)
Place of birth for the foreign-born population - Iran (%)
Place of birth for the foreign-born population - Kazakhstan (%)
Place of birth for the foreign-born population - Nepal (%)
Place of birth for the foreign-born population - Pakistan (%)
Place of birth for the foreign-born population - Sri Lanka (%)
Place of birth for the foreign-born population - Uzbekistan (%)
Place of birth for the foreign-born population - Other South Central Asia (%)
Place of birth for the foreign-born population - Burma (%)
Place of birth for the foreign-born population - Cambodia (%)
Place of birth for the foreign-born population - Indonesia (%)
Place of birth for the foreign-born population - Laos (%)
Place of birth for the foreign-born population - Malaysia (%)
Place of birth for the foreign-born population - Philippines (%)
Place of birth for the foreign-born population - Singapore (%)
Place of birth for the foreign-born population - Thailand (%)
Place of birth for the foreign-born population - Vietnam (%)
Place of birth for the foreign-born population - Other South Eastern Asia (%)
Place of birth for the foreign-born population - Armenia (%)
Place of birth for the foreign-born population - Iraq (%)
Place of birth for the foreign-born population - Israel (%)
Place of birth for the foreign-born population - Jordan (%)
Place of birth for the foreign-born population - Kuwait (%)
Place of birth for the foreign-born population - Lebanon (%)
Place of birth for the foreign-born population - Saudi Arabia (%)
Place of birth for the foreign-born population - Syria (%)
Place of birth for the foreign-born population - Turkey (%)
Place of birth for the foreign-born population - Yemen (%)
Place of birth for the foreign-born population - Other Western Asia (%)
Place of birth for the foreign-born population - Eritrea (%)
Place of birth for the foreign-born population - Ethiopia (%)
Place of birth for the foreign-born population - Kenya (%)
Place of birth for the foreign-born population - Somalia (%)
Place of birth for the foreign-born population - Uganda (%)
Place of birth for the foreign-born population - Zimbabwe (%)
Place of birth for the foreign-born population - Other Eastern Africa (%)
Place of birth for the foreign-born population - Cameroon (%)
Place of birth for the foreign-born population - Congo (%)
Place of birth for the foreign-born population - Democratic Republic of Congo (Zaire) (%)
Place of birth for the foreign-born population - Other Middle Africa (%)
Place of birth for the foreign-born population - Egypt (%)
Place of birth for the foreign-born population - Morocco (%)
Place of birth for the foreign-born population - Sudan (%)
Place of birth for the foreign-born population - Other Northern Africa (%)
Place of birth for the foreign-born population - South Africa (%)
Place of birth for the foreign-born population - Other Southern Africa (%)
Place of birth for the foreign-born population - Cabo Verde (%)
Place of birth for the foreign-born population - Ghana (%)
Place of birth for the foreign-born population - Liberia (%)
Place of birth for the foreign-born population - Nigeria (%)
Place of birth for the foreign-born population - Senegal (%)
Place of birth for the foreign-born population - Sierra Leone (%)
Place of birth for the foreign-born population - Other Western Africa (%)
Place of birth for the foreign-born population - Australia (%)
Place of birth for the foreign-born population - New Zealand (%)
Place of birth for the foreign-born population - Fiji (%)
Place of birth for the foreign-born population - Micronesia (%)
Place of birth for the foreign-born population - Bahamas (%)
Place of birth for the foreign-born population - Barbados (%)
Place of birth for the foreign-born population - Cuba (%)
Place of birth for the foreign-born population - Dominica (%)
Place of birth for the foreign-born population - Dominican Republic (%)
Place of birth for the foreign-born population - Grenada (%)
Place of birth for the foreign-born population - Haiti (%)
Place of birth for the foreign-born population - Jamaica (%)
Place of birth for the foreign-born population - St. Vincent and the Grenadines (%)
Place of birth for the foreign-born population - Trinidad and Tobago (%)
Place of birth for the foreign-born population - West Indies (%)
Place of birth for the foreign-born population - Other Caribbean (%)
Place of birth for the foreign-born population - Belize (%)
Place of birth for the foreign-born population - Costa Rica (%)
Place of birth for the foreign-born population - El Salvador (%)
Place of birth for the foreign-born population - Guatemala (%)
Place of birth for the foreign-born population - Honduras (%)
Place of birth for the foreign-born population - Mexico (%)
Place of birth for the foreign-born population - Nicaragua (%)
Place of birth for the foreign-born population - Panama (%)
Place of birth for the foreign-born population - Other Central America (%)
Place of birth for the foreign-born population - Argentina (%)
Place of birth for the foreign-born population - Bolivia (%)
Place of birth for the foreign-born population - Brazil (%)
Place of birth for the foreign-born population - Chile (%)
Place of birth for the foreign-born population - Colombia (%)
Place of birth for the foreign-born population - Ecuador (%)
Place of birth for the foreign-born population - Guyana (%)
Place of birth for the foreign-born population - Peru (%)
Place of birth for the foreign-born population - Uruguay (%)
Place of birth for the foreign-born population - Venezuela (%)
Place of birth for the foreign-born population - Other South America (%)
Place of birth for the foreign-born population - Canada (%)
Place of birth for the foreign-born population - Other Northern America (%)
Place of birth for the foreign-born population - Other (%)
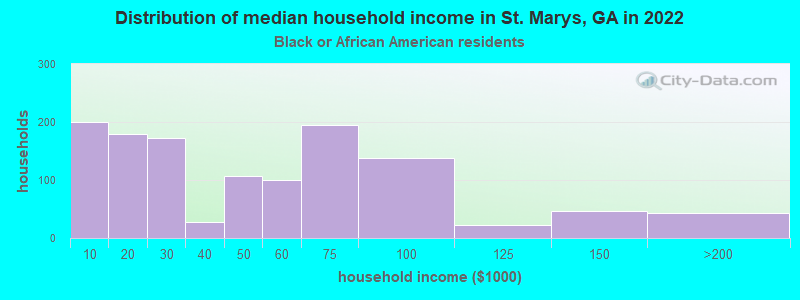
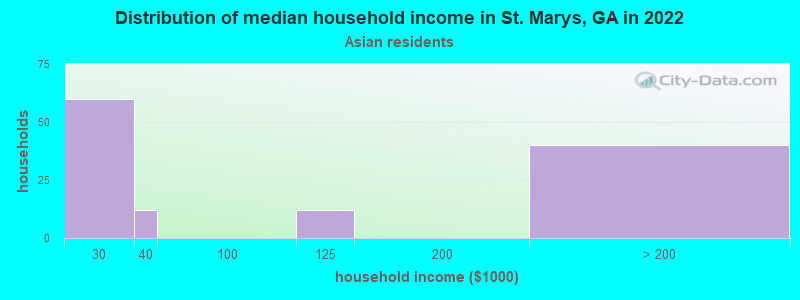
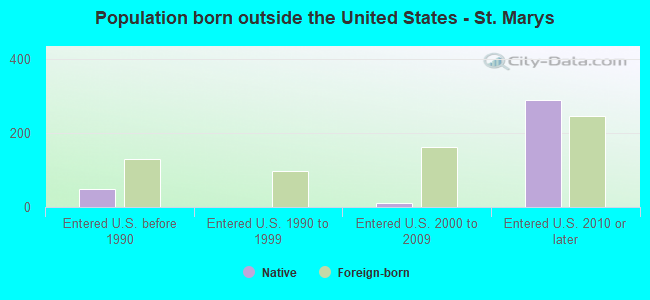
According to 2022 data, the most numerous races in St. Marys, GA are White alone (13,161 residents), Black alone (2,508 residents), and Hispanic (1,524 residents). 94.6% of St. Marys residents speak English at home. 3.3% of St. Marys, GA residents are foreign-born (1.4% born in Latin America, 1.2% born in Asia, 0.5% born in Europe), which is 199.0% less than the foreign-born rate of 10.0% across the entire state of Georgia.
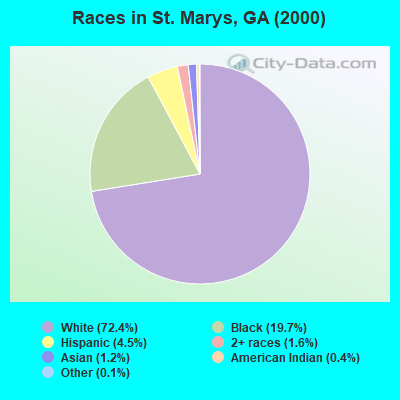
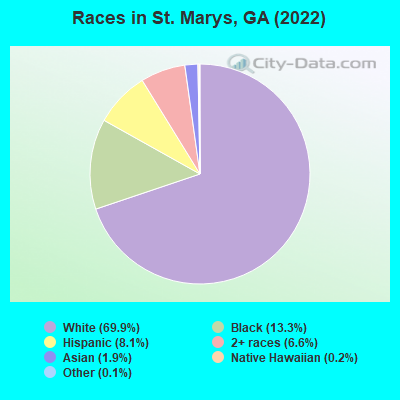
Race distribution in St. Marys
2000 2022
5,128,661 62.6% White alone 2,331,465 28.5% Black alone 435,227 5.3% Hispanic 171,513 2.1% Asian alone 87,364 1.1% Two or more races 17,670 0.2% American Indian alone 11,275 0.1% Other race alone 3,278 0.04% Native Hawaiian and Other
5,415,657 49.6% White alone 3,349,240 30.7% Black alone 1,132,604 10.4% Hispanic 479,156 4.4% Asian alone 462,923 4.2% Two or more races 54,416 0.5% Other race alone 11,923 0.1% American Indian alone 6,957 0.06% Native Hawaiian and Other
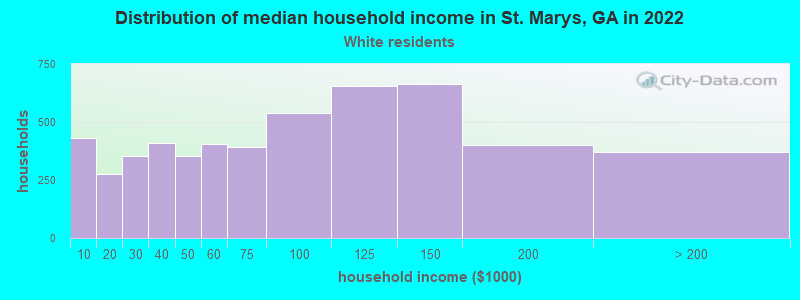
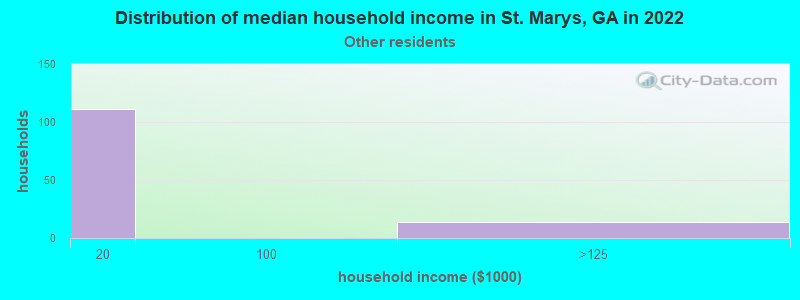
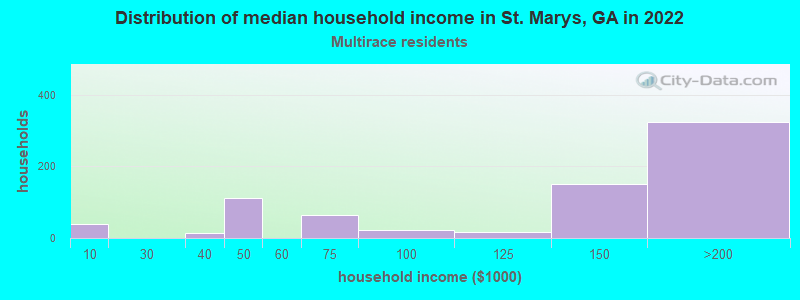
Income and house value in St. Marys Median household income in 2022 $75,617 White non-Hispanic householders$42,927 Black householders$142,826 Two or more races householdersMedian 2022 house value $303,869 White Non-Hispanic householders$240,333 Black or African American householders$350,140 American Indian or Alaska Native householders $262,432 Asian householders$338,745 Some other race householders$267,612 Two or more races householders$302,833 Hispanic or Latino householders
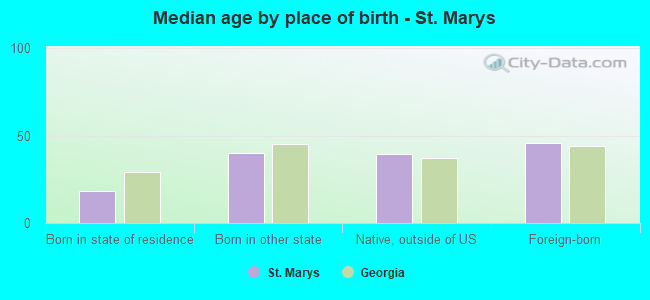
Median age by race in St. Marys
37.2 Median age for White residents36.3 40.8 27.6 Median age for Black or African American residents24.8 29.2 -597,462,513.8 Median age for American Indian / Alaska Native residents-597,222,221.6 -597,938,143.7 41.6 Median age for Asian residents28.1 52.3 -657,243,815.6 Median age for Native Hawaiian / Pacific Islander residents-693,227,090.9 -776,776,776.0 19.9 Median age for Other race residents-668,918,918.2 47.3 32.2 Median age for Two or more races residents16.9 32.5 37.0 Median age for White alone residents35.8 40.4 30.1 Median age for Hispanic or Latino residents22.0 31.2
Owner/renter occupied households by race in St. Marys
House owners and renters - White residents 3,352 64.1% Owner occupied1,874 35.9% Renter occupiedHouse owners and renters - Black or African American residents 501 40.6% Owner occupied733 59.4% Renter occupiedHouse owners and renters - Asian residents 75 60.4% Owner occupied49 39.6% Renter occupiedHouse owners and renters - Native Hawaiian / Pacific Islander residents 44 100.0% Owner occupiedHouse owners and renters - Other race residents 13 10.7% Owner occupied106 89.3% Renter occupiedHouse owners and renters - Two or more races residents 608 76.7% Owner occupied184 23.3% Renter occupiedHouse owners and renters - White alone residents 3,312 63.4% Owner occupied1,913 36.6% Renter occupiedHouse owners and renters - Hispanic or Latino residents 407 75.9% Owner occupied129 24.1% Renter occupied
Language usage in St. Marys
English speakers - Total 94.6% of residents of St. Marys speak English at home.
2.6% of residents speak Spanish at home 201 43.7% Speak English very well259 56.3% Speak English less than very well2.5% of residents speak other language at home 280 64.7% Speak English very well153 35.3% Speak English less than very well
English speakers - Born in the United States 99.5% of residents of St. Marys speak English at home.
0.3% of residents speak Spanish at home 36 100.0% Speak English very well0.2% of residents speak other language at home 9 40.9% Speak English very well13 59.1% Speak English less than very well
English speakers - Native, born elsewhere 16.8% of residents of St. Marys speak English at home.
84.9% of residents speak Spanish at home 155 61.3% Speak English very well98 38.7% Speak English less than very well
English speakers - Foreign-born 23.8% of residents of St. Marys speak English at home.
28.3% of residents speak Spanish at home 178 100.0% Speak English less than very well47.8% of residents speak other language at home 164 54.5% Speak English very well137 45.5% Speak English less than very well
White (Caucasian) - Speak only English Native:
100.0% (12,377)Foreign-born:
80.4% (82)
White (Caucasian) - Speak another language Native:
0.8% (95)Foreign-born:
35.7% (37)
Black or African American - Speak only English Native:
99.8% (2,245)Foreign-born:
97.7% (1)
Asian - Speak only English Native:
57.8% (62)Foreign-born:
13.8% (36)
Asian - Speak another language Native:
41.1% (44)Foreign-born:
85.9% (226)
Two or more races - Speak only English Native:
100.0% (1,824)Foreign-born:
2.3% (6)
White alone - Speak only English Native:
99.2% (12,140)Foreign-born:
60.2% (91)
White alone - Speak another language Native:
0.9% (105)Foreign-born:
40.0% (60)
Hispanic or Latino - Speak only English Native:
80.6% (934)Foreign-born:
2.3% (4)
Hispanic or Latino - Speak another language Native:
22.3% (259)Foreign-born:
97.6% (181)
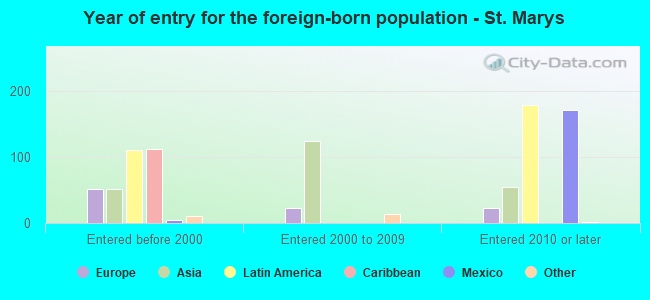
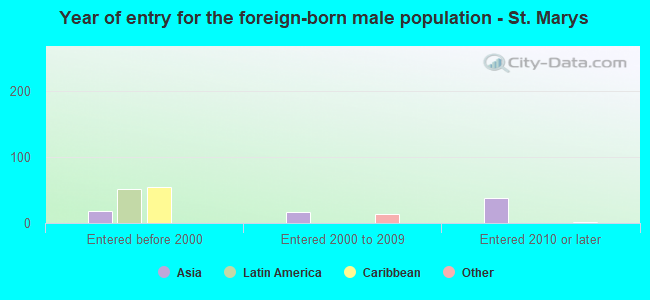
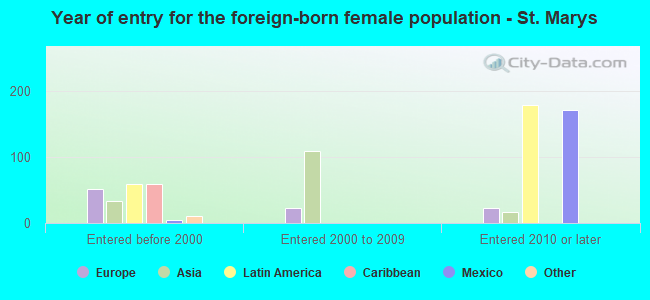
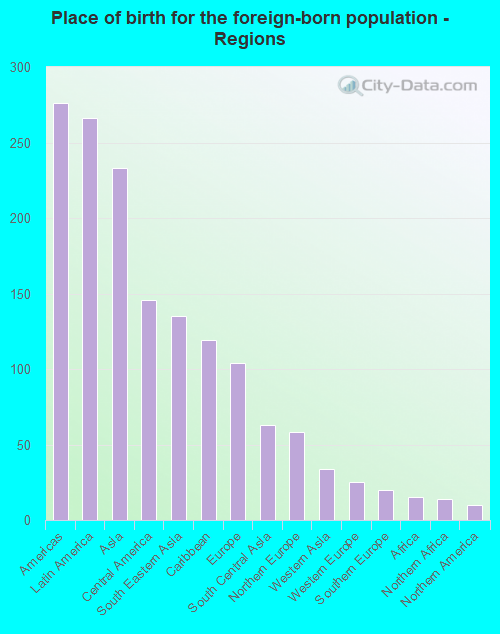
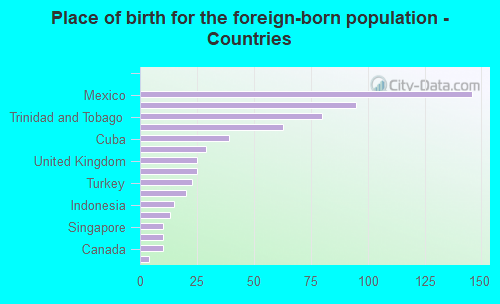
Foreign-born residents in St. Marys 630 residents are foreign born (1.4% Latin America , 1.2% Asia , 0.5% Europe ).
This city:
3.3%Georgia:
10.4%
Marital status for residents in St. Marys Marital status - White (Caucasian) population 15 years and over
Males 29.6% Never married51.5% Now married5.0% Separated1.4% Widowed12.4% DivorcedFemales 21.8% Never married54.0% Now married2.0% Separated8.6% Widowed13.6% DivorcedWomen who gave birth in the past 12 months Now married:
78.6% (104)Unmarried:
21.4% (28)
Women who did not give birth in the past 12 months Now married:
50.4% (1,287)Unmarried:
49.6% (1,266)
Marital status - Black or African American population 15 years and over
Males 48.2% Never married38.4% Now married10.5% Separated0.0% Widowed2.8% DivorcedFemales 50.2% Never married28.3% Now married0.0% Separated5.6% Widowed15.9% DivorcedWomen who gave birth in the past 12 months Now married:
100.0% (15)Unmarried:
0.0% (0)
Women who did not give birth in the past 12 months Now married:
11.9% (64)Unmarried:
88.1% (476)
Marital status - Asian population 15 years and over
Males 65.2% Never married34.8% Now married0.0% Separated0.0% Widowed0.0% DivorcedFemales 6.2% Never married25.7% Now married0.0% Separated13.7% Widowed54.4% DivorcedWomen who did not give birth in the past 12 months Now married:
41.3% (47)Unmarried:
58.7% (66)
Marital status - Other race population 15 years and over
Males 100.0% Never married0.0% Now married0.0% Separated0.0% Widowed0.0% DivorcedFemales 43.6% Never married12.2% Now married0.0% Separated0.0% Widowed44.1% DivorcedWomen who did not give birth in the past 12 months Now married:
0.0% (0)Unmarried:
100.0% (214)
Marital status - Two or more races population 15 years and over
Males 55.6% Never married30.5% Now married0.0% Separated0.0% Widowed13.9% DivorcedFemales 28.9% Never married31.0% Now married1.6% Separated31.9% Widowed6.6% DivorcedWomen who did not give birth in the past 12 months Now married:
40.2% (197)Unmarried:
59.8% (293)
Marital status - White alone, not Hispanic / Latino population 15 years and over
Males 28.6% Never married52.9% Now married5.2% Separated1.5% Widowed11.8% DivorcedFemales 22.2% Never married53.5% Now married2.0% Separated8.8% Widowed13.6% DivorcedWomen who gave birth in the past 12 months Now married:
78.6% (108)Unmarried:
21.4% (30)
Women who did not give birth in the past 12 months Now married:
49.1% (1,270)Unmarried:
50.9% (1,315)
Marital status - Hispanic or Latino population 15 years and over
Males 54.5% Never married30.7% Now married0.0% Separated0.0% Widowed14.9% DivorcedFemales 30.4% Never married26.3% Now married0.0% Separated28.9% Widowed14.4% DivorcedWomen who did not give birth in the past 12 months Now married:
29.7% (137)Unmarried:
70.3% (325)
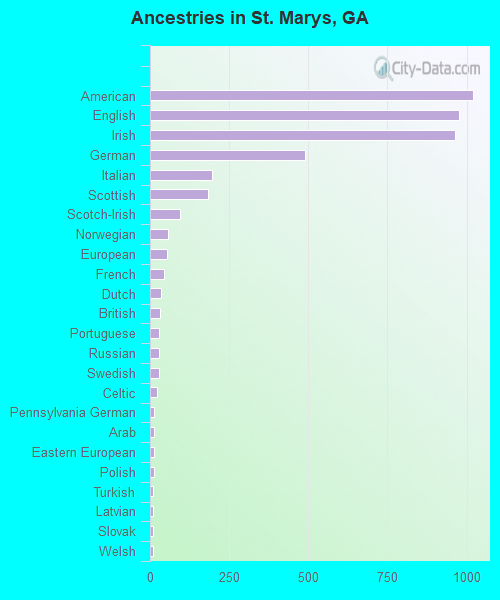
Ancestries in St. Marys
1,020 13.0% American975 12.4% English964 12.3% Irish490 6.3% German195 2.5% Italian183 2.3% Scottish96 1.2% Scotch-Irish56 0.7% Norwegian53 0.7% European45 0.6% French34 0.4% Dutch32 0.4% British27 0.3% Portuguese27 0.3% Russian27 0.3% Swedish23 0.3% Celtic14 0.2% Pennsylvania German12 0.2% Arab12 0.2% Eastern European12 0.2% Polish11 0.1% Turkish10 0.1% Latvian10 0.1% Slovak10 0.1% Welsh8 0.1% Northern European8 0.1% Swiss7 0.09% Czechoslovakian6 0.08% French Canadian5 0.06% Austrian2 0.03% Ukrainian1 0.01% Ethiopian
Geographical mobility in St. Marys Same house 1 year ago 11,082 85.7% White (Caucasian)2,035 81.4% Black or African American12 99.5% American Indian / Alaska Native368 99.9% Asian40 100.0% Native Hawaiian / Pacific Islander307 99.7% Other race2,145 84.3% Two or more races11,153 85.6% White alone, not Hispanic / Latino1,223 80.2% Hispanic or LatinoMoved within same county 852 6.6% White / Caucasian285 11.4% Black or African American871 6.7% White alone, not Hispanic / Latino29 1.9% Hispanic or LatinoMoved within same state 229 1.8% White / Caucasian38 1.5% Black or African American231 1.8% White alone, not Hispanic / LatinoMoved from different state 785 6.1% White / Caucasian105 4.2% Black or African American365 14.4% Two or more races817 6.3% White alone, not Hispanic / Latino260 17.0% Hispanic or LatinoMoved from abroad 4 0.0% White5 0.0% White alone, not Hispanic / Latino
Children Nativity (place of birth) in St. Marys
Children under 6 years - Living with two parents Both parents native 561 100.0% NativeOne native, one foreign-born parent 26 100.0% NativeChildren under 6 years - Living with one parent Native parent 948 100.0% NativeChildren 6 to 17 years - Living with two parents Both parents native 1,476 100.0% NativeBoth parents foreign-born 56 100.0% NativeOne native, one foreign-born parent 117 100.0% NativeChildren 6 to 17 years - Living with one parent Native parent 1,040 100.0% NativeForeign-born parent 18 50.3% Native18 49.7% Foreign-born
Grandparents responsible for own grandchildren in St. Marys
Grandparents (30 to 59 years) White / Caucasian 7 19.1% Responsible for grandchildren29 80.9% Not responsible for grandchildrenBlack or African American 51 69.2% Responsible for grandchildren23 30.8% Not responsible for grandchildrenAsian 27 100.0% Not responsible for grandchildrenWhite alone, not Hispanic / Latino 7 18.5% Responsible for grandchildren31 81.5% Not responsible for grandchildrenHispanic or Latino 11 100.0% Responsible for grandchildrenGrandparents (60 years and over) White / Caucasian 33 18.9% Responsible for grandchildren141 81.1% Not responsible for grandchildrenBlack or African American 85 100.0% Responsible for grandchildrenAsian 9 100.0% Not responsible for grandchildrenWhite alone, not Hispanic / Latino 33 19.8% Responsible for grandchildren134 80.2% Not responsible for grandchildrenHispanic or Latino 14 100.0% Not responsible for grandchildren