Races in State College, Pennsylvania (PA) Detailed Stats
Data:
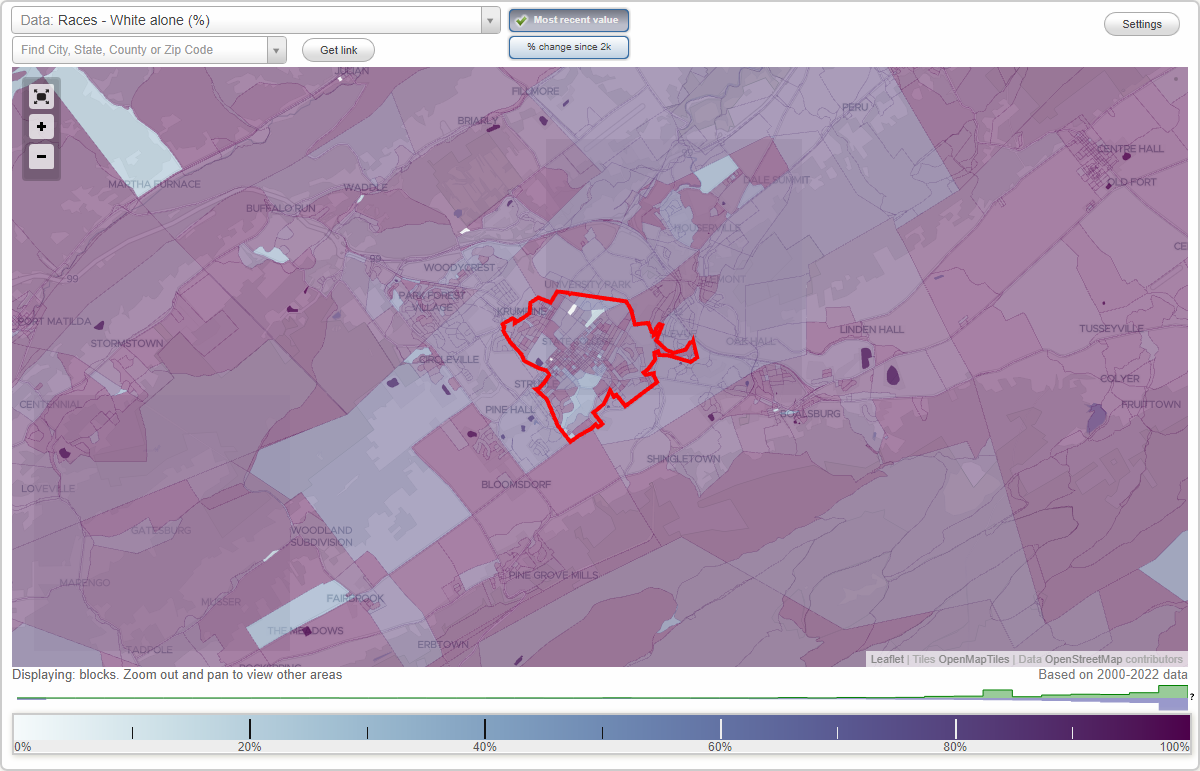
Races - White alone (%)
Races - White alone (% change since 2000)
Races - Black alone (%)
Races - Black alone (% change since 2000)
Races - American Indian alone (%)
Races - American Indian alone (% change since 2000)
Races - Asian alone (%)
Races - Asian alone (% change since 2000)
Races - Hispanic (%)
Races - Hispanic (% change since 2000)
Races - Native Hawaiian and Other Pacific Islander alone (%)
Races - Native Hawaiian and Other Pacific Islander alone (% change since 2000)
Races - Two or more races(%)
Races - Two or more races(% change since 2000)
Races - Other race alone (%)
Races - Other race alone (% change since 2000)
Racial diversity
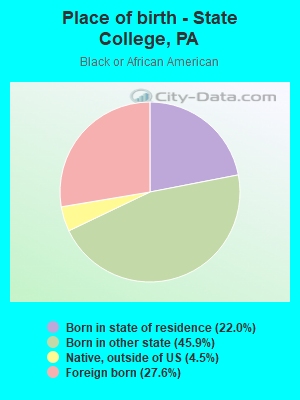
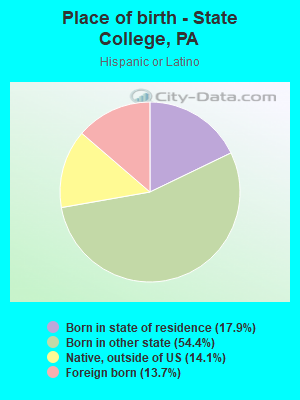
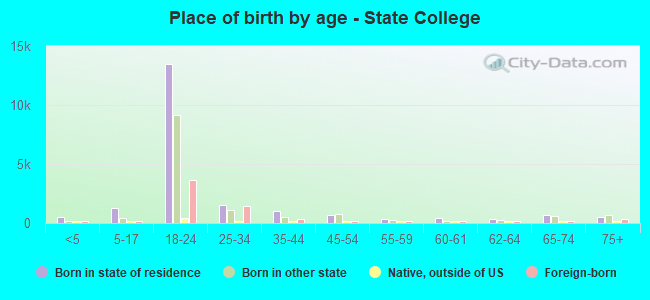
Place of birth - Born in state of residence (%)
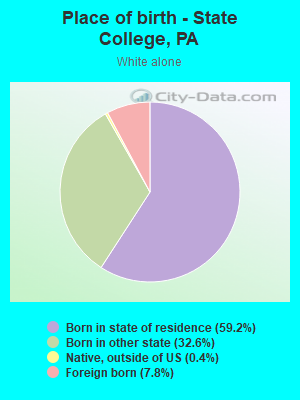
Place of birth - Born in state of residence (%) - White
Place of birth - Born in state of residence (%) - Black or African American
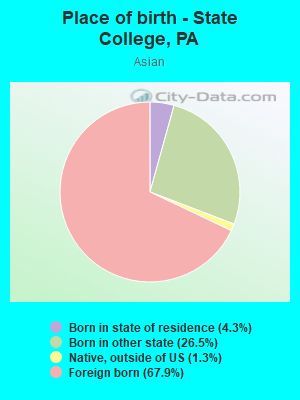
Place of birth - Born in state of residence (%) - Asian
Place of birth - Born in state of residence (%) - Hispanic or Latino
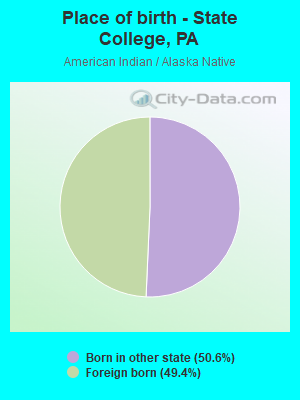
Place of birth - Born in state of residence (%) - American Indian and Alaska Native
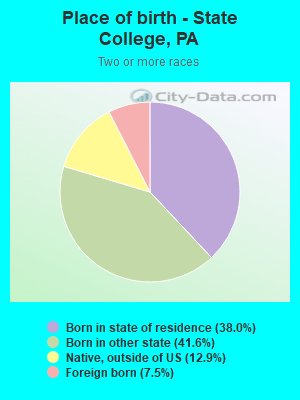
Place of birth - Born in state of residence (%) - Multirace
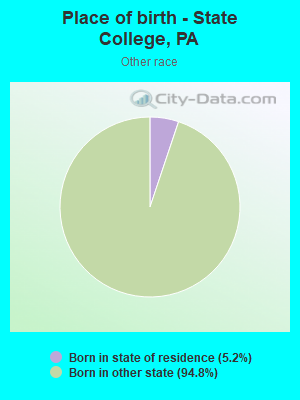
Place of birth - Born in state of residence (%) - Other Race
Place of birth - Born in other state (%)
Place of birth - Born in other state (%) - White
Place of birth - Born in other state (%) - Black or African American
Place of birth - Born in other state (%) - Asian
Place of birth - Born in other state (%) - Hispanic or Latino
Place of birth - Born in other state (%) - American Indian and Alaska Native
Place of birth - Born in other state (%) - Multirace
Place of birth - Born in other state (%) - Other Race
Place of birth - Native, outside of US (%)
Place of birth - Native, outside of US (%) - White
Place of birth - Native, outside of US (%) - Black or African American
Place of birth - Native, outside of US (%) - Asian
Place of birth - Native, outside of US (%) - Hispanic or Latino
Place of birth - Native, outside of US (%) - American Indian and Alaska Native
Place of birth - Native, outside of US (%) - Multirace
Place of birth - Native, outside of US (%) - Other Race
Place of birth - Foreign born (%)
Place of birth - Foreign born (%) - White
Place of birth - Foreign born (%) - Black or African American
Place of birth - Foreign born (%) - Asian
Place of birth - Foreign born (%) - Hispanic or Latino
Place of birth - Foreign born (%) - American Indian and Alaska Native
Place of birth - Foreign born (%) - Multirace
Place of birth - Foreign born (%) - Other Race
Residents speaking English at home (%)
Residents speaking English at home - Born in the United States (%)
Residents speaking English at home - Native, born elsewhere (%)
Residents speaking English at home - Foreign born (%)
Residents speaking Spanish at home (%)
Residents speaking Spanish at home - Born in the United States (%)
Residents speaking Spanish at home - Native, born elsewhere (%)
Residents speaking Spanish at home - Foreign born (%)
Residents speaking other language at home (%)
Residents speaking other language at home - Born in the United States (%)
Residents speaking other language at home - Native, born elsewhere (%)
Residents speaking other language at home - Foreign born (%)
Marital status - Never married (%)
Marital status - Now married (%)
Marital status - Separated (%)
Marital status - Widowed (%)
Marital status - Divorced (%)
Ancestries Reported - Arab (%)
Ancestries Reported - Czech (%)
Ancestries Reported - Danish (%)
Ancestries Reported - Dutch (%)
Ancestries Reported - English (%)
Ancestries Reported - French (%)
Ancestries Reported - French Canadian (%)
Ancestries Reported - German (%)
Ancestries Reported - Greek (%)
Ancestries Reported - Hungarian (%)
Ancestries Reported - Irish (%)
Ancestries Reported - Italian (%)
Ancestries Reported - Lithuanian (%)
Ancestries Reported - Norwegian (%)
Ancestries Reported - Polish (%)
Ancestries Reported - Portuguese (%)
Ancestries Reported - Russian (%)
Ancestries Reported - Scotch-Irish (%)
Ancestries Reported - Scottish (%)
Ancestries Reported - Slovak (%)
Ancestries Reported - Subsaharan African (%)
Ancestries Reported - Swedish (%)
Ancestries Reported - Swiss (%)
Ancestries Reported - Ukrainian (%)
Ancestries Reported - United States (%)
Ancestries Reported - Welsh (%)
Ancestries Reported - West Indian (%)
Ancestries Reported - Other (%)
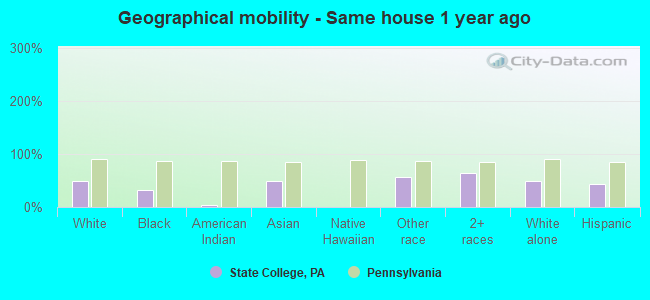
Geographical mobility - Same house 1 year ago (%)
Geographical mobility - Same house 1 year ago (%) - White
Geographical mobility - Same house 1 year ago (%) - Black or African American
Geographical mobility - Same house 1 year ago (%) - Asian
Geographical mobility - Same house 1 year ago (%) - Hispanic or Latino
Geographical mobility - Same house 1 year ago (%) - American Indian and Alaska Native
Geographical mobility - Same house 1 year ago (%) - Multirace
Geographical mobility - Same house 1 year ago (%) - Other Race
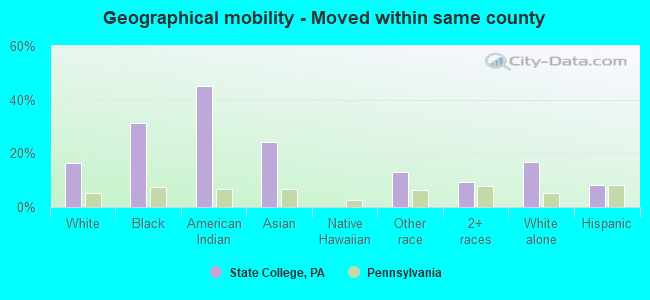
Geographical mobility - Moved within same county (%)
Geographical mobility - Moved within same county (%) - White
Geographical mobility - Moved within same county (%) - Black or African American
Geographical mobility - Moved within same county (%) - Asian
Geographical mobility - Moved within same county (%) - Hispanic or Latino
Geographical mobility - Moved within same county (%) - American Indian and Alaska Native
Geographical mobility - Moved within same county (%) - Multirace
Geographical mobility - Moved within same county (%) - Other Race
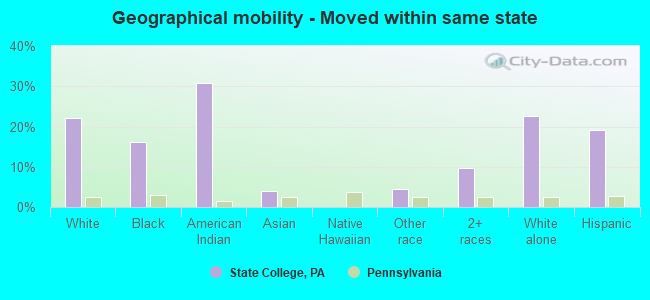
Geographical mobility - Moved from different county within same state (%)
Geographical mobility - Moved from different county within same state (%) - White
Geographical mobility - Moved from different county within same state (%) - Black or African American
Geographical mobility - Moved from different county within same state (%) - Asian
Geographical mobility - Moved from different county within same state (%) - Hispanic or Latino
Geographical mobility - Moved from different county within same state (%) - American Indian and Alaska Native
Geographical mobility - Moved from different county within same state (%) - Multirace
Geographical mobility - Moved from different county within same state (%) - Other Race
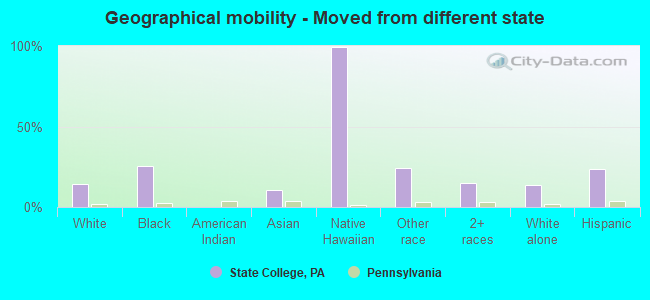
Geographical mobility - Moved from different state (%)
Geographical mobility - Moved from different state (%) - White
Geographical mobility - Moved from different state (%) - Black or African American
Geographical mobility - Moved from different state (%) - Asian
Geographical mobility - Moved from different state (%) - Hispanic or Latino
Geographical mobility - Moved from different state (%) - American Indian and Alaska Native
Geographical mobility - Moved from different state (%) - Multirace
Geographical mobility - Moved from different state (%) - Other Race
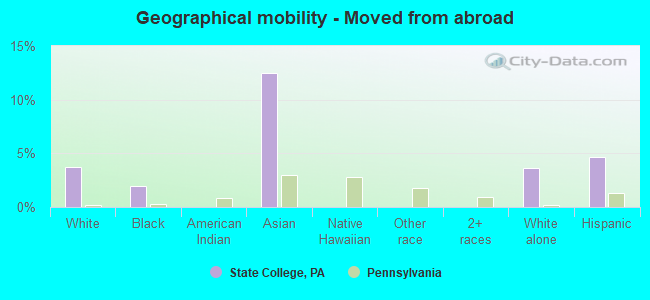
Geographical mobility - Moved from abroad (%)
Geographical mobility - Moved from abroad (%) - White
Geographical mobility - Moved from abroad (%) - Black or African American
Geographical mobility - Moved from abroad (%) - Asian
Geographical mobility - Moved from abroad (%) - Hispanic or Latino
Geographical mobility - Moved from abroad (%) - American Indian and Alaska Native
Geographical mobility - Moved from abroad (%) - Multirace
Geographical mobility - Moved from abroad (%) - Other Race
Place of birth for the foreign-born population - Ireland (%)
Place of birth for the foreign-born population - Denmark (%)
Place of birth for the foreign-born population - Norway (%)
Place of birth for the foreign-born population - Sweden (%)
Place of birth for the foreign-born population - United Kingdom (%)
Place of birth for the foreign-born population - England (%)
Place of birth for the foreign-born population - Scotland (%)
Place of birth for the foreign-born population - Other Northern Europe (%)
Place of birth for the foreign-born population - Austria (%)
Place of birth for the foreign-born population - Belgium (%)
Place of birth for the foreign-born population - France (%)
Place of birth for the foreign-born population - Germany (%)
Place of birth for the foreign-born population - Netherlands (%)
Place of birth for the foreign-born population - Switzerland (%)
Place of birth for the foreign-born population - Other Western Europe (%)
Place of birth for the foreign-born population - Greece (%)
Place of birth for the foreign-born population - Italy (%)
Place of birth for the foreign-born population - Portugal (%)
Place of birth for the foreign-born population - Spain (%)
Place of birth for the foreign-born population - Other Southern Europe (%)
Place of birth for the foreign-born population - Albania (%)
Place of birth for the foreign-born population - Belarus (%)
Place of birth for the foreign-born population - Bosnia and Herzegovina (%)
Place of birth for the foreign-born population - Bulgaria (%)
Place of birth for the foreign-born population - Croatia (%)
Place of birth for the foreign-born population - Czechoslovakia (%)
Place of birth for the foreign-born population - Hungary (%)
Place of birth for the foreign-born population - Latvia (%)
Place of birth for the foreign-born population - Lithuania (%)
Place of birth for the foreign-born population - North Macedonia (Macedonia) (%)
Place of birth for the foreign-born population - Moldova (%)
Place of birth for the foreign-born population - Poland (%)
Place of birth for the foreign-born population - Romania (%)
Place of birth for the foreign-born population - Russia (%)
Place of birth for the foreign-born population - Serbia (%)
Place of birth for the foreign-born population - Ukraine (%)
Place of birth for the foreign-born population - Other Eastern Europe (%)
Place of birth for the foreign-born population - China (%)
Place of birth for the foreign-born population - Hong Kong (%)
Place of birth for the foreign-born population - Taiwan (%)
Place of birth for the foreign-born population - Japan (%)
Place of birth for the foreign-born population - Korea (%)
Place of birth for the foreign-born population - Other Eastern Asia (%)
Place of birth for the foreign-born population - Afghanistan (%)
Place of birth for the foreign-born population - Bangladesh (%)
Place of birth for the foreign-born population - India (%)
Place of birth for the foreign-born population - Iran (%)
Place of birth for the foreign-born population - Kazakhstan (%)
Place of birth for the foreign-born population - Nepal (%)
Place of birth for the foreign-born population - Pakistan (%)
Place of birth for the foreign-born population - Sri Lanka (%)
Place of birth for the foreign-born population - Uzbekistan (%)
Place of birth for the foreign-born population - Other South Central Asia (%)
Place of birth for the foreign-born population - Burma (%)
Place of birth for the foreign-born population - Cambodia (%)
Place of birth for the foreign-born population - Indonesia (%)
Place of birth for the foreign-born population - Laos (%)
Place of birth for the foreign-born population - Malaysia (%)
Place of birth for the foreign-born population - Philippines (%)
Place of birth for the foreign-born population - Singapore (%)
Place of birth for the foreign-born population - Thailand (%)
Place of birth for the foreign-born population - Vietnam (%)
Place of birth for the foreign-born population - Other South Eastern Asia (%)
Place of birth for the foreign-born population - Armenia (%)
Place of birth for the foreign-born population - Iraq (%)
Place of birth for the foreign-born population - Israel (%)
Place of birth for the foreign-born population - Jordan (%)
Place of birth for the foreign-born population - Kuwait (%)
Place of birth for the foreign-born population - Lebanon (%)
Place of birth for the foreign-born population - Saudi Arabia (%)
Place of birth for the foreign-born population - Syria (%)
Place of birth for the foreign-born population - Turkey (%)
Place of birth for the foreign-born population - Yemen (%)
Place of birth for the foreign-born population - Other Western Asia (%)
Place of birth for the foreign-born population - Eritrea (%)
Place of birth for the foreign-born population - Ethiopia (%)
Place of birth for the foreign-born population - Kenya (%)
Place of birth for the foreign-born population - Somalia (%)
Place of birth for the foreign-born population - Uganda (%)
Place of birth for the foreign-born population - Zimbabwe (%)
Place of birth for the foreign-born population - Other Eastern Africa (%)
Place of birth for the foreign-born population - Cameroon (%)
Place of birth for the foreign-born population - Congo (%)
Place of birth for the foreign-born population - Democratic Republic of Congo (Zaire) (%)
Place of birth for the foreign-born population - Other Middle Africa (%)
Place of birth for the foreign-born population - Egypt (%)
Place of birth for the foreign-born population - Morocco (%)
Place of birth for the foreign-born population - Sudan (%)
Place of birth for the foreign-born population - Other Northern Africa (%)
Place of birth for the foreign-born population - South Africa (%)
Place of birth for the foreign-born population - Other Southern Africa (%)
Place of birth for the foreign-born population - Cabo Verde (%)
Place of birth for the foreign-born population - Ghana (%)
Place of birth for the foreign-born population - Liberia (%)
Place of birth for the foreign-born population - Nigeria (%)
Place of birth for the foreign-born population - Senegal (%)
Place of birth for the foreign-born population - Sierra Leone (%)
Place of birth for the foreign-born population - Other Western Africa (%)
Place of birth for the foreign-born population - Australia (%)
Place of birth for the foreign-born population - New Zealand (%)
Place of birth for the foreign-born population - Fiji (%)
Place of birth for the foreign-born population - Micronesia (%)
Place of birth for the foreign-born population - Bahamas (%)
Place of birth for the foreign-born population - Barbados (%)
Place of birth for the foreign-born population - Cuba (%)
Place of birth for the foreign-born population - Dominica (%)
Place of birth for the foreign-born population - Dominican Republic (%)
Place of birth for the foreign-born population - Grenada (%)
Place of birth for the foreign-born population - Haiti (%)
Place of birth for the foreign-born population - Jamaica (%)
Place of birth for the foreign-born population - St. Vincent and the Grenadines (%)
Place of birth for the foreign-born population - Trinidad and Tobago (%)
Place of birth for the foreign-born population - West Indies (%)
Place of birth for the foreign-born population - Other Caribbean (%)
Place of birth for the foreign-born population - Belize (%)
Place of birth for the foreign-born population - Costa Rica (%)
Place of birth for the foreign-born population - El Salvador (%)
Place of birth for the foreign-born population - Guatemala (%)
Place of birth for the foreign-born population - Honduras (%)
Place of birth for the foreign-born population - Mexico (%)
Place of birth for the foreign-born population - Nicaragua (%)
Place of birth for the foreign-born population - Panama (%)
Place of birth for the foreign-born population - Other Central America (%)
Place of birth for the foreign-born population - Argentina (%)
Place of birth for the foreign-born population - Bolivia (%)
Place of birth for the foreign-born population - Brazil (%)
Place of birth for the foreign-born population - Chile (%)
Place of birth for the foreign-born population - Colombia (%)
Place of birth for the foreign-born population - Ecuador (%)
Place of birth for the foreign-born population - Guyana (%)
Place of birth for the foreign-born population - Peru (%)
Place of birth for the foreign-born population - Uruguay (%)
Place of birth for the foreign-born population - Venezuela (%)
Place of birth for the foreign-born population - Other South America (%)
Place of birth for the foreign-born population - Canada (%)
Place of birth for the foreign-born population - Other Northern America (%)
Place of birth for the foreign-born population - Other (%)
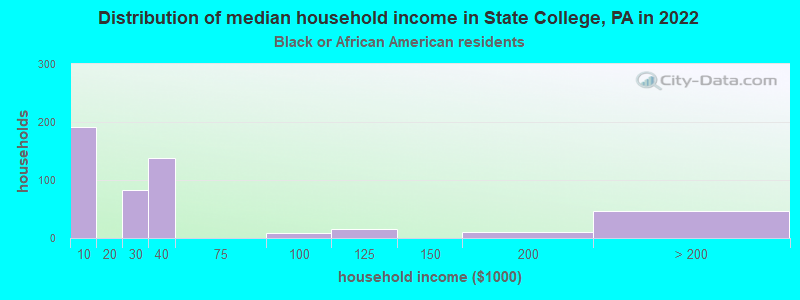
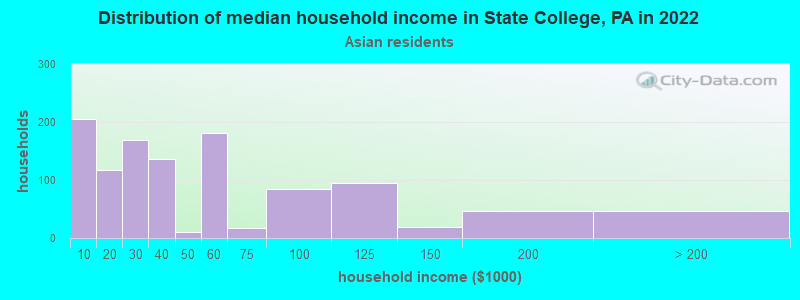
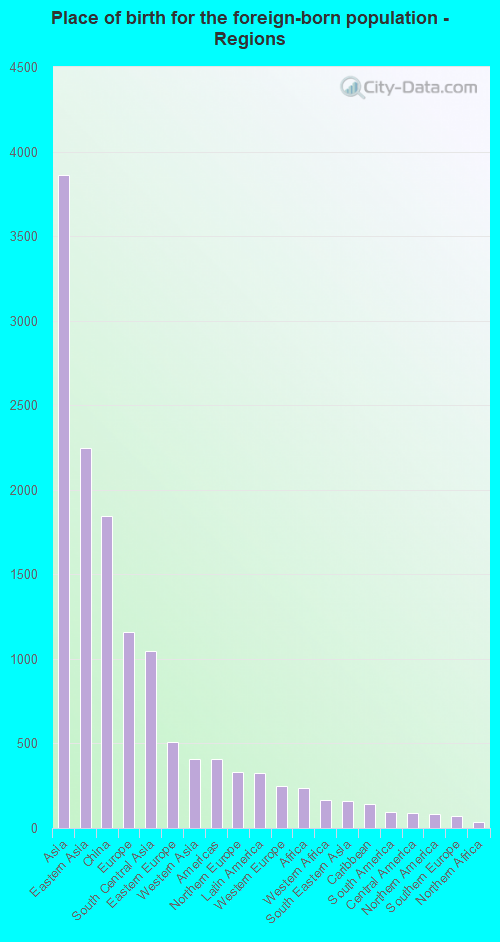
According to 2022 data, the most numerous races in State College, PA are White alone (32,673 residents), Black alone (1,316 residents), and Hispanic (1,735 residents). 81.4% of State College residents speak English at home. 13.9% of State College, PA residents are foreign-born (9.1% born in Asia, 2.7% born in Europe), which is 49.6% greater than the foreign-born rate of 7.0% across the entire state of Pennsylvania.
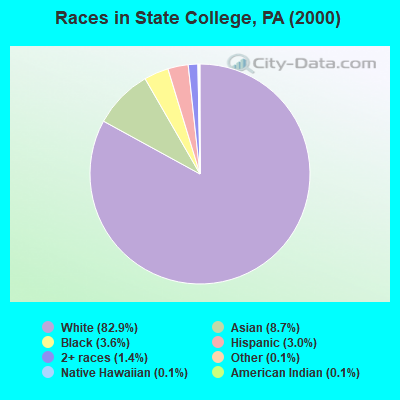
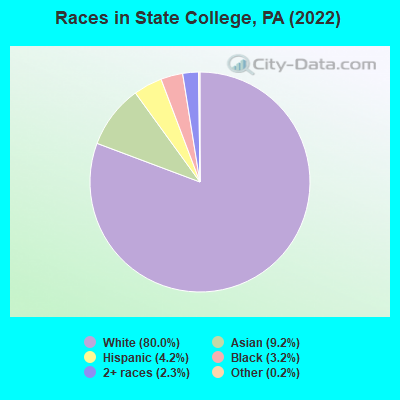
Race distribution in State College
2000 2022
10,322,455 84.1% White alone 1,202,437 9.8% Black alone 394,088 3.2% Hispanic 218,296 1.8% Asian alone 113,097 0.9% Two or more races 13,086 0.1% Other race alone 14,904 0.1% American Indian alone 2,691 0.02% Native Hawaiian and Other
9,487,228 73.1% White alone 1,311,581 10.1% Black alone 1,115,997 8.6% Hispanic 493,942 3.8% Two or more races 487,124 3.8% Asian alone 63,582 0.5% Other race alone 10,130 0.08% American Indian alone 2,424 0.02% Native Hawaiian and Other
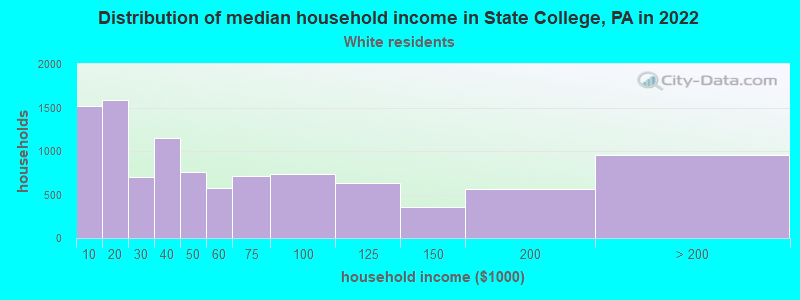
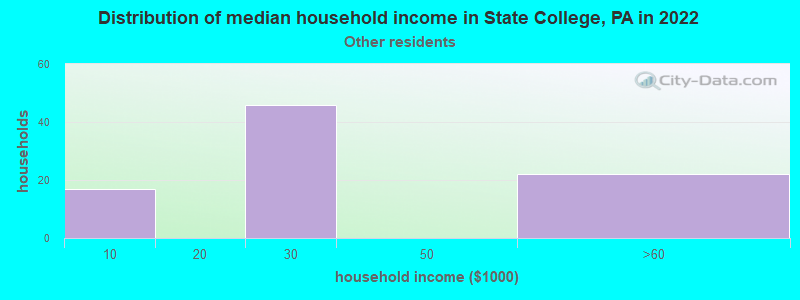
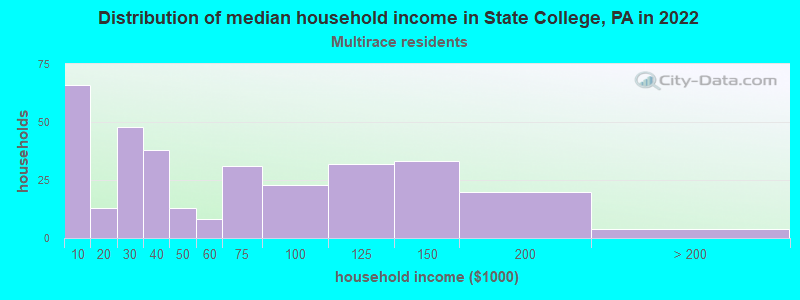
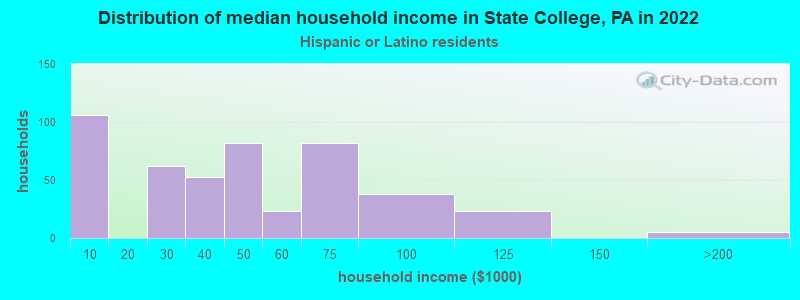
Income and house value in State College Median household income in 2022 $44,566 White non-Hispanic householders$19,541 Black householders$45,106 Asian householders$35,880 Some other race householders$43,471 Two or more races householders$72,404 Hispanic or Latino race householdersMedian 2022 house value $429,533 White Non-Hispanic householders$725,562 Black or African American householders$449,157 American Indian or Alaska Native householders $238,537 Asian householders$283,315 Some other race householders$656,461 Two or more races householders$367,065 Hispanic or Latino householders
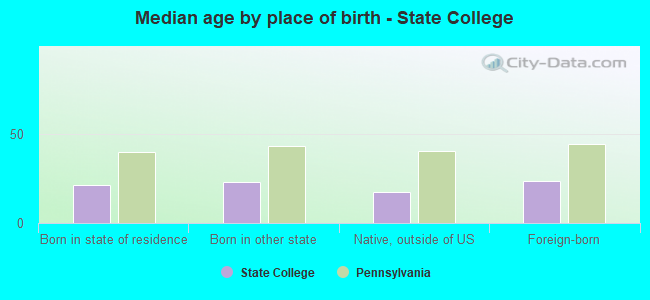
Median age by race in State College
22.1 Median age for White residents22.3 21.5 19.3 Median age for Black or African American residents19.4 18.3 33.8 Median age for American Indian / Alaska Native residents-714,583,332.6 -577,519,379.3 20.8 Median age for Asian residents21.2 20.1 -680,432,644.4 Median age for Native Hawaiian / Pacific Islander residents-649,523,808.9 -666,666,666.0 23.8 Median age for Other race residents22.3 23.7 22.5 Median age for Two or more races residents22.1 24.3 22.1 Median age for White alone residents22.1 21.5 23.3 Median age for Hispanic or Latino residents22.5 25.7
Owner/renter occupied households by race in State College
House owners and renters - White residents 2,818 27.3% Owner occupied7,499 72.7% Renter occupiedHouse owners and renters - Black or African American residents 37 9.2% Owner occupied365 90.8% Renter occupiedHouse owners and renters - American Indian / Alaska Native residents 23 100.0% Renter occupiedHouse owners and renters - Asian residents 56 5.8% Owner occupied905 94.2% Renter occupiedHouse owners and renters - Other race residents 73 100.0% Renter occupiedHouse owners and renters - Two or more races residents 78 31.3% Owner occupied171 68.7% Renter occupiedHouse owners and renters - White alone residents 2,796 27.3% Owner occupied7,447 72.7% Renter occupiedHouse owners and renters - Hispanic or Latino residents 66 27.2% Owner occupied177 72.8% Renter occupied
Language usage in State College
English speakers - Total 81.4% of residents of State College speak English at home.
2.5% of residents speak Spanish at home 833 81.5% Speak English very well189 18.5% Speak English less than very well16.5% of residents speak other language at home 4,905 73.5% Speak English very well1,766 26.5% Speak English less than very well
English speakers - Born in the United States 84.7% of residents of State College speak English at home.
3.2% of residents speak Spanish at home 444 97.4% Speak English very well12 2.6% Speak English less than very well12.3% of residents speak other language at home 1,606 92.1% Speak English very well138 7.9% Speak English less than very well
English speakers - Native, born elsewhere 45.3% of residents of State College speak English at home.
35.0% of residents speak Spanish at home 64 33.5% Speak English very well127 66.5% Speak English less than very well24.2% of residents speak other language at home 80 60.6% Speak English very well52 39.4% Speak English less than very well
English speakers - Foreign-born 17.3% of residents of State College speak English at home.
3.0% of residents speak Spanish at home 154 91.1% Speak English very well15 8.9% Speak English less than very well78.7% of residents speak other language at home 2,976 67.2% Speak English very well1,450 32.8% Speak English less than very well
White (Caucasian) - Speak only English Native:
94.6% (29,190)Foreign-born:
21.0% (549)
White (Caucasian) - Speak another language Native:
5.4% (1,680)Foreign-born:
79.8% (2,092)
Black or African American - Speak only English Native:
93.3% (897)Foreign-born:
35.2% (102)
Black or African American - Speak another language Native:
6.6% (63)Foreign-born:
62.4% (181)
American Indian / Alaska Native - Speak only English Native:
84.4% (22)Foreign-born:
71.9% (15)
Asian - Speak only English Native:
35.0% (379)Foreign-born:
10.7% (273)
Asian - Speak another language Native:
64.9% (703)Foreign-born:
88.5% (2,251)
Two or more races - Speak only English Native:
80.4% (1,134)Foreign-born:
13.6% (16)
Two or more races - Speak another language Native:
20.4% (288)Foreign-born:
86.9% (100)
White alone - Speak only English Native:
96.3% (28,839)Foreign-born:
22.0% (565)
White alone - Speak another language Native:
3.6% (1,089)Foreign-born:
78.6% (2,019)
Hispanic or Latino - Speak only English Native:
52.0% (809)Foreign-born:
5.1% (12)
Hispanic or Latino - Speak another language Native:
47.6% (741)Foreign-born:
95.4% (227)
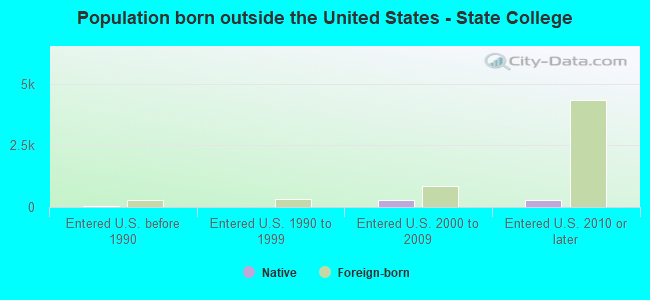
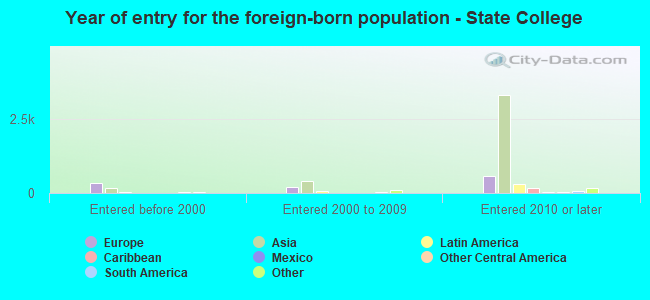
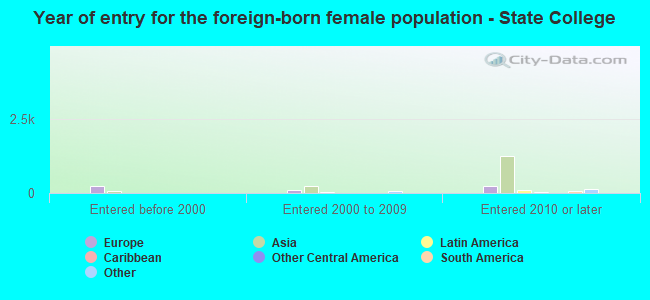
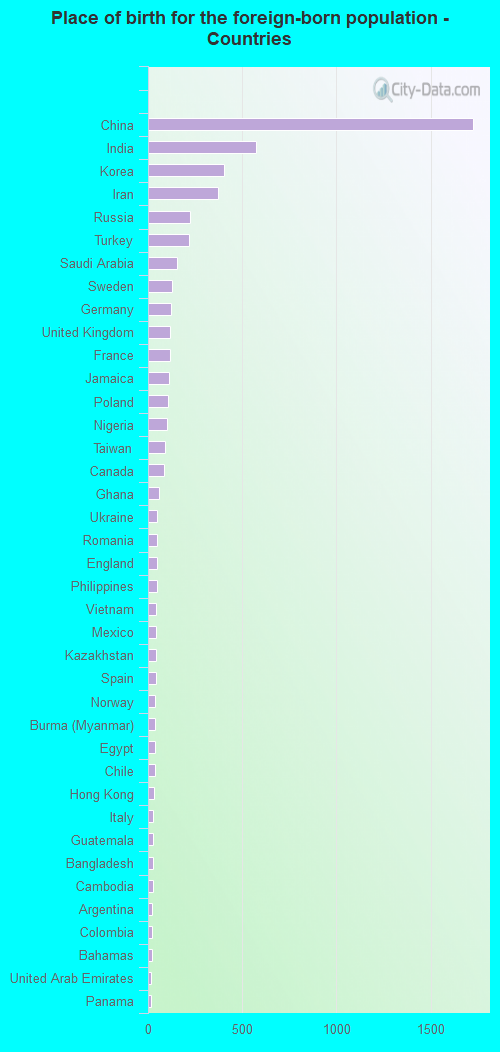
Foreign-born residents in State College 5,668 residents are foreign born (9.1% Asia , 2.7% Europe ).
This city:
13.9%Pennsylvania:
7.3%
Marital status for residents in State College Marital status - White (Caucasian) population 15 years and over
Males 81.6% Never married15.0% Now married0.2% Separated0.6% Widowed2.5% DivorcedFemales 74.8% Never married17.5% Now married0.5% Separated3.3% Widowed4.0% DivorcedWomen who gave birth in the past 12 months Now married:
100.0% (225)Unmarried:
0.0% (0)
Women who did not give birth in the past 12 months Now married:
9.7% (1,179)Unmarried:
90.3% (10,954)
Marital status - Black or African American population 15 years and over
Males 72.5% Never married13.8% Now married7.2% Separated0.0% Widowed6.5% DivorcedFemales 91.1% Never married7.1% Now married0.0% Separated0.0% Widowed1.7% DivorcedWomen who did not give birth in the past 12 months Now married:
7.4% (43)Unmarried:
92.6% (543)
Marital status - American Indian / Alaska Native population 15 years and over
Males 100.0% Never married0.0% Now married0.0% Separated0.0% Widowed0.0% DivorcedFemales 0.0% Never married100.0% Now married0.0% Separated0.0% Widowed0.0% DivorcedWomen who did not give birth in the past 12 months Now married:
100.0% (22)Unmarried:
0.0% (0)
Marital status - Asian population 15 years and over
Males 87.1% Never married11.6% Now married0.4% Separated0.0% Widowed1.0% DivorcedFemales 83.1% Never married12.6% Now married4.3% Separated0.0% Widowed0.0% DivorcedWomen who did not give birth in the past 12 months Now married:
13.1% (198)Unmarried:
86.9% (1,316)
Marital status - Other race population 15 years and over
Males 44.6% Never married55.4% Now married0.0% Separated0.0% Widowed0.0% DivorcedFemales 100.0% Never married0.0% Now married0.0% Separated0.0% Widowed0.0% DivorcedWomen who did not give birth in the past 12 months Now married:
0.0% (0)Unmarried:
100.0% (66)
Marital status - Two or more races population 15 years and over
Males 71.6% Never married28.4% Now married0.0% Separated0.0% Widowed0.0% DivorcedFemales 87.9% Never married11.1% Now married1.0% Separated0.0% Widowed0.0% DivorcedWomen who did not give birth in the past 12 months Now married:
7.2% (39)Unmarried:
92.8% (509)
Marital status - White alone, not Hispanic / Latino population 15 years and over
Males 81.4% Never married15.2% Now married0.2% Separated0.6% Widowed2.6% DivorcedFemales 73.7% Never married18.2% Now married0.5% Separated3.4% Widowed4.2% DivorcedWomen who gave birth in the past 12 months Now married:
100.0% (227)Unmarried:
0.0% (0)
Women who did not give birth in the past 12 months Now married:
10.2% (1,185)Unmarried:
89.8% (10,382)
Marital status - Hispanic or Latino population 15 years and over
Males 81.0% Never married17.8% Now married1.2% Separated0.0% Widowed0.0% DivorcedFemales 94.9% Never married4.6% Now married0.4% Separated0.0% Widowed0.0% DivorcedWomen who did not give birth in the past 12 months Now married:
2.7% (24)Unmarried:
97.3% (881)
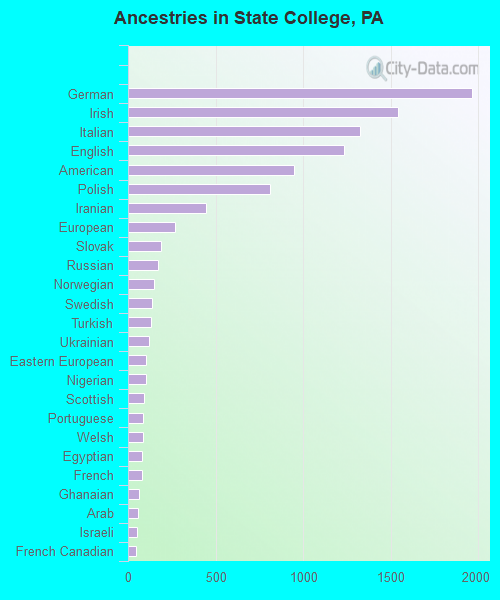
Ancestries in State College
1,962 12.8% German1,538 10.1% Irish1,323 8.7% Italian1,232 8.1% English945 6.2% American808 5.3% Polish447 2.9% Iranian266 1.7% European186 1.2% Slovak171 1.1% Russian149 1.0% Norwegian139 0.9% Swedish130 0.9% Turkish117 0.8% Ukrainian100 0.7% Eastern European100 0.7% Nigerian93 0.6% Scottish88 0.6% Portuguese86 0.6% Welsh82 0.5% Egyptian79 0.5% French64 0.4% Ghanaian57 0.4% Arab51 0.3% Israeli44 0.3% French Canadian43 0.3% Pennsylvania German35 0.2% Austrian31 0.2% Armenian31 0.2% Slavic24 0.2% Greek22 0.1% Ethiopian21 0.1% Canadian21 0.1% Bahamian19 0.1% Jamaican18 0.1% British17 0.1% Scotch-Irish17 0.1% Lithuanian17 0.1% Lebanese15 0.10% Swiss12 0.08% Czechoslovakian9 0.06% Dutch7 0.05% Hungarian6 0.04% Danish6 0.04% African3 0.02% Northern European3 0.02% Guyanese3 0.02% Latvian2 0.01% Croatian2 0.01% Romanian
Geographical mobility in State College Same house 1 year ago 16,525 49.3% White (Caucasian)437 32.1% Black or African American2 3.6% American Indian / Alaska Native1,834 49.3% Asian79 55.8% Other race950 63.9% Two or more races16,209 49.8% White alone, not Hispanic / Latino750 43.2% Hispanic or LatinoMoved within same county 5,518 16.5% White / Caucasian424 31.2% Black or African American21 45.0% American Indian / Alaska Native901 24.2% Asian19 13.1% Other race138 9.3% Two or more races5,434 16.7% White alone, not Hispanic / Latino141 8.1% Hispanic or LatinoMoved within same state 7,380 22.0% White / Caucasian218 16.1% Black or African American14 30.8% American Indian / Alaska Native144 3.9% Asian6 4.5% Other race143 9.6% Two or more races7,351 22.6% White alone, not Hispanic / Latino334 19.2% Hispanic or LatinoMoved from different state 4,807 14.4% White / Caucasian349 25.6% Black or African American388 10.4% Asian13 99.3% Native Hawaiian / Pacific Islander34 24.2% Other race217 14.6% Two or more races4,428 13.6% White alone, not Hispanic / Latino409 23.5% Hispanic or LatinoMoved from abroad 1,257 3.8% White27 2.0% Black or African American465 12.5% Asian1,172 3.6% White alone, not Hispanic / Latino81 4.7% Hispanic or Latino
Children Nativity (place of birth) in State College
Children under 6 years - Living with two parents Both parents native 485 99.8% Native1 0.2% Foreign-bornBoth parents foreign-born 12 32.8% Native24 67.2% Foreign-bornOne native, one foreign-born parent 57 100.0% NativeChildren under 6 years - Living with one parent Native parent 38 100.0% NativeForeign-born parent 79 100.0% NativeChildren 6 to 17 years - Living with two parents Both parents native 751 97.2% Native21 2.8% Foreign-bornBoth parents foreign-born 44 43.3% Native58 56.7% Foreign-bornOne native, one foreign-born parent 183 100.0% NativeChildren 6 to 17 years - Living with one parent Native parent 522 100.0% NativeForeign-born parent 43 56.2% Native34 43.8% Foreign-born