Races in Sunnyside, California (CA) Detailed Stats
Data:
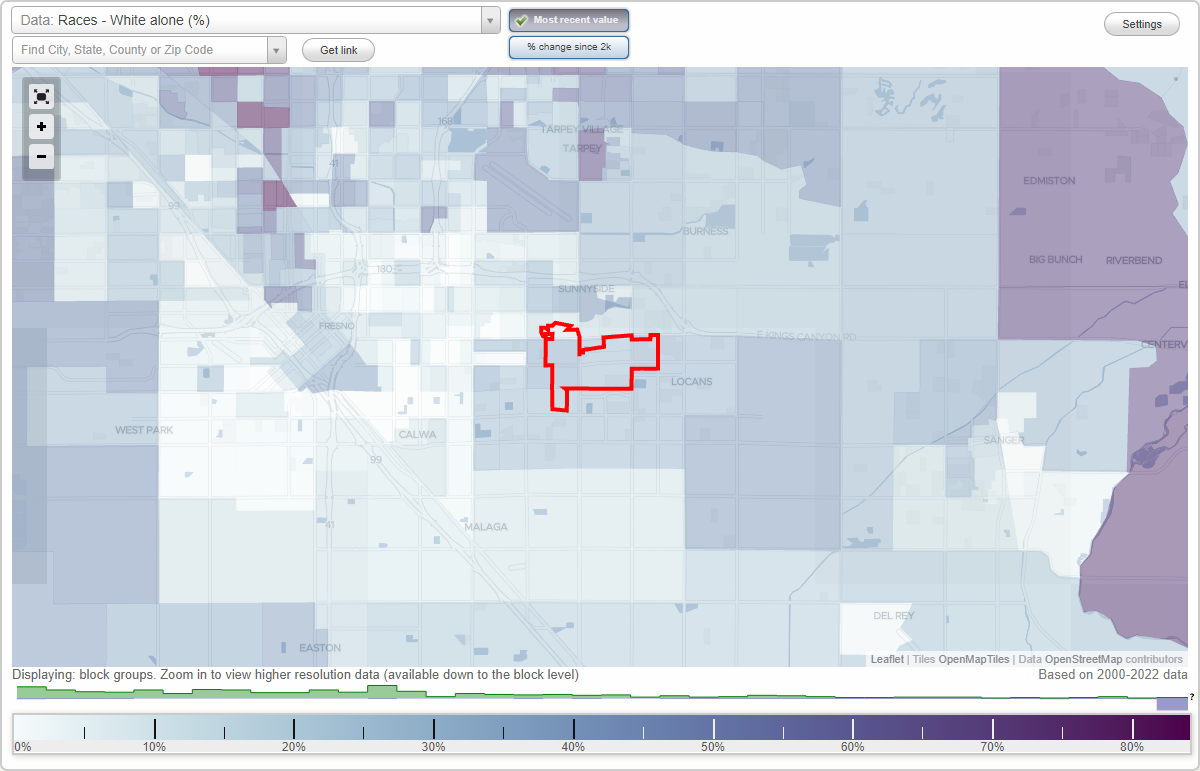
Races - White alone (%)
Races - White alone (% change since 2000)
Races - Black alone (%)
Races - Black alone (% change since 2000)
Races - American Indian alone (%)
Races - American Indian alone (% change since 2000)
Races - Asian alone (%)
Races - Asian alone (% change since 2000)
Races - Hispanic (%)
Races - Hispanic (% change since 2000)
Races - Native Hawaiian and Other Pacific Islander alone (%)
Races - Native Hawaiian and Other Pacific Islander alone (% change since 2000)
Races - Two or more races(%)
Races - Two or more races(% change since 2000)
Races - Other race alone (%)
Races - Other race alone (% change since 2000)
Racial diversity
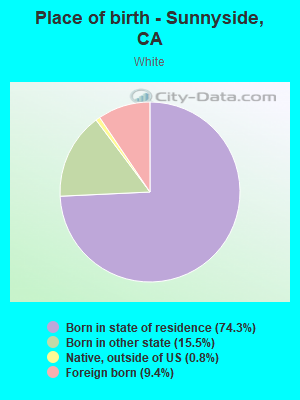
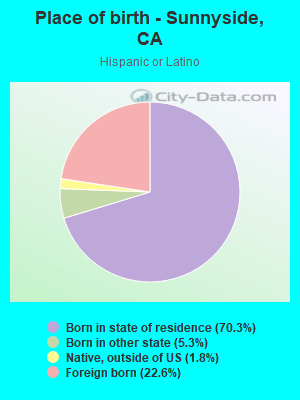
Place of birth - Born in state of residence (%)
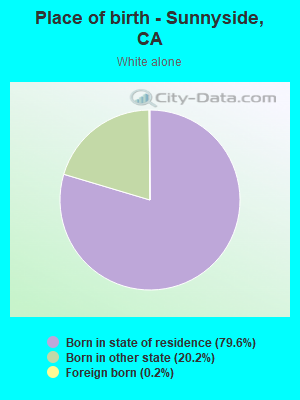
Place of birth - Born in state of residence (%) - White
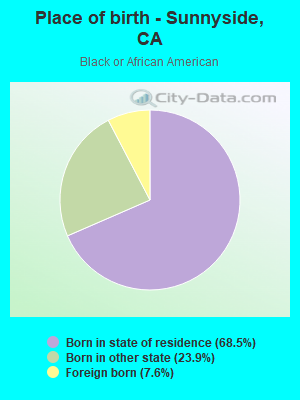
Place of birth - Born in state of residence (%) - Black or African American
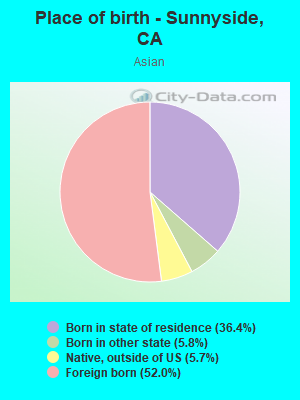
Place of birth - Born in state of residence (%) - Asian
Place of birth - Born in state of residence (%) - Hispanic or Latino
Place of birth - Born in state of residence (%) - American Indian and Alaska Native
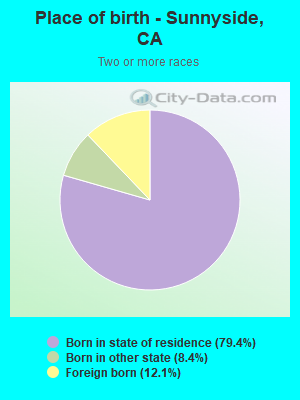
Place of birth - Born in state of residence (%) - Multirace
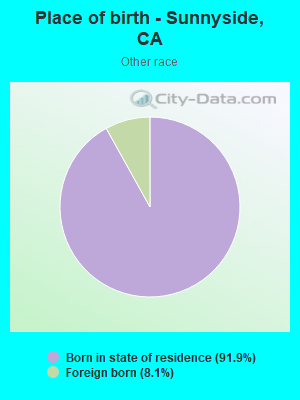
Place of birth - Born in state of residence (%) - Other Race
Place of birth - Born in other state (%)
Place of birth - Born in other state (%) - White
Place of birth - Born in other state (%) - Black or African American
Place of birth - Born in other state (%) - Asian
Place of birth - Born in other state (%) - Hispanic or Latino
Place of birth - Born in other state (%) - American Indian and Alaska Native
Place of birth - Born in other state (%) - Multirace
Place of birth - Born in other state (%) - Other Race
Place of birth - Native, outside of US (%)
Place of birth - Native, outside of US (%) - White
Place of birth - Native, outside of US (%) - Black or African American
Place of birth - Native, outside of US (%) - Asian
Place of birth - Native, outside of US (%) - Hispanic or Latino
Place of birth - Native, outside of US (%) - American Indian and Alaska Native
Place of birth - Native, outside of US (%) - Multirace
Place of birth - Native, outside of US (%) - Other Race
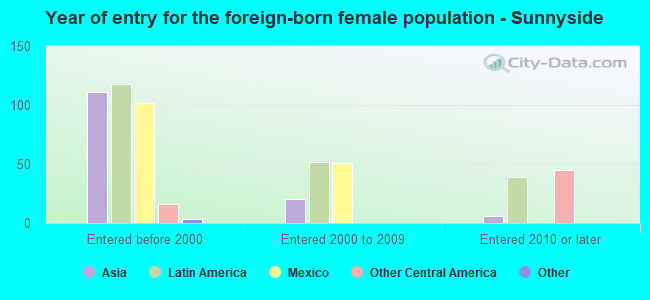
Place of birth - Foreign born (%)
Place of birth - Foreign born (%) - White
Place of birth - Foreign born (%) - Black or African American
Place of birth - Foreign born (%) - Asian
Place of birth - Foreign born (%) - Hispanic or Latino
Place of birth - Foreign born (%) - American Indian and Alaska Native
Place of birth - Foreign born (%) - Multirace
Place of birth - Foreign born (%) - Other Race
Residents speaking English at home (%)
Residents speaking English at home - Born in the United States (%)
Residents speaking English at home - Native, born elsewhere (%)
Residents speaking English at home - Foreign born (%)
Residents speaking Spanish at home (%)
Residents speaking Spanish at home - Born in the United States (%)
Residents speaking Spanish at home - Native, born elsewhere (%)
Residents speaking Spanish at home - Foreign born (%)
Residents speaking other language at home (%)
Residents speaking other language at home - Born in the United States (%)
Residents speaking other language at home - Native, born elsewhere (%)
Residents speaking other language at home - Foreign born (%)
Marital status - Never married (%)
Marital status - Now married (%)
Marital status - Separated (%)
Marital status - Widowed (%)
Marital status - Divorced (%)
Ancestries Reported - Arab (%)
Ancestries Reported - Czech (%)
Ancestries Reported - Danish (%)
Ancestries Reported - Dutch (%)
Ancestries Reported - English (%)
Ancestries Reported - French (%)
Ancestries Reported - French Canadian (%)
Ancestries Reported - German (%)
Ancestries Reported - Greek (%)
Ancestries Reported - Hungarian (%)
Ancestries Reported - Irish (%)
Ancestries Reported - Italian (%)
Ancestries Reported - Lithuanian (%)
Ancestries Reported - Norwegian (%)
Ancestries Reported - Polish (%)
Ancestries Reported - Portuguese (%)
Ancestries Reported - Russian (%)
Ancestries Reported - Scotch-Irish (%)
Ancestries Reported - Scottish (%)
Ancestries Reported - Slovak (%)
Ancestries Reported - Subsaharan African (%)
Ancestries Reported - Swedish (%)
Ancestries Reported - Swiss (%)
Ancestries Reported - Ukrainian (%)
Ancestries Reported - United States (%)
Ancestries Reported - Welsh (%)
Ancestries Reported - West Indian (%)
Ancestries Reported - Other (%)
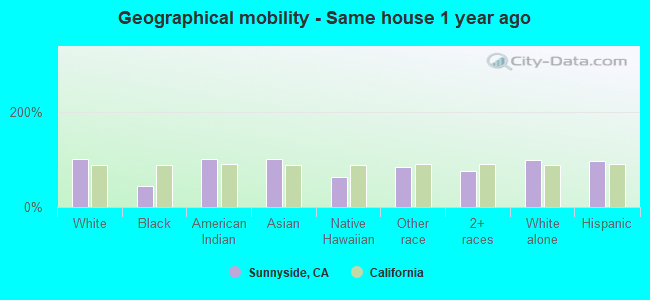
Geographical mobility - Same house 1 year ago (%)
Geographical mobility - Same house 1 year ago (%) - White
Geographical mobility - Same house 1 year ago (%) - Black or African American
Geographical mobility - Same house 1 year ago (%) - Asian
Geographical mobility - Same house 1 year ago (%) - Hispanic or Latino
Geographical mobility - Same house 1 year ago (%) - American Indian and Alaska Native
Geographical mobility - Same house 1 year ago (%) - Multirace
Geographical mobility - Same house 1 year ago (%) - Other Race
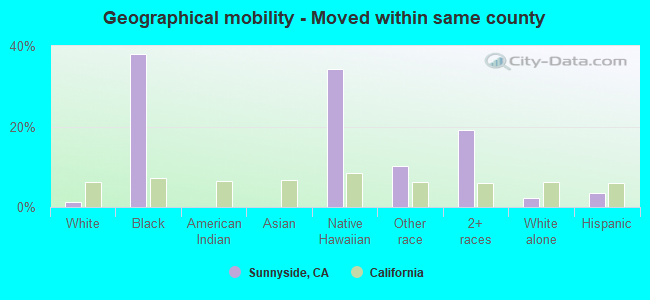
Geographical mobility - Moved within same county (%)
Geographical mobility - Moved within same county (%) - White
Geographical mobility - Moved within same county (%) - Black or African American
Geographical mobility - Moved within same county (%) - Asian
Geographical mobility - Moved within same county (%) - Hispanic or Latino
Geographical mobility - Moved within same county (%) - American Indian and Alaska Native
Geographical mobility - Moved within same county (%) - Multirace
Geographical mobility - Moved within same county (%) - Other Race
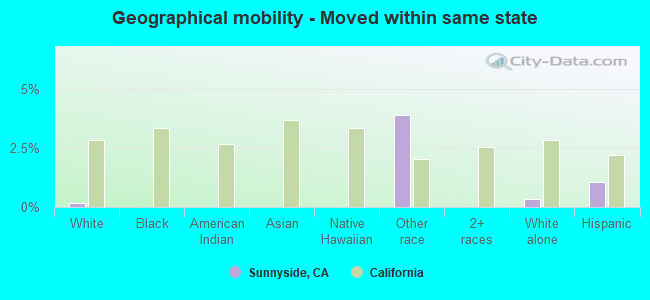
Geographical mobility - Moved from different county within same state (%)
Geographical mobility - Moved from different county within same state (%) - White
Geographical mobility - Moved from different county within same state (%) - Black or African American
Geographical mobility - Moved from different county within same state (%) - Asian
Geographical mobility - Moved from different county within same state (%) - Hispanic or Latino
Geographical mobility - Moved from different county within same state (%) - American Indian and Alaska Native
Geographical mobility - Moved from different county within same state (%) - Multirace
Geographical mobility - Moved from different county within same state (%) - Other Race
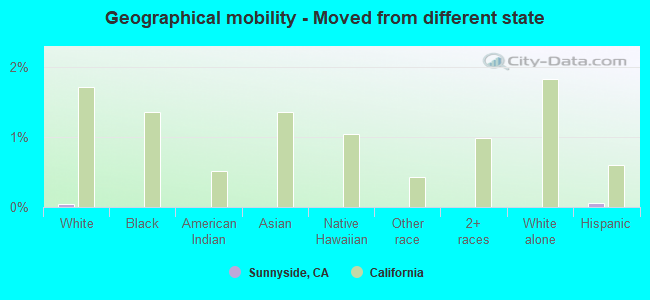
Geographical mobility - Moved from different state (%)
Geographical mobility - Moved from different state (%) - White
Geographical mobility - Moved from different state (%) - Black or African American
Geographical mobility - Moved from different state (%) - Asian
Geographical mobility - Moved from different state (%) - Hispanic or Latino
Geographical mobility - Moved from different state (%) - American Indian and Alaska Native
Geographical mobility - Moved from different state (%) - Multirace
Geographical mobility - Moved from different state (%) - Other Race
Geographical mobility - Moved from abroad (%)
Geographical mobility - Moved from abroad (%) - White
Geographical mobility - Moved from abroad (%) - Black or African American
Geographical mobility - Moved from abroad (%) - Asian
Geographical mobility - Moved from abroad (%) - Hispanic or Latino
Geographical mobility - Moved from abroad (%) - American Indian and Alaska Native
Geographical mobility - Moved from abroad (%) - Multirace
Geographical mobility - Moved from abroad (%) - Other Race
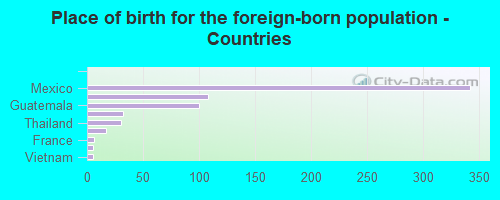
Place of birth for the foreign-born population - Ireland (%)
Place of birth for the foreign-born population - Denmark (%)
Place of birth for the foreign-born population - Norway (%)
Place of birth for the foreign-born population - Sweden (%)
Place of birth for the foreign-born population - United Kingdom (%)
Place of birth for the foreign-born population - England (%)
Place of birth for the foreign-born population - Scotland (%)
Place of birth for the foreign-born population - Other Northern Europe (%)
Place of birth for the foreign-born population - Austria (%)
Place of birth for the foreign-born population - Belgium (%)
Place of birth for the foreign-born population - France (%)
Place of birth for the foreign-born population - Germany (%)
Place of birth for the foreign-born population - Netherlands (%)
Place of birth for the foreign-born population - Switzerland (%)
Place of birth for the foreign-born population - Other Western Europe (%)
Place of birth for the foreign-born population - Greece (%)
Place of birth for the foreign-born population - Italy (%)
Place of birth for the foreign-born population - Portugal (%)
Place of birth for the foreign-born population - Spain (%)
Place of birth for the foreign-born population - Other Southern Europe (%)
Place of birth for the foreign-born population - Albania (%)
Place of birth for the foreign-born population - Belarus (%)
Place of birth for the foreign-born population - Bosnia and Herzegovina (%)
Place of birth for the foreign-born population - Bulgaria (%)
Place of birth for the foreign-born population - Croatia (%)
Place of birth for the foreign-born population - Czechoslovakia (%)
Place of birth for the foreign-born population - Hungary (%)
Place of birth for the foreign-born population - Latvia (%)
Place of birth for the foreign-born population - Lithuania (%)
Place of birth for the foreign-born population - North Macedonia (Macedonia) (%)
Place of birth for the foreign-born population - Moldova (%)
Place of birth for the foreign-born population - Poland (%)
Place of birth for the foreign-born population - Romania (%)
Place of birth for the foreign-born population - Russia (%)
Place of birth for the foreign-born population - Serbia (%)
Place of birth for the foreign-born population - Ukraine (%)
Place of birth for the foreign-born population - Other Eastern Europe (%)
Place of birth for the foreign-born population - China (%)
Place of birth for the foreign-born population - Hong Kong (%)
Place of birth for the foreign-born population - Taiwan (%)
Place of birth for the foreign-born population - Japan (%)
Place of birth for the foreign-born population - Korea (%)
Place of birth for the foreign-born population - Other Eastern Asia (%)
Place of birth for the foreign-born population - Afghanistan (%)
Place of birth for the foreign-born population - Bangladesh (%)
Place of birth for the foreign-born population - India (%)
Place of birth for the foreign-born population - Iran (%)
Place of birth for the foreign-born population - Kazakhstan (%)
Place of birth for the foreign-born population - Nepal (%)
Place of birth for the foreign-born population - Pakistan (%)
Place of birth for the foreign-born population - Sri Lanka (%)
Place of birth for the foreign-born population - Uzbekistan (%)
Place of birth for the foreign-born population - Other South Central Asia (%)
Place of birth for the foreign-born population - Burma (%)
Place of birth for the foreign-born population - Cambodia (%)
Place of birth for the foreign-born population - Indonesia (%)
Place of birth for the foreign-born population - Laos (%)
Place of birth for the foreign-born population - Malaysia (%)
Place of birth for the foreign-born population - Philippines (%)
Place of birth for the foreign-born population - Singapore (%)
Place of birth for the foreign-born population - Thailand (%)
Place of birth for the foreign-born population - Vietnam (%)
Place of birth for the foreign-born population - Other South Eastern Asia (%)
Place of birth for the foreign-born population - Armenia (%)
Place of birth for the foreign-born population - Iraq (%)
Place of birth for the foreign-born population - Israel (%)
Place of birth for the foreign-born population - Jordan (%)
Place of birth for the foreign-born population - Kuwait (%)
Place of birth for the foreign-born population - Lebanon (%)
Place of birth for the foreign-born population - Saudi Arabia (%)
Place of birth for the foreign-born population - Syria (%)
Place of birth for the foreign-born population - Turkey (%)
Place of birth for the foreign-born population - Yemen (%)
Place of birth for the foreign-born population - Other Western Asia (%)
Place of birth for the foreign-born population - Eritrea (%)
Place of birth for the foreign-born population - Ethiopia (%)
Place of birth for the foreign-born population - Kenya (%)
Place of birth for the foreign-born population - Somalia (%)
Place of birth for the foreign-born population - Uganda (%)
Place of birth for the foreign-born population - Zimbabwe (%)
Place of birth for the foreign-born population - Other Eastern Africa (%)
Place of birth for the foreign-born population - Cameroon (%)
Place of birth for the foreign-born population - Congo (%)
Place of birth for the foreign-born population - Democratic Republic of Congo (Zaire) (%)
Place of birth for the foreign-born population - Other Middle Africa (%)
Place of birth for the foreign-born population - Egypt (%)
Place of birth for the foreign-born population - Morocco (%)
Place of birth for the foreign-born population - Sudan (%)
Place of birth for the foreign-born population - Other Northern Africa (%)
Place of birth for the foreign-born population - South Africa (%)
Place of birth for the foreign-born population - Other Southern Africa (%)
Place of birth for the foreign-born population - Cabo Verde (%)
Place of birth for the foreign-born population - Ghana (%)
Place of birth for the foreign-born population - Liberia (%)
Place of birth for the foreign-born population - Nigeria (%)
Place of birth for the foreign-born population - Senegal (%)
Place of birth for the foreign-born population - Sierra Leone (%)
Place of birth for the foreign-born population - Other Western Africa (%)
Place of birth for the foreign-born population - Australia (%)
Place of birth for the foreign-born population - New Zealand (%)
Place of birth for the foreign-born population - Fiji (%)
Place of birth for the foreign-born population - Micronesia (%)
Place of birth for the foreign-born population - Bahamas (%)
Place of birth for the foreign-born population - Barbados (%)
Place of birth for the foreign-born population - Cuba (%)
Place of birth for the foreign-born population - Dominica (%)
Place of birth for the foreign-born population - Dominican Republic (%)
Place of birth for the foreign-born population - Grenada (%)
Place of birth for the foreign-born population - Haiti (%)
Place of birth for the foreign-born population - Jamaica (%)
Place of birth for the foreign-born population - St. Vincent and the Grenadines (%)
Place of birth for the foreign-born population - Trinidad and Tobago (%)
Place of birth for the foreign-born population - West Indies (%)
Place of birth for the foreign-born population - Other Caribbean (%)
Place of birth for the foreign-born population - Belize (%)
Place of birth for the foreign-born population - Costa Rica (%)
Place of birth for the foreign-born population - El Salvador (%)
Place of birth for the foreign-born population - Guatemala (%)
Place of birth for the foreign-born population - Honduras (%)
Place of birth for the foreign-born population - Mexico (%)
Place of birth for the foreign-born population - Nicaragua (%)
Place of birth for the foreign-born population - Panama (%)
Place of birth for the foreign-born population - Other Central America (%)
Place of birth for the foreign-born population - Argentina (%)
Place of birth for the foreign-born population - Bolivia (%)
Place of birth for the foreign-born population - Brazil (%)
Place of birth for the foreign-born population - Chile (%)
Place of birth for the foreign-born population - Colombia (%)
Place of birth for the foreign-born population - Ecuador (%)
Place of birth for the foreign-born population - Guyana (%)
Place of birth for the foreign-born population - Peru (%)
Place of birth for the foreign-born population - Uruguay (%)
Place of birth for the foreign-born population - Venezuela (%)
Place of birth for the foreign-born population - Other South America (%)
Place of birth for the foreign-born population - Canada (%)
Place of birth for the foreign-born population - Other Northern America (%)
Place of birth for the foreign-born population - Other (%)
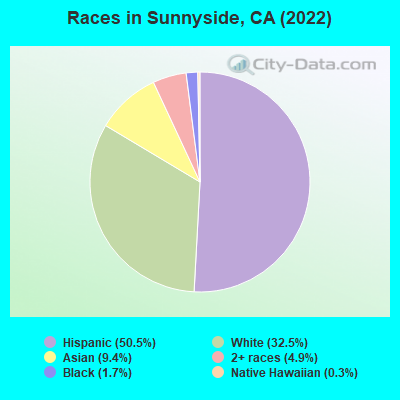
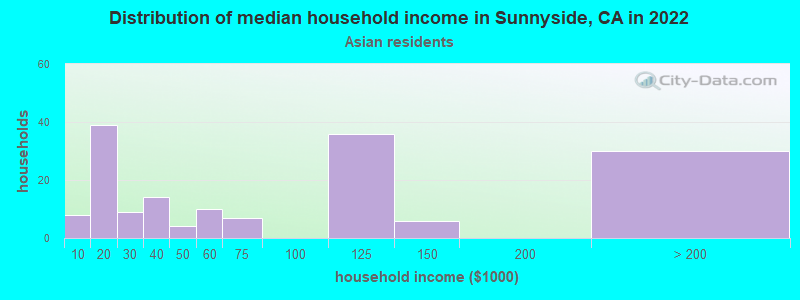
According to 2022 data, the most numerous races in Sunnyside, CA are Hispanic (1,982 residents), White alone (1,758 residents), and Asian alone (364 residents). 63.8% of Sunnyside residents speak English at home.
Race distribution in Sunnyside 1,982 43.7% Hispanic 1,758 38.7% White alone 364 8.0% Asian alone 179 3.9% Black alone 166 3.7% Two or more races 34 0.7% Native Hawaiian and Other
2000 2022
15,816,790 46.7% White alone 10,966,556 32.4% Hispanic 3,648,860 10.8% Asian alone 2,181,926 6.4% Black alone 903,115 2.7% Two or more races 178,984 0.5% American Indian alone 103,736 0.3% Native Hawaiian and Other 71,681 0.2% Other race alone
15,732,184 40.3% Hispanic 13,160,426 33.7% White alone 5,957,867 15.3% Asian alone 2,025,218 5.2% Black alone 1,663,222 4.3% Two or more races 251,618 0.6% Other race alone 135,777 0.3% Native Hawaiian and Other 103,030 0.3% American Indian alone
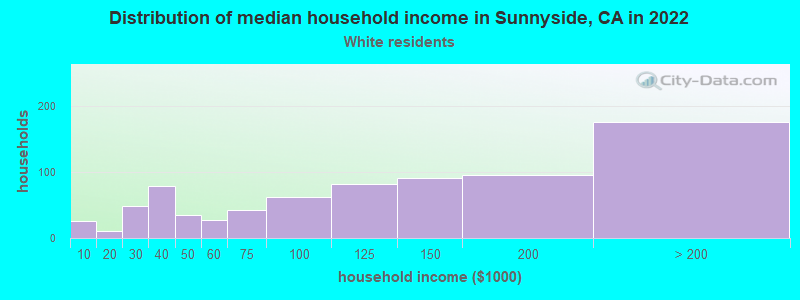
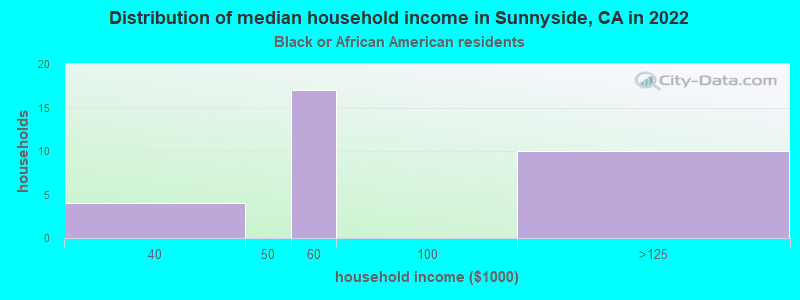
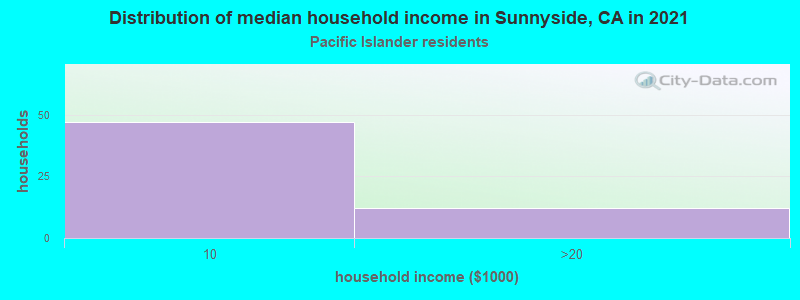
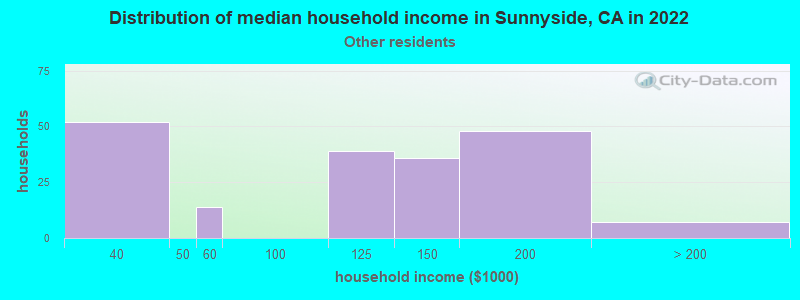
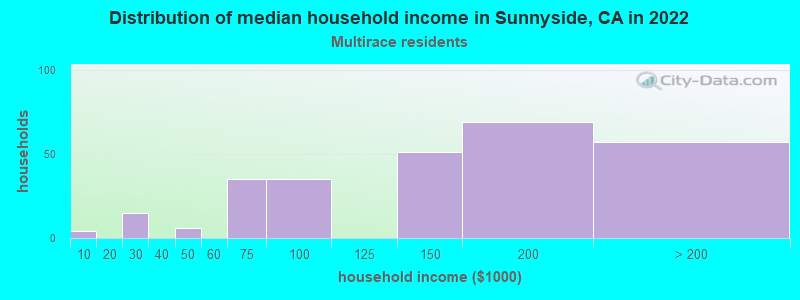
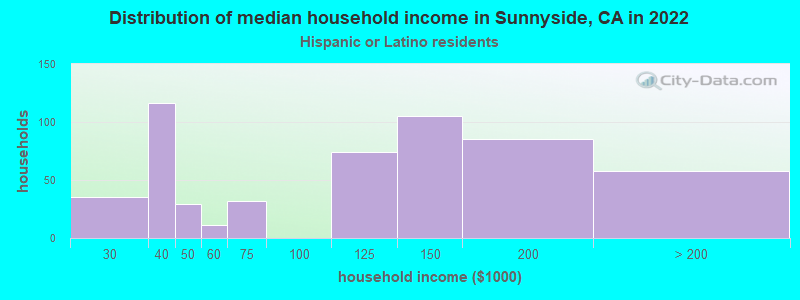
Income and house value in Sunnyside Median household income in 2022 $118,177 White non-Hispanic householders$56,699 Black householders$37,158 Asian householders$11,426 Some other race householders$16,250 Two or more races householders$84,867 Hispanic or Latino race householders
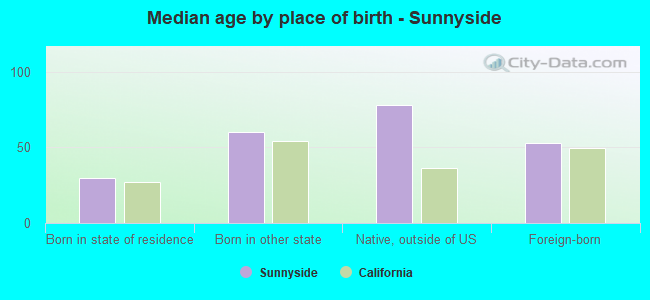
Median age by race in Sunnyside
45.9 Median age for White residents45.0 46.6 21.6 Median age for Black or African American residents8.3 27.8 46.5 Median age for Asian residents26.6 60.6 12.0 Median age for Native Hawaiian / Pacific Islander residents44.0 Median age for Other race residents32.3 43.7 26.7 Median age for Two or more races residents33.9 22.1 51.5 Median age for White alone residents49.5 53.1 36.3 Median age for Hispanic or Latino residents31.7 36.8
Owner/renter occupied households by race in Sunnyside
House owners and renters - White residents 789 74.3% Owner occupied274 25.7% Renter occupiedHouse owners and renters - Black or African American residents 22 28.4% Owner occupied57 71.6% Renter occupiedHouse owners and renters - American Indian / Alaska Native residents 18 100.0% Owner occupiedHouse owners and renters - Asian residents 142 87.7% Owner occupied20 12.3% Renter occupiedHouse owners and renters - Native Hawaiian / Pacific Islander residents 15 60.0% Owner occupied10 40.0% Renter occupiedHouse owners and renters - Other race residents 107 86.5% Owner occupied17 13.5% Renter occupiedHouse owners and renters - Two or more races residents 103 100.0% Owner occupiedHouse owners and renters - White alone residents 702 87.5% Owner occupied100 12.5% Renter occupiedHouse owners and renters - Hispanic or Latino residents 277 50.9% Owner occupied267 49.1% Renter occupied
Language usage in Sunnyside
English speakers - Total 63.8% of residents of Sunnyside speak English at home.
29.8% of residents speak Spanish at home 956 74.2% Speak English very well333 25.8% Speak English less than very well6.5% of residents speak other language at home 164 58.8% Speak English very well115 41.2% Speak English less than very well
English speakers - Born in the United States 91.6% of residents of Sunnyside speak English at home.
6.5% of residents speak Spanish at home 36 92.3% Speak English very well3 7.7% Speak English less than very well1.5% of residents speak other language at home 9 100.0% Speak English less than very well
English speakers - Native, born elsewhere 14.9% of residents of Sunnyside speak English at home.
68.1% of residents speak Spanish at home 32 100.0% Speak English very well14.9% of residents speak other language at home 7 100.0% Speak English very well
English speakers - Foreign-born 4.9% of residents of Sunnyside speak English at home.
65.0% of residents speak Spanish at home 109 26.4% Speak English very well304 73.6% Speak English less than very well27.9% of residents speak other language at home 75 42.4% Speak English very well102 57.6% Speak English less than very well
White (Caucasian) - Speak only English Native:
81.4% (1,957)Foreign-born:
5.6% (14)
White (Caucasian) - Speak another language Native:
17.5% (420)Foreign-born:
91.1% (229)
Black or African American - Speak another language Native:
26.8% (61)Foreign-born:
92.5% (12)
Asian - Speak only English Native:
54.8% (95)Foreign-born:
4.6% (9)
Asian - Speak another language Native:
45.7% (79)Foreign-born:
94.8% (185)
Other race - Speak another language Native:
66.7% (260)Foreign-born:
99.8% (33)
Two or more races - Speak another language Native:
16.8% (65)Foreign-born:
100.0% (49)
White alone - Speak only English Native:
95.4% (1,628)Foreign-born:
82.5% (2)
Hispanic or Latino - Speak only English Native:
42.0% (644)Foreign-born:
3.8% (16)
Hispanic or Latino - Speak another language Native:
58.2% (893)Foreign-born:
95.7% (408)
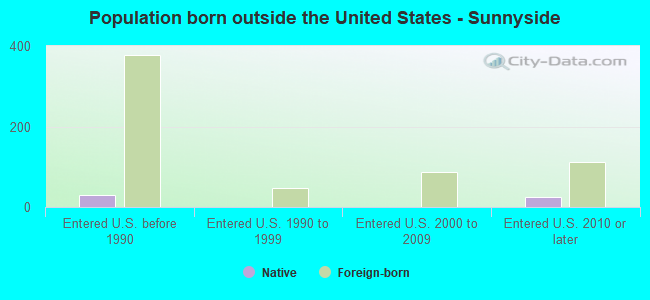
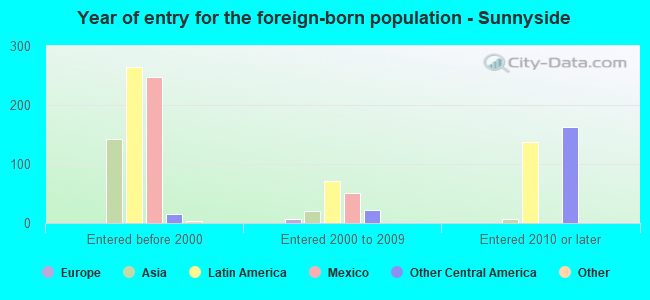
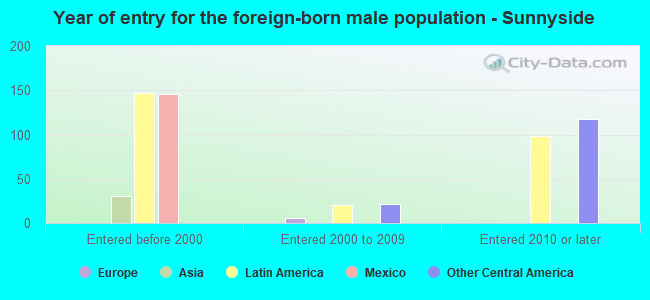
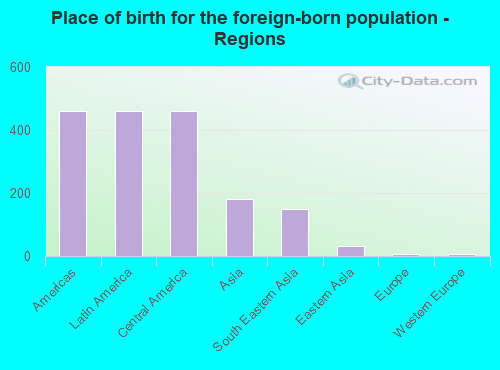
Foreign-born residents in Sunnyside
Marital status for residents in Sunnyside Marital status - White (Caucasian) population 15 years and over
Males 25.8% Never married65.6% Now married0.0% Separated2.4% Widowed6.2% DivorcedFemales 37.7% Never married50.0% Now married0.4% Separated3.8% Widowed8.1% DivorcedWomen who gave birth in the past 12 months Now married:
100.0% (27)Unmarried:
0.0% (0)
Women who did not give birth in the past 12 months Now married:
37.6% (234)Unmarried:
62.4% (388)
Marital status - Black or African American population 15 years and over
Males 48.1% Never married0.0% Now married0.0% Separated0.0% Widowed51.9% DivorcedFemales 84.3% Never married0.0% Now married0.0% Separated12.1% Widowed3.6% DivorcedWomen who did not give birth in the past 12 months Now married:
0.0% (0)Unmarried:
100.0% (106)
Marital status - Asian population 15 years and over
Males 61.1% Never married36.5% Now married2.4% Separated0.0% Widowed0.0% DivorcedFemales 5.0% Never married55.2% Now married1.7% Separated32.0% Widowed6.1% DivorcedWomen who gave birth in the past 12 months Now married:
100.0% (5)Unmarried:
0.0% (0)
Women who did not give birth in the past 12 months Now married:
74.1% (44)Unmarried:
25.9% (15)
Marital status - Native Hawaiian / Pacific Islander population 15 years and over
Males 0.0% Never married100.0% Now married0.0% Separated0.0% Widowed0.0% DivorcedFemales 0.0% Never married0.0% Now married0.0% Separated0.0% Widowed100.0% DivorcedMarital status - Other race population 15 years and over
Males 50.9% Never married49.1% Now married0.0% Separated0.0% Widowed0.0% DivorcedFemales 31.4% Never married59.9% Now married0.0% Separated0.0% Widowed8.8% DivorcedWomen who did not give birth in the past 12 months Now married:
51.7% (54)Unmarried:
48.3% (51)
Marital status - Two or more races population 15 years and over
Males 24.1% Never married75.9% Now married0.0% Separated0.0% Widowed0.0% DivorcedFemales 39.1% Never married60.9% Now married0.0% Separated0.0% Widowed0.0% DivorcedWomen who did not give birth in the past 12 months Now married:
60.9% (115)Unmarried:
39.1% (74)
Marital status - White alone, not Hispanic / Latino population 15 years and over
Males 13.6% Never married75.8% Now married0.0% Separated3.8% Widowed6.9% DivorcedFemales 29.7% Never married54.5% Now married0.6% Separated5.4% Widowed9.7% DivorcedWomen who gave birth in the past 12 months Now married:
100.0% (10)Unmarried:
0.0% (0)
Women who did not give birth in the past 12 months Now married:
44.1% (160)Unmarried:
55.9% (202)
Marital status - Hispanic or Latino population 15 years and over
Males 47.0% Never married47.7% Now married0.0% Separated0.0% Widowed5.4% DivorcedFemales 47.2% Never married44.4% Now married0.0% Separated3.0% Widowed5.4% DivorcedWomen who gave birth in the past 12 months Now married:
100.0% (25)Unmarried:
0.0% (0)
Women who did not give birth in the past 12 months Now married:
35.5% (208)Unmarried:
64.5% (377)
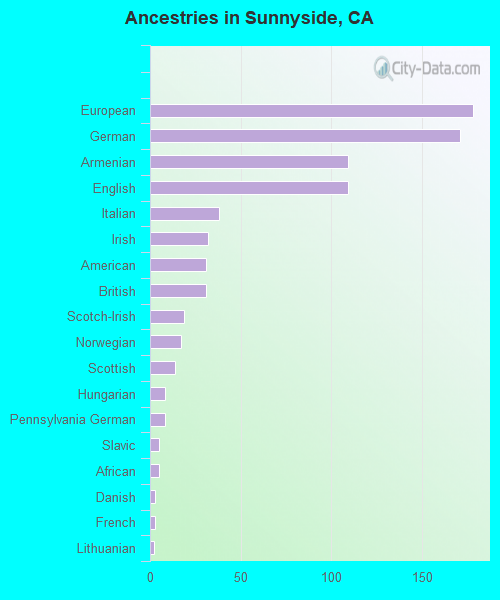
Ancestries in Sunnyside
178 7.2% European171 7.0% German109 4.4% Armenian109 4.4% English38 1.5% Italian32 1.3% Irish31 1.3% American31 1.3% British19 0.8% Scotch-Irish17 0.7% Norwegian14 0.6% Scottish8 0.3% Hungarian8 0.3% Pennsylvania German5 0.2% Slavic5 0.2% African3 0.1% Danish3 0.1% French2 0.08% Lithuanian
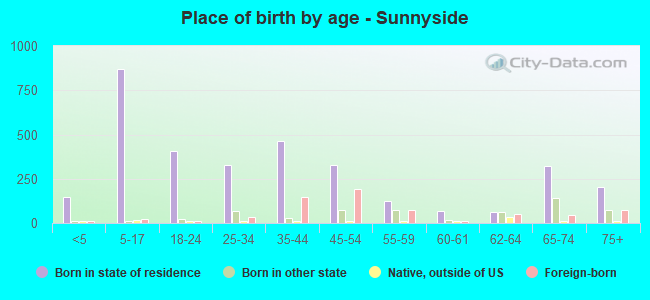
Children Nativity (place of birth) in Sunnyside
Children under 6 years - Living with two parents Both parents native 117 100.0% NativeOne native, one foreign-born parent 92 100.0% NativeChildren under 6 years - Living with one parent Native parent 28 100.0% NativeChildren 6 to 17 years - Living with two parents Both parents native 340 100.0% NativeBoth parents foreign-born 28 100.0% NativeOne native, one foreign-born parent 120 100.0% NativeChildren 6 to 17 years - Living with one parent Native parent 139 100.0% NativeForeign-born parent 91 56.3% Native70 43.7% Foreign-born
Grandparents responsible for own grandchildren in Sunnyside
Grandparents (30 to 59 years) White / Caucasian 3 100.0% Responsible for grandchildrenAsian 9 78.3% Responsible for grandchildren3 21.7% Not responsible for grandchildrenHispanic or Latino 4 100.0% Responsible for grandchildrenGrandparents (60 years and over) White / Caucasian 42 50.2% Responsible for grandchildren42 49.8% Not responsible for grandchildrenHispanic or Latino 39 100.0% Responsible for grandchildren