Races in The Acreage, Florida (FL) Detailed Stats
Data:
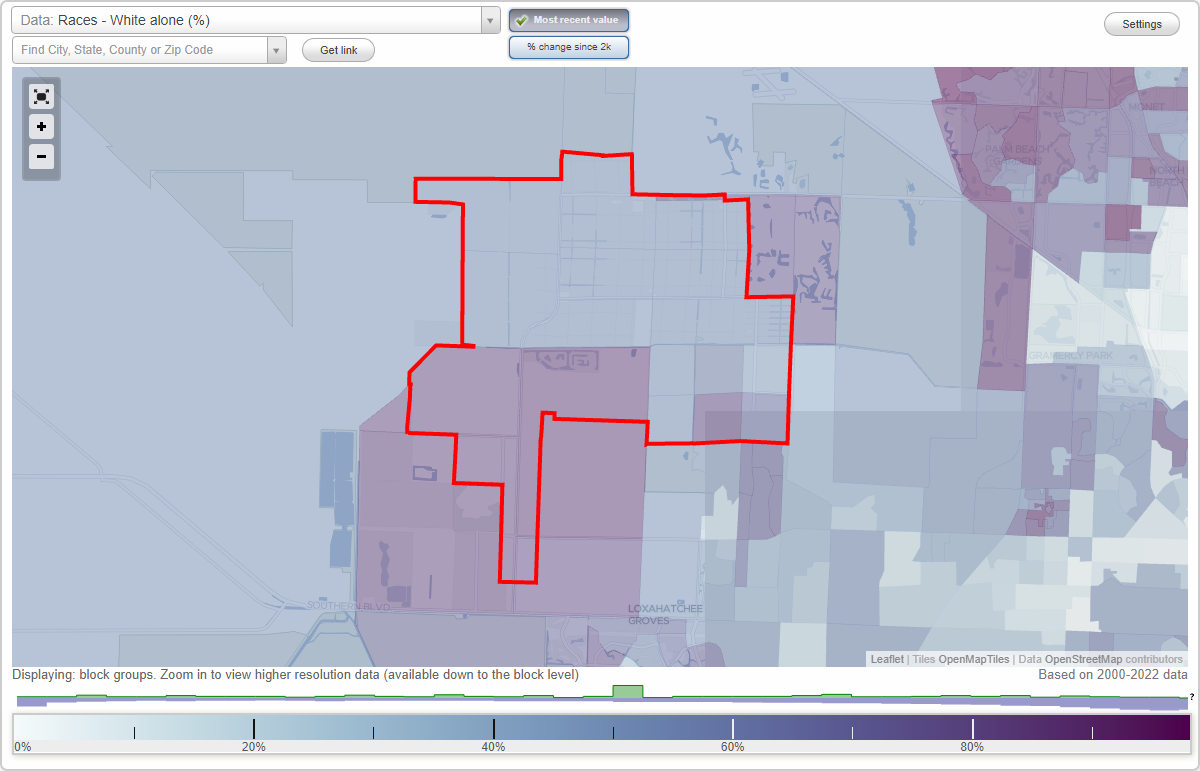
Races - White alone (%)
Races - White alone (% change since 2000)
Races - Black alone (%)
Races - Black alone (% change since 2000)
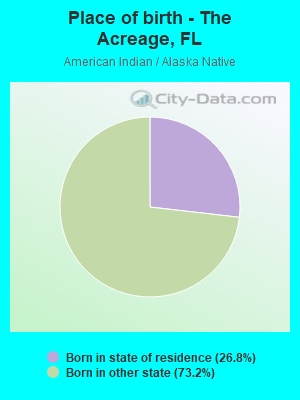
Races - American Indian alone (%)
Races - American Indian alone (% change since 2000)
Races - Asian alone (%)
Races - Asian alone (% change since 2000)
Races - Hispanic (%)
Races - Hispanic (% change since 2000)
Races - Native Hawaiian and Other Pacific Islander alone (%)
Races - Native Hawaiian and Other Pacific Islander alone (% change since 2000)
Races - Two or more races(%)
Races - Two or more races(% change since 2000)
Races - Other race alone (%)
Races - Other race alone (% change since 2000)
Racial diversity
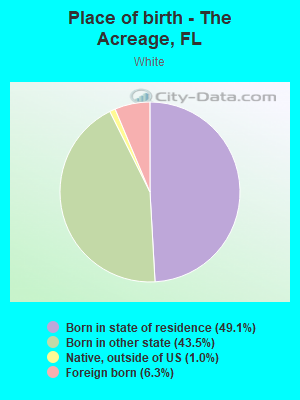
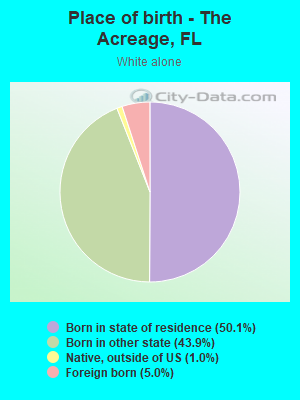
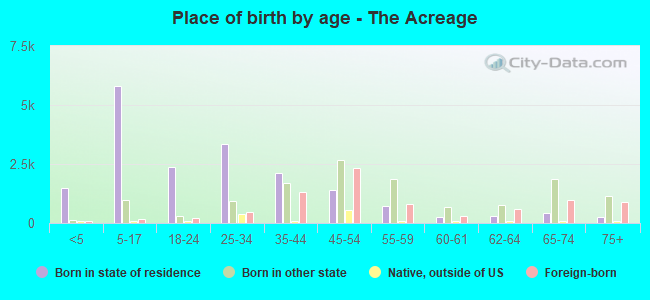
Place of birth - Born in state of residence (%)
Place of birth - Born in state of residence (%) - White
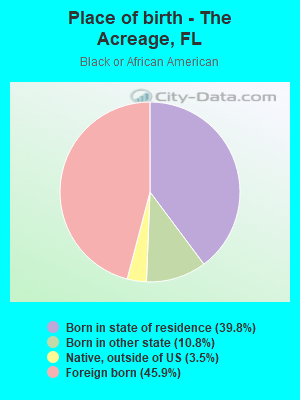
Place of birth - Born in state of residence (%) - Black or African American
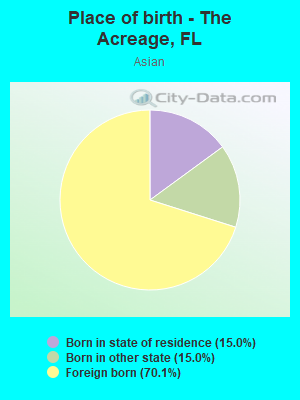
Place of birth - Born in state of residence (%) - Asian
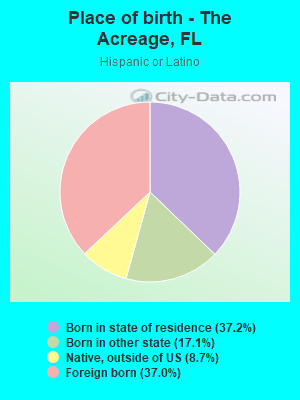
Place of birth - Born in state of residence (%) - Hispanic or Latino
Place of birth - Born in state of residence (%) - American Indian and Alaska Native
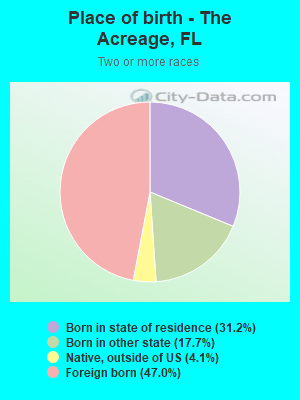
Place of birth - Born in state of residence (%) - Multirace
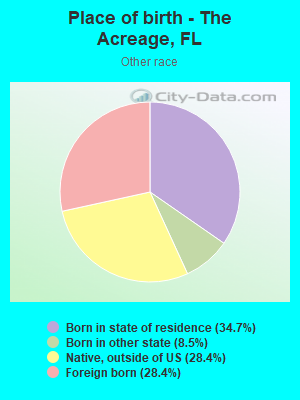
Place of birth - Born in state of residence (%) - Other Race
Place of birth - Born in other state (%)
Place of birth - Born in other state (%) - White
Place of birth - Born in other state (%) - Black or African American
Place of birth - Born in other state (%) - Asian
Place of birth - Born in other state (%) - Hispanic or Latino
Place of birth - Born in other state (%) - American Indian and Alaska Native
Place of birth - Born in other state (%) - Multirace
Place of birth - Born in other state (%) - Other Race
Place of birth - Native, outside of US (%)
Place of birth - Native, outside of US (%) - White
Place of birth - Native, outside of US (%) - Black or African American
Place of birth - Native, outside of US (%) - Asian
Place of birth - Native, outside of US (%) - Hispanic or Latino
Place of birth - Native, outside of US (%) - American Indian and Alaska Native
Place of birth - Native, outside of US (%) - Multirace
Place of birth - Native, outside of US (%) - Other Race
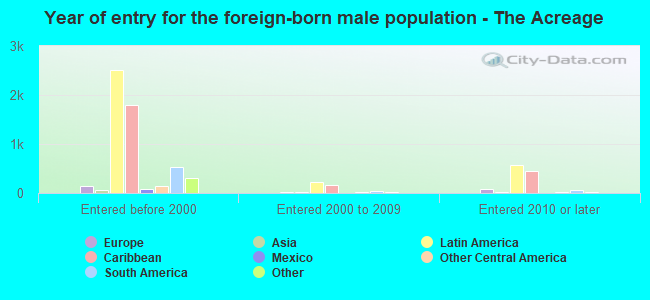
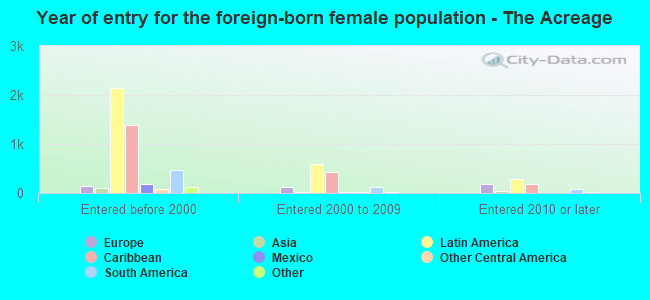
Place of birth - Foreign born (%)
Place of birth - Foreign born (%) - White
Place of birth - Foreign born (%) - Black or African American
Place of birth - Foreign born (%) - Asian
Place of birth - Foreign born (%) - Hispanic or Latino
Place of birth - Foreign born (%) - American Indian and Alaska Native
Place of birth - Foreign born (%) - Multirace
Place of birth - Foreign born (%) - Other Race
Residents speaking English at home (%)
Residents speaking English at home - Born in the United States (%)
Residents speaking English at home - Native, born elsewhere (%)
Residents speaking English at home - Foreign born (%)
Residents speaking Spanish at home (%)
Residents speaking Spanish at home - Born in the United States (%)
Residents speaking Spanish at home - Native, born elsewhere (%)
Residents speaking Spanish at home - Foreign born (%)
Residents speaking other language at home (%)
Residents speaking other language at home - Born in the United States (%)
Residents speaking other language at home - Native, born elsewhere (%)
Residents speaking other language at home - Foreign born (%)
Marital status - Never married (%)
Marital status - Now married (%)
Marital status - Separated (%)
Marital status - Widowed (%)
Marital status - Divorced (%)
Ancestries Reported - Arab (%)
Ancestries Reported - Czech (%)
Ancestries Reported - Danish (%)
Ancestries Reported - Dutch (%)
Ancestries Reported - English (%)
Ancestries Reported - French (%)
Ancestries Reported - French Canadian (%)
Ancestries Reported - German (%)
Ancestries Reported - Greek (%)
Ancestries Reported - Hungarian (%)
Ancestries Reported - Irish (%)
Ancestries Reported - Italian (%)
Ancestries Reported - Lithuanian (%)
Ancestries Reported - Norwegian (%)
Ancestries Reported - Polish (%)
Ancestries Reported - Portuguese (%)
Ancestries Reported - Russian (%)
Ancestries Reported - Scotch-Irish (%)
Ancestries Reported - Scottish (%)
Ancestries Reported - Slovak (%)
Ancestries Reported - Subsaharan African (%)
Ancestries Reported - Swedish (%)
Ancestries Reported - Swiss (%)
Ancestries Reported - Ukrainian (%)
Ancestries Reported - United States (%)
Ancestries Reported - Welsh (%)
Ancestries Reported - West Indian (%)
Ancestries Reported - Other (%)
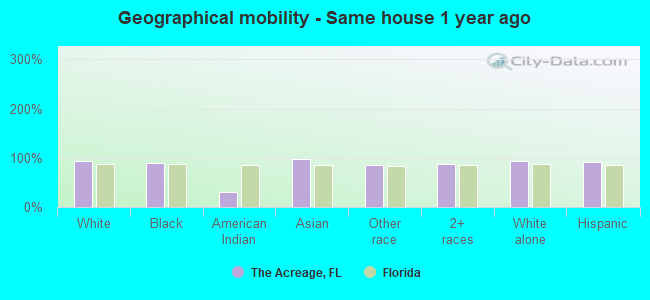
Geographical mobility - Same house 1 year ago (%)
Geographical mobility - Same house 1 year ago (%) - White
Geographical mobility - Same house 1 year ago (%) - Black or African American
Geographical mobility - Same house 1 year ago (%) - Asian
Geographical mobility - Same house 1 year ago (%) - Hispanic or Latino
Geographical mobility - Same house 1 year ago (%) - American Indian and Alaska Native
Geographical mobility - Same house 1 year ago (%) - Multirace
Geographical mobility - Same house 1 year ago (%) - Other Race
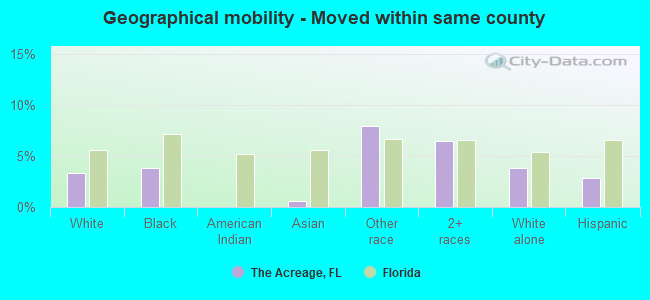
Geographical mobility - Moved within same county (%)
Geographical mobility - Moved within same county (%) - White
Geographical mobility - Moved within same county (%) - Black or African American
Geographical mobility - Moved within same county (%) - Asian
Geographical mobility - Moved within same county (%) - Hispanic or Latino
Geographical mobility - Moved within same county (%) - American Indian and Alaska Native
Geographical mobility - Moved within same county (%) - Multirace
Geographical mobility - Moved within same county (%) - Other Race
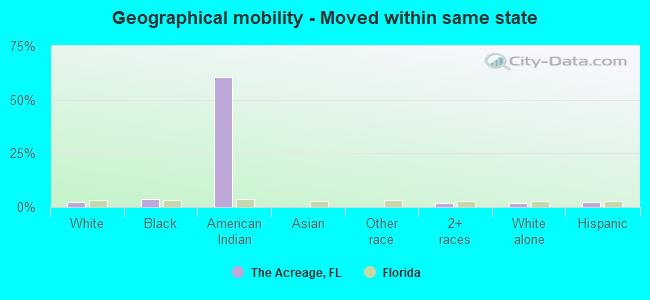
Geographical mobility - Moved from different county within same state (%)
Geographical mobility - Moved from different county within same state (%) - White
Geographical mobility - Moved from different county within same state (%) - Black or African American
Geographical mobility - Moved from different county within same state (%) - Asian
Geographical mobility - Moved from different county within same state (%) - Hispanic or Latino
Geographical mobility - Moved from different county within same state (%) - American Indian and Alaska Native
Geographical mobility - Moved from different county within same state (%) - Multirace
Geographical mobility - Moved from different county within same state (%) - Other Race
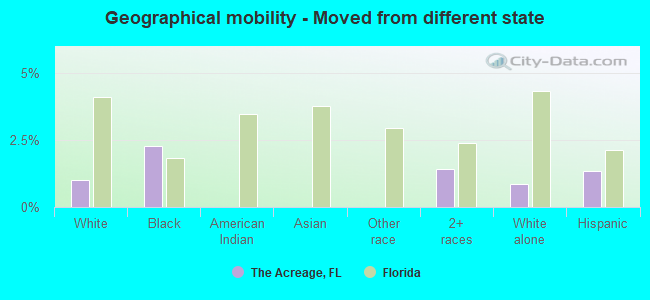
Geographical mobility - Moved from different state (%)
Geographical mobility - Moved from different state (%) - White
Geographical mobility - Moved from different state (%) - Black or African American
Geographical mobility - Moved from different state (%) - Asian
Geographical mobility - Moved from different state (%) - Hispanic or Latino
Geographical mobility - Moved from different state (%) - American Indian and Alaska Native
Geographical mobility - Moved from different state (%) - Multirace
Geographical mobility - Moved from different state (%) - Other Race
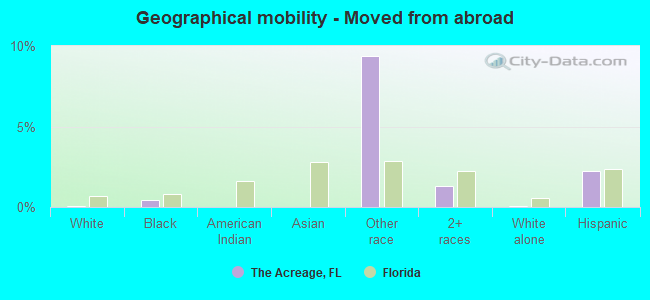
Geographical mobility - Moved from abroad (%)
Geographical mobility - Moved from abroad (%) - White
Geographical mobility - Moved from abroad (%) - Black or African American
Geographical mobility - Moved from abroad (%) - Asian
Geographical mobility - Moved from abroad (%) - Hispanic or Latino
Geographical mobility - Moved from abroad (%) - American Indian and Alaska Native
Geographical mobility - Moved from abroad (%) - Multirace
Geographical mobility - Moved from abroad (%) - Other Race
Place of birth for the foreign-born population - Ireland (%)
Place of birth for the foreign-born population - Denmark (%)
Place of birth for the foreign-born population - Norway (%)
Place of birth for the foreign-born population - Sweden (%)
Place of birth for the foreign-born population - United Kingdom (%)
Place of birth for the foreign-born population - England (%)
Place of birth for the foreign-born population - Scotland (%)
Place of birth for the foreign-born population - Other Northern Europe (%)
Place of birth for the foreign-born population - Austria (%)
Place of birth for the foreign-born population - Belgium (%)
Place of birth for the foreign-born population - France (%)
Place of birth for the foreign-born population - Germany (%)
Place of birth for the foreign-born population - Netherlands (%)
Place of birth for the foreign-born population - Switzerland (%)
Place of birth for the foreign-born population - Other Western Europe (%)
Place of birth for the foreign-born population - Greece (%)
Place of birth for the foreign-born population - Italy (%)
Place of birth for the foreign-born population - Portugal (%)
Place of birth for the foreign-born population - Spain (%)
Place of birth for the foreign-born population - Other Southern Europe (%)
Place of birth for the foreign-born population - Albania (%)
Place of birth for the foreign-born population - Belarus (%)
Place of birth for the foreign-born population - Bosnia and Herzegovina (%)
Place of birth for the foreign-born population - Bulgaria (%)
Place of birth for the foreign-born population - Croatia (%)
Place of birth for the foreign-born population - Czechoslovakia (%)
Place of birth for the foreign-born population - Hungary (%)
Place of birth for the foreign-born population - Latvia (%)
Place of birth for the foreign-born population - Lithuania (%)
Place of birth for the foreign-born population - North Macedonia (Macedonia) (%)
Place of birth for the foreign-born population - Moldova (%)
Place of birth for the foreign-born population - Poland (%)
Place of birth for the foreign-born population - Romania (%)
Place of birth for the foreign-born population - Russia (%)
Place of birth for the foreign-born population - Serbia (%)
Place of birth for the foreign-born population - Ukraine (%)
Place of birth for the foreign-born population - Other Eastern Europe (%)
Place of birth for the foreign-born population - China (%)
Place of birth for the foreign-born population - Hong Kong (%)
Place of birth for the foreign-born population - Taiwan (%)
Place of birth for the foreign-born population - Japan (%)
Place of birth for the foreign-born population - Korea (%)
Place of birth for the foreign-born population - Other Eastern Asia (%)
Place of birth for the foreign-born population - Afghanistan (%)
Place of birth for the foreign-born population - Bangladesh (%)
Place of birth for the foreign-born population - India (%)
Place of birth for the foreign-born population - Iran (%)
Place of birth for the foreign-born population - Kazakhstan (%)
Place of birth for the foreign-born population - Nepal (%)
Place of birth for the foreign-born population - Pakistan (%)
Place of birth for the foreign-born population - Sri Lanka (%)
Place of birth for the foreign-born population - Uzbekistan (%)
Place of birth for the foreign-born population - Other South Central Asia (%)
Place of birth for the foreign-born population - Burma (%)
Place of birth for the foreign-born population - Cambodia (%)
Place of birth for the foreign-born population - Indonesia (%)
Place of birth for the foreign-born population - Laos (%)
Place of birth for the foreign-born population - Malaysia (%)
Place of birth for the foreign-born population - Philippines (%)
Place of birth for the foreign-born population - Singapore (%)
Place of birth for the foreign-born population - Thailand (%)
Place of birth for the foreign-born population - Vietnam (%)
Place of birth for the foreign-born population - Other South Eastern Asia (%)
Place of birth for the foreign-born population - Armenia (%)
Place of birth for the foreign-born population - Iraq (%)
Place of birth for the foreign-born population - Israel (%)
Place of birth for the foreign-born population - Jordan (%)
Place of birth for the foreign-born population - Kuwait (%)
Place of birth for the foreign-born population - Lebanon (%)
Place of birth for the foreign-born population - Saudi Arabia (%)
Place of birth for the foreign-born population - Syria (%)
Place of birth for the foreign-born population - Turkey (%)
Place of birth for the foreign-born population - Yemen (%)
Place of birth for the foreign-born population - Other Western Asia (%)
Place of birth for the foreign-born population - Eritrea (%)
Place of birth for the foreign-born population - Ethiopia (%)
Place of birth for the foreign-born population - Kenya (%)
Place of birth for the foreign-born population - Somalia (%)
Place of birth for the foreign-born population - Uganda (%)
Place of birth for the foreign-born population - Zimbabwe (%)
Place of birth for the foreign-born population - Other Eastern Africa (%)
Place of birth for the foreign-born population - Cameroon (%)
Place of birth for the foreign-born population - Congo (%)
Place of birth for the foreign-born population - Democratic Republic of Congo (Zaire) (%)
Place of birth for the foreign-born population - Other Middle Africa (%)
Place of birth for the foreign-born population - Egypt (%)
Place of birth for the foreign-born population - Morocco (%)
Place of birth for the foreign-born population - Sudan (%)
Place of birth for the foreign-born population - Other Northern Africa (%)
Place of birth for the foreign-born population - South Africa (%)
Place of birth for the foreign-born population - Other Southern Africa (%)
Place of birth for the foreign-born population - Cabo Verde (%)
Place of birth for the foreign-born population - Ghana (%)
Place of birth for the foreign-born population - Liberia (%)
Place of birth for the foreign-born population - Nigeria (%)
Place of birth for the foreign-born population - Senegal (%)
Place of birth for the foreign-born population - Sierra Leone (%)
Place of birth for the foreign-born population - Other Western Africa (%)
Place of birth for the foreign-born population - Australia (%)
Place of birth for the foreign-born population - New Zealand (%)
Place of birth for the foreign-born population - Fiji (%)
Place of birth for the foreign-born population - Micronesia (%)
Place of birth for the foreign-born population - Bahamas (%)
Place of birth for the foreign-born population - Barbados (%)
Place of birth for the foreign-born population - Cuba (%)
Place of birth for the foreign-born population - Dominica (%)
Place of birth for the foreign-born population - Dominican Republic (%)
Place of birth for the foreign-born population - Grenada (%)
Place of birth for the foreign-born population - Haiti (%)
Place of birth for the foreign-born population - Jamaica (%)
Place of birth for the foreign-born population - St. Vincent and the Grenadines (%)
Place of birth for the foreign-born population - Trinidad and Tobago (%)
Place of birth for the foreign-born population - West Indies (%)
Place of birth for the foreign-born population - Other Caribbean (%)
Place of birth for the foreign-born population - Belize (%)
Place of birth for the foreign-born population - Costa Rica (%)
Place of birth for the foreign-born population - El Salvador (%)
Place of birth for the foreign-born population - Guatemala (%)
Place of birth for the foreign-born population - Honduras (%)
Place of birth for the foreign-born population - Mexico (%)
Place of birth for the foreign-born population - Nicaragua (%)
Place of birth for the foreign-born population - Panama (%)
Place of birth for the foreign-born population - Other Central America (%)
Place of birth for the foreign-born population - Argentina (%)
Place of birth for the foreign-born population - Bolivia (%)
Place of birth for the foreign-born population - Brazil (%)
Place of birth for the foreign-born population - Chile (%)
Place of birth for the foreign-born population - Colombia (%)
Place of birth for the foreign-born population - Ecuador (%)
Place of birth for the foreign-born population - Guyana (%)
Place of birth for the foreign-born population - Peru (%)
Place of birth for the foreign-born population - Uruguay (%)
Place of birth for the foreign-born population - Venezuela (%)
Place of birth for the foreign-born population - Other South America (%)
Place of birth for the foreign-born population - Canada (%)
Place of birth for the foreign-born population - Other Northern America (%)
Place of birth for the foreign-born population - Other (%)
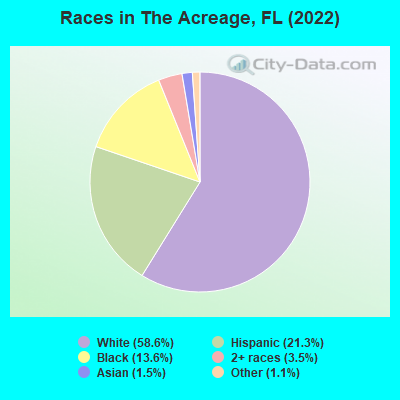
According to 2022 data, the most numerous races in The Acreage, FL are White alone (23,902 residents), Hispanic (8,699 residents), and Black alone (5,531 residents). 75.5% of The Acreage residents speak English at home.
Race distribution in The Acreage 23,902 58.6% White alone 8,699 21.3% Hispanic 5,531 13.6% Black alone 1,432 3.5% Two or more races 615 1.5% Asian alone 458 1.1% Other race alone 29 0.07% American Indian alone
2000 2022
10,458,509 65.4% White alone 2,682,715 16.8% Hispanic 2,264,268 14.2% Black alone 261,693 1.6% Asian alone 236,954 1.5% Two or more races 42,358 0.3% American Indian alone 28,994 0.2% Other race alone 6,887 0.04% Native Hawaiian and Other
11,309,403 50.8% White alone 6,025,039 27.1% Hispanic 3,241,015 14.6% Black alone 861,630 3.9% Two or more races 623,692 2.8% Asian alone 152,054 0.7% Other race alone 22,504 0.1% American Indian alone 9,486 0.04% Native Hawaiian and Other
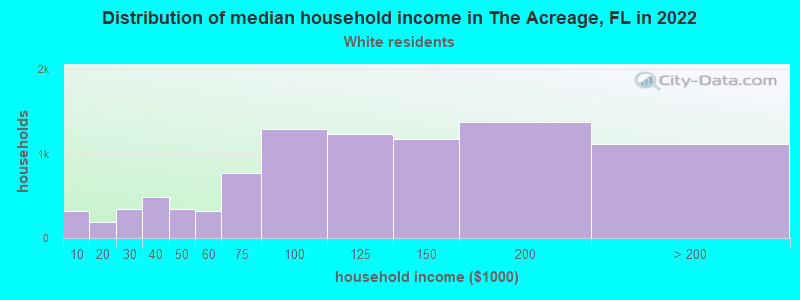
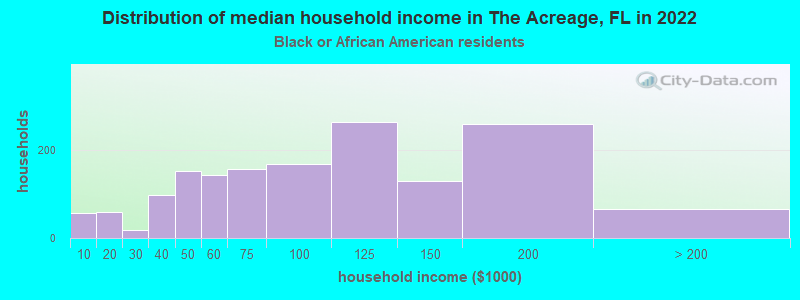
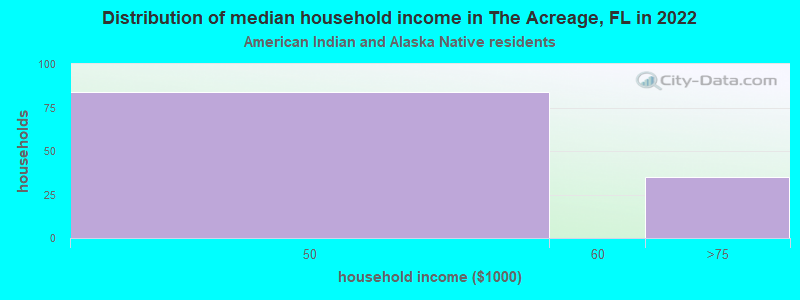
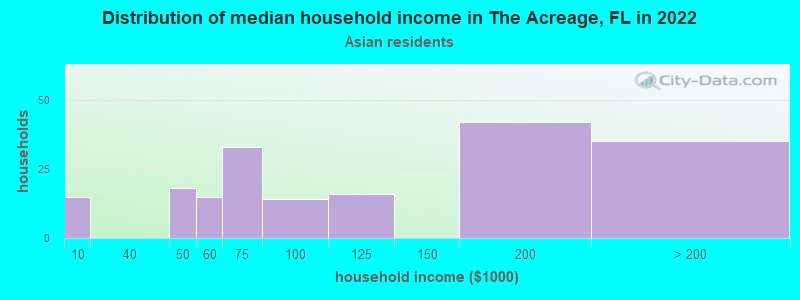
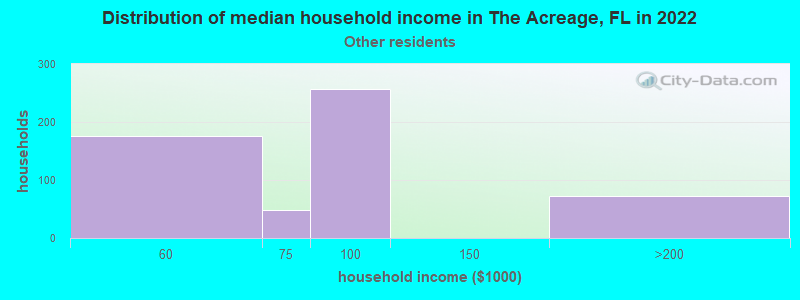
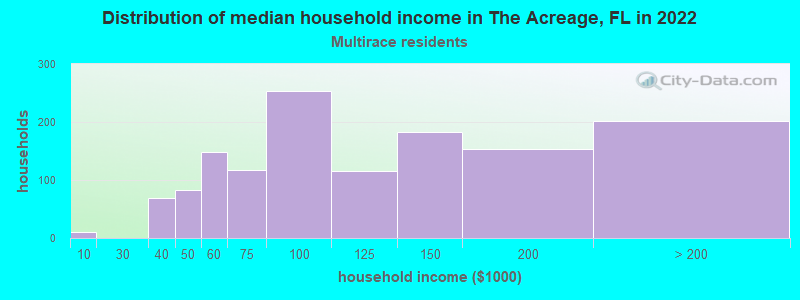
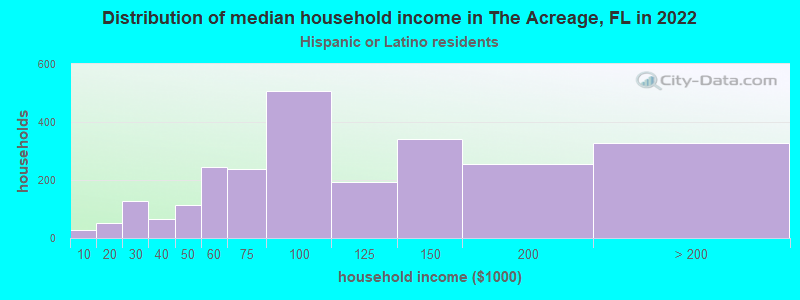
Income and house value in The Acreage Median household income in 2022 $104,910 White non-Hispanic householders$92,281 Black householders$92,893 Asian householders$89,834 Some other race householders$93,613 Two or more races householders$93,667 Hispanic or Latino race householders
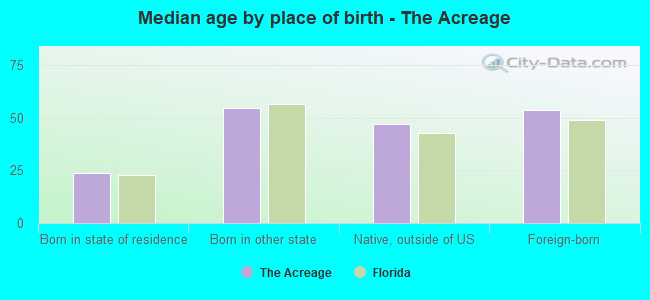
Median age by race in The Acreage
44.4 Median age for White residents44.0 44.6 42.5 Median age for Black or African American residents42.0 41.8 -724,168,912.1 Median age for American Indian / Alaska Native residents-806,112,702.2 -660,098,521.5 58.3 Median age for Asian residents61.5 54.5 -674,285,713.6 Median age for Native Hawaiian / Pacific Islander residents-674,264,006.9 -672,397,325.0 40.2 Median age for Other race residents45.7 37.2 39.9 Median age for Two or more races residents39.4 39.9 44.3 Median age for White alone residents43.6 45.3 39.5 Median age for Hispanic or Latino residents39.8 39.4
Owner/renter occupied households by race in The Acreage
House owners and renters - White residents 8,229 90.4% Owner occupied873 9.6% Renter occupiedHouse owners and renters - Black or African American residents 1,597 98.3% Owner occupied27 1.7% Renter occupiedHouse owners and renters - American Indian / Alaska Native residents 57 100.0% Owner occupiedHouse owners and renters - Asian residents 190 93.9% Owner occupied12 6.1% Renter occupiedHouse owners and renters - Other race residents 465 96.8% Owner occupied16 3.2% Renter occupiedHouse owners and renters - Two or more races residents 1,286 93.2% Owner occupied94 6.8% Renter occupiedHouse owners and renters - White alone residents 7,468 88.7% Owner occupied955 11.3% Renter occupiedHouse owners and renters - Hispanic or Latino residents 2,370 95.7% Owner occupied106 4.3% Renter occupied
Language usage in The Acreage
English speakers - Total 75.5% of residents of The Acreage speak English at home.
14.5% of residents speak Spanish at home 3,755 66.1% Speak English very well1,925 33.9% Speak English less than very well9.6% of residents speak other language at home 2,644 70.6% Speak English very well1,099 29.4% Speak English less than very well
English speakers - Born in the United States 90.3% of residents of The Acreage speak English at home.
6.8% of residents speak Spanish at home 783 88.0% Speak English very well107 12.0% Speak English less than very well2.8% of residents speak other language at home 355 96.2% Speak English very well14 3.8% Speak English less than very well
English speakers - Native, born elsewhere 31.9% of residents of The Acreage speak English at home.
53.8% of residents speak Spanish at home 384 58.6% Speak English very well271 41.4% Speak English less than very well10.7% of residents speak other language at home 130 100.0% Speak English very well
English speakers - Foreign-born 29.2% of residents of The Acreage speak English at home.
36.5% of residents speak Spanish at home 1,571 54.0% Speak English very well1,336 46.0% Speak English less than very well33.6% of residents speak other language at home 1,662 62.2% Speak English very well1,012 37.8% Speak English less than very well
White (Caucasian) - Speak only English Native:
95.1% (22,238)Foreign-born:
24.6% (404)
White (Caucasian) - Speak another language Native:
5.5% (1,279)Foreign-born:
71.2% (1,167)
Black or African American - Speak only English Native:
83.2% (2,459)Foreign-born:
48.9% (1,252)
Black or African American - Speak another language Native:
16.8% (497)Foreign-born:
49.6% (1,272)
Asian - Speak only English Native:
78.3% (132)Foreign-born:
49.6% (229)
Asian - Speak another language Native:
24.8% (42)Foreign-born:
51.2% (236)
Other race - Speak only English Native:
54.7% (880)Foreign-born:
10.7% (71)
Other race - Speak another language Native:
46.5% (748)Foreign-born:
89.1% (595)
Two or more races - Speak only English Native:
59.9% (1,562)Foreign-born:
17.3% (429)
Two or more races - Speak another language Native:
39.6% (1,032)Foreign-born:
80.3% (1,989)
White alone - Speak only English Native:
97.1% (21,261)Foreign-born:
24.0% (289)
White alone - Speak another language Native:
3.1% (669)Foreign-born:
74.1% (892)
Hispanic or Latino - Speak only English Native:
47.8% (2,365)Foreign-born:
8.1% (261)
Hispanic or Latino - Speak another language Native:
52.6% (2,603)Foreign-born:
91.7% (2,945)
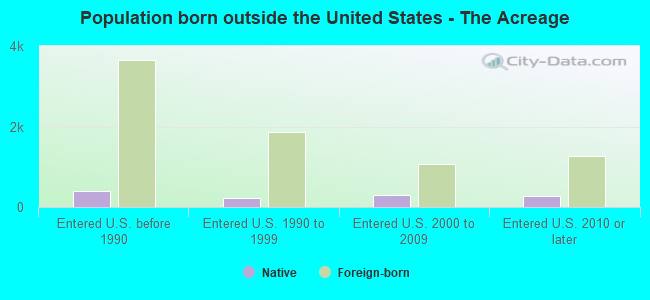
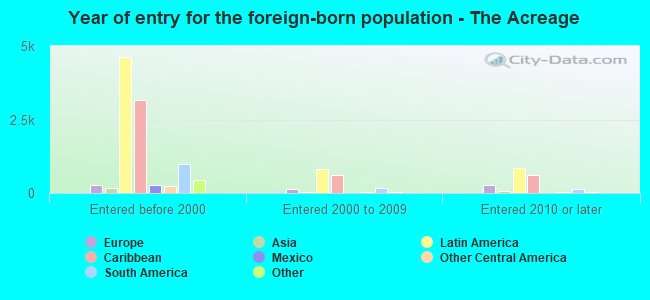
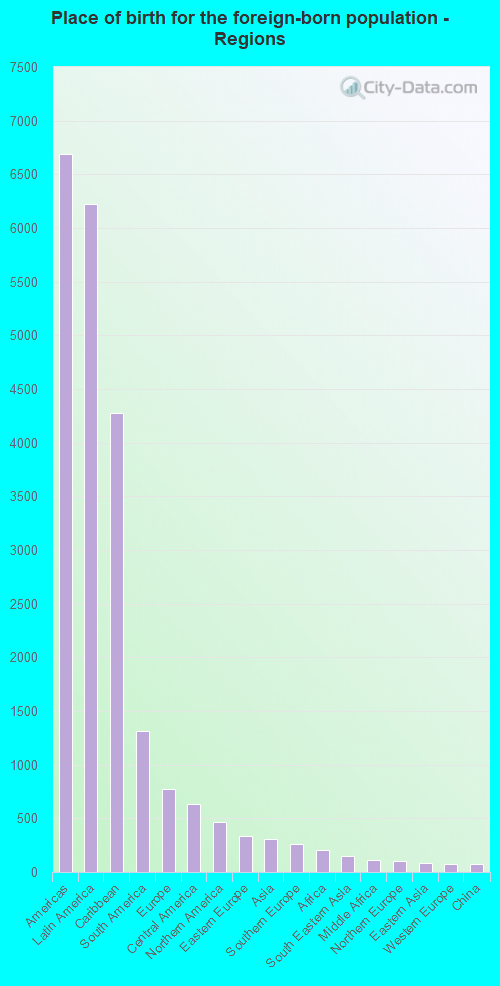
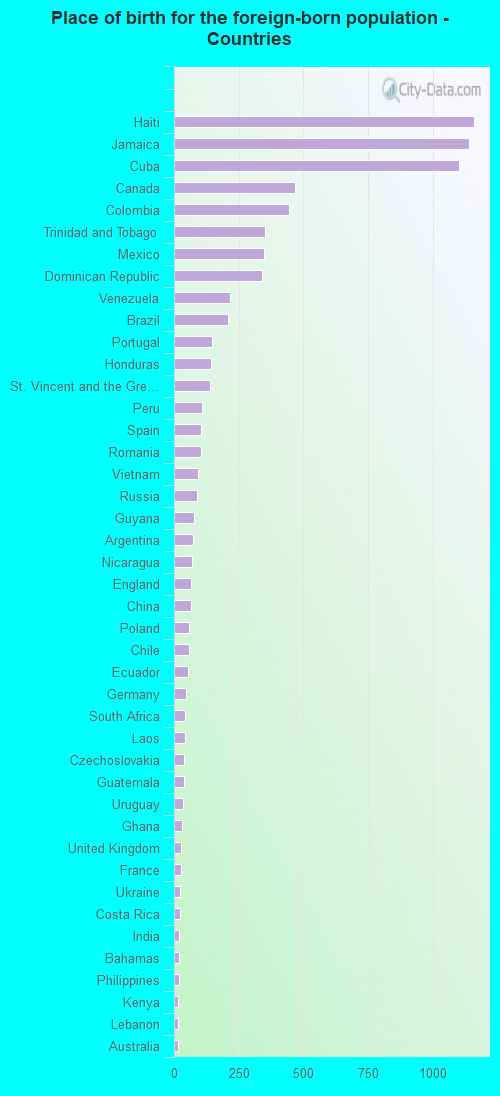
Foreign-born residents in The Acreage
Marital status for residents in The Acreage Marital status - White (Caucasian) population 15 years and over
Males 35.1% Never married54.2% Now married0.2% Separated2.0% Widowed8.5% DivorcedFemales 24.9% Never married58.2% Now married0.7% Separated6.7% Widowed9.5% DivorcedWomen who gave birth in the past 12 months Now married:
94.9% (261)Unmarried:
5.1% (14)
Women who did not give birth in the past 12 months Now married:
52.5% (2,626)Unmarried:
47.5% (2,379)
Marital status - Black or African American population 15 years and over
Males 31.2% Never married57.3% Now married0.0% Separated1.5% Widowed9.9% DivorcedFemales 21.3% Never married66.3% Now married0.5% Separated0.5% Widowed11.4% DivorcedWomen who gave birth in the past 12 months Now married:
100.0% (118)Unmarried:
0.0% (0)
Women who did not give birth in the past 12 months Now married:
58.3% (636)Unmarried:
41.7% (455)
Marital status - Asian population 15 years and over
Males 31.7% Never married57.2% Now married0.0% Separated0.3% Widowed10.8% DivorcedFemales 16.1% Never married60.5% Now married0.0% Separated21.0% Widowed2.4% DivorcedWomen who gave birth in the past 12 months Now married:
100.0% (23)Unmarried:
0.0% (0)
Women who did not give birth in the past 12 months Now married:
52.3% (46)Unmarried:
47.7% (42)
Marital status - Other race population 15 years and over
Males 51.0% Never married41.3% Now married0.0% Separated2.6% Widowed5.1% DivorcedFemales 34.0% Never married59.6% Now married0.0% Separated1.9% Widowed4.5% DivorcedWomen who gave birth in the past 12 months Now married:
100.0% (8)Unmarried:
0.0% (0)
Women who did not give birth in the past 12 months Now married:
42.1% (263)Unmarried:
57.9% (361)
Marital status - Two or more races population 15 years and over
Males 25.3% Never married62.1% Now married0.0% Separated4.6% Widowed8.0% DivorcedFemales 36.2% Never married51.0% Now married1.9% Separated1.2% Widowed9.6% DivorcedWomen who gave birth in the past 12 months Now married:
86.1% (43)Unmarried:
13.9% (7)
Women who did not give birth in the past 12 months Now married:
45.5% (578)Unmarried:
54.5% (692)
Marital status - White alone, not Hispanic / Latino population 15 years and over
Males 35.7% Never married53.4% Now married0.1% Separated2.3% Widowed8.5% DivorcedFemales 24.1% Never married58.3% Now married0.8% Separated6.6% Widowed10.2% DivorcedWomen who gave birth in the past 12 months Now married:
100.0% (252)Unmarried:
0.0% (0)
Women who did not give birth in the past 12 months Now married:
52.2% (2,520)Unmarried:
47.8% (2,308)
Marital status - Hispanic or Latino population 15 years and over
Males 32.9% Never married56.4% Now married0.4% Separated2.1% Widowed8.1% DivorcedFemales 27.0% Never married60.1% Now married0.9% Separated4.1% Widowed7.9% DivorcedWomen who gave birth in the past 12 months Now married:
80.4% (93)Unmarried:
19.6% (23)
Women who did not give birth in the past 12 months Now married:
54.3% (1,071)Unmarried:
45.7% (902)
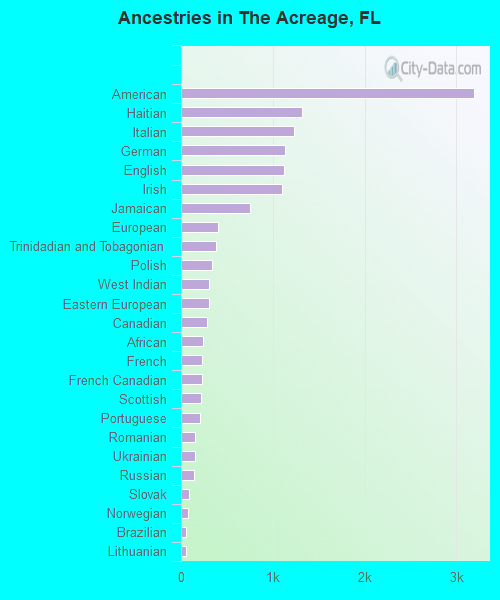
Ancestries in The Acreage
3,196 15.8% American1,313 6.5% Haitian1,233 6.1% Italian1,131 5.6% German1,117 5.5% English1,101 5.5% Irish750 3.7% Jamaican400 2.0% European385 1.9% Trinidadian and Tobagonian334 1.7% Polish306 1.5% West Indian304 1.5% Eastern European287 1.4% Canadian239 1.2% African230 1.1% French224 1.1% French Canadian217 1.1% Scottish202 1.0% Portuguese156 0.8% Romanian150 0.7% Ukrainian147 0.7% Russian82 0.4% Slovak73 0.4% Norwegian59 0.3% Brazilian59 0.3% Lithuanian56 0.3% South African52 0.3% Czech51 0.3% Dutch41 0.2% British33 0.2% Hungarian31 0.2% Guyanese27 0.1% Scotch-Irish26 0.1% Croatian24 0.1% Ghanaian16 0.08% Lebanese16 0.08% Icelander16 0.08% Swiss15 0.07% Greek12 0.06% Austrian10 0.05% Scandinavian10 0.05% Welsh6 0.03% Israeli5 0.02% Australian4 0.02% Northern European
Geographical mobility in The Acreage Same house 1 year ago 23,685 93.7% White (Caucasian)4,984 89.3% Black or African American32 30.4% American Indian / Alaska Native632 97.3% Asian1,972 84.5% Other race4,612 88.0% Two or more races22,104 93.2% White alone, not Hispanic / Latino7,840 90.7% Hispanic or LatinoMoved within same county 853 3.4% White / Caucasian212 3.8% Black or African American4 0.6% Asian186 8.0% Other race341 6.5% Two or more races915 3.9% White alone, not Hispanic / Latino242 2.8% Hispanic or LatinoMoved within same state 552 2.2% White / Caucasian205 3.7% Black or African American63 60.7% American Indian / Alaska Native1 0.2% Asian86 1.6% Two or more races489 2.1% White alone, not Hispanic / Latino203 2.3% Hispanic or LatinoMoved from different state 254 1.0% White / Caucasian126 2.3% Black or African American74 1.4% Two or more races202 0.9% White alone, not Hispanic / Latino114 1.3% Hispanic or LatinoMoved from abroad 17 0.1% White25 0.5% Black or African American218 9.4% Other race69 1.3% Two or more races21 0.1% White alone, not Hispanic / Latino191 2.2% Hispanic or Latino
Children Nativity (place of birth) in The Acreage
Children under 6 years - Living with two parents Both parents native 1,332 100.0% NativeBoth parents foreign-born 245 100.0% NativeOne native, one foreign-born parent 313 100.0% NativeChildren under 6 years - Living with one parent Native parent 265 100.0% NativeForeign-born parent 43 100.0% NativeChildren 6 to 17 years - Living with two parents Both parents native 3,156 99.9% Native4 0.1% Foreign-bornBoth parents foreign-born 756 92.9% Native58 7.1% Foreign-bornOne native, one foreign-born parent 1,003 99.4% Native6 0.6% Foreign-bornChildren 6 to 17 years - Living with one parent Native parent 694 100.0% NativeForeign-born parent 375 56.8% Native285 43.2% Foreign-born
Grandparents responsible for own grandchildren in The Acreage
Grandparents (30 to 59 years) White / Caucasian 13 16.5% Responsible for grandchildren64 83.5% Not responsible for grandchildrenBlack or African American 27 36.0% Responsible for grandchildren49 64.0% Not responsible for grandchildrenTwo or more races 18 20.0% Responsible for grandchildren74 80.0% Not responsible for grandchildrenWhite alone, not Hispanic / Latino 15 24.3% Responsible for grandchildren46 75.7% Not responsible for grandchildrenHispanic or Latino 23 15.6% Responsible for grandchildren122 84.4% Not responsible for grandchildrenGrandparents (60 years and over) White / Caucasian 138 30.6% Responsible for grandchildren314 69.4% Not responsible for grandchildrenBlack or African American 27 45.9% Responsible for grandchildren32 54.1% Not responsible for grandchildrenTwo or more races 44 100.0% Not responsible for grandchildrenWhite alone, not Hispanic / Latino 165 39.9% Responsible for grandchildren248 60.1% Not responsible for grandchildrenHispanic or Latino 31 12.3% Responsible for grandchildren221 87.7% Not responsible for grandchildren