Races in Throop, New York (NY) Detailed Stats
Ancestries, Foreign-born residents, place of birth

Recent posts about races in Throop, New York on our local forum with over 2,400,000 registered users:
 | 65 years old (6 replies) |
| Whats the bad side of Bed-Stuy ?? (208 replies) |
| Bedstuy (Halsey st & Lewis Ave) (50 replies) |
| Moving to NYC - Pace University (23 replies) |
| Kingston Throop Ave AC Train (0 replies) |
| Is it stupid for a young white dude to move to Bed Stuy with his Latino Girlfriend? (50 replies) |
1.9% of Throop, NY residents are foreign-born , which is 1046.5% less than the foreign-born rate of 22.0% across the entire state of New York.
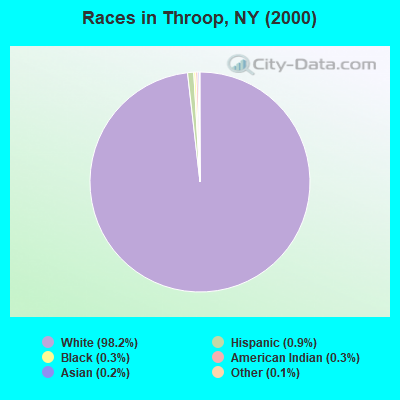
Race distribution in Throop

- 1,79198.2%White alone
- 170.9%Hispanic
- 50.3%Black alone
- 50.3%American Indian alone
- 30.2%Asian alone
- 20.1%Other race alone
- 10.05%Two or more races
2000
2022
-
- 11,760,98162.0%White alone
- 2,867,58315.1%Hispanic
- 2,812,62314.8%Black alone
- 1,035,9265.5%Asian alone
- 366,1161.9%Two or more races
- 75,4990.4%Other race alone
- 52,4990.3%American Indian alone
- 5,2300.03%Native Hawaiian and Other
Pacific Islander alone

-
- 10,408,93352.9%White alone
- 3,867,29919.7%Hispanic
- 2,633,84013.4%Black alone
- 1,776,2869.0%Asian alone
- 732,6703.7%Two or more races
- 216,1101.1%Other race alone
- 35,0820.2%American Indian alone
- 6,9310.04%Native Hawaiian and Other
Pacific Islander alone

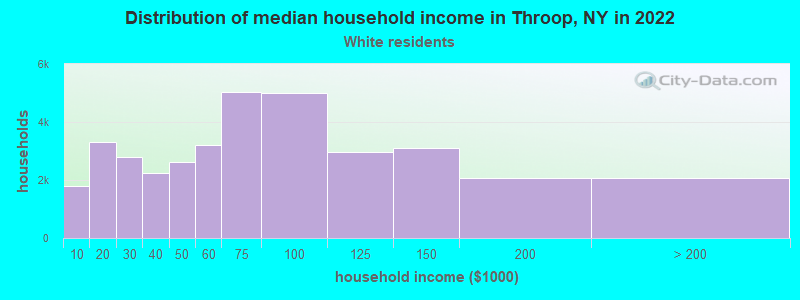
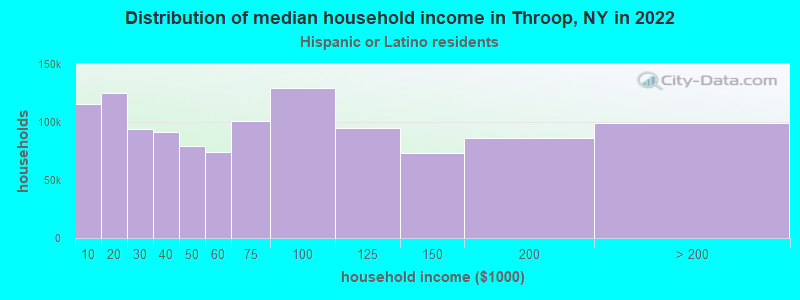
Income and house value in Throop
- Median household income in 2022
- $78,518White non-Hispanic householders
- $108,891Hispanic or Latino race householders
- Median 2022 house value
- $195,013White Non-Hispanic householders
- $192,969Hispanic or Latino householders
Household income for White non-Hispanic householders
Household income for Hispanic or Latino race householders
Foreign-born residents in Throop
35 residents are foreign born
| This city: | 1.9% |
| New York: | 20.4% |
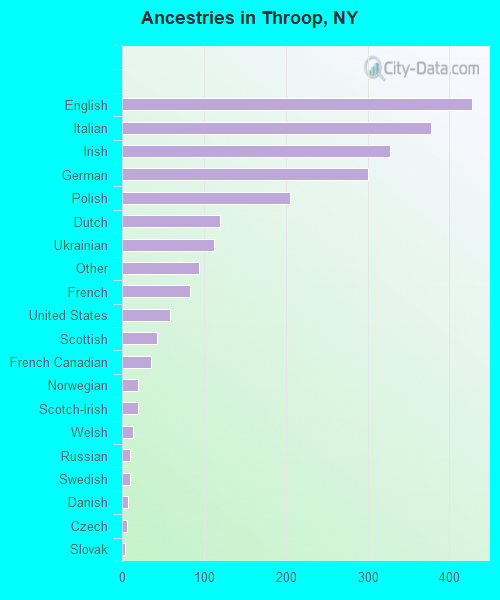
Ancestries in Throop

- 42718.7%English
- 37816.6%Italian
- 32814.4%Irish
- 30113.2%German
- 2059.0%Polish
- 1205.3%Dutch
- 1124.9%Ukrainian
- 944.1%Other
- 833.6%French
- 592.6%United States
- 431.9%Scottish
- 361.6%French Canadian
- 200.9%Norwegian
- 190.8%Scotch-Irish
- 140.6%Welsh
- 100.4%Russian
- 100.4%Swedish
- 70.3%Danish
- 60.3%Czech
- 40.2%Slovak
- 30.1%Arab
Zip codes: 13021.