Races in Trentwood, Washington (WA) Detailed Stats
Ancestries, Foreign-born residents, place of birth

Discuss Trentwood, Washington races on our local forum with over 2,400,000 registered users
4.5% of Trentwood, WA residents are foreign-born (2.6% born in Asia, 1.0% born in Europe, 0.7% born in North America), which is 232.4% less than the foreign-born rate of 15.0% across the entire state of Washington.
Race distribution in Trentwood

- 4,00191.2%White alone
- 1192.7%Asian alone
- 1052.4%Hispanic
- 761.7%Two or more races
- 451.0%American Indian alone
- 310.7%Black alone
- 50.1%Native Hawaiian and Other
Pacific Islander alone - 60.1%Other race alone
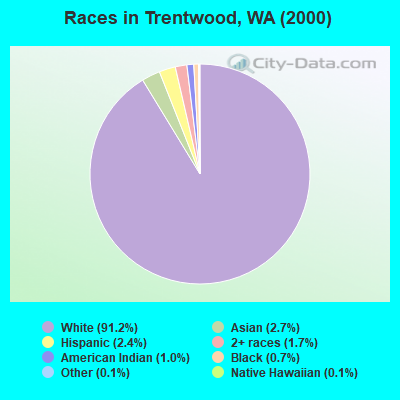
2000
2022
-
- 4,652,49078.9%White alone
- 441,5097.5%Hispanic
- 319,4015.4%Asian alone
- 184,6313.1%Black alone
- 175,9263.0%Two or more races
- 85,3961.4%American Indian alone
- 22,7790.4%Native Hawaiian and Other
Pacific Islander alone - 11,9890.2%Other race alone

-
- 4,941,45663.5%White alone
- 1,093,31314.0%Hispanic
- 755,8329.7%Asian alone
- 523,4486.7%Two or more races
- 299,5373.8%Black alone
- 69,0240.9%American Indian alone
- 52,2310.7%Native Hawaiian and Other
Pacific Islander alone - 50,9450.7%Other race alone

Income and house value in Trentwood
- Median household income in 2022
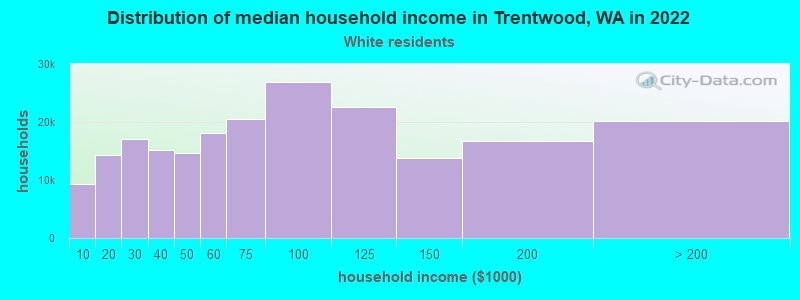
- $76,665White non-Hispanic householders
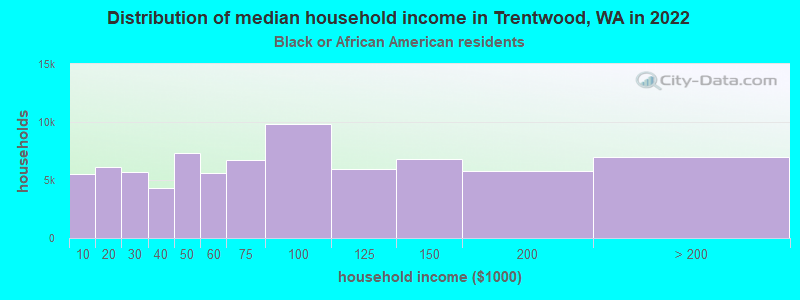
- $39,195Black householders
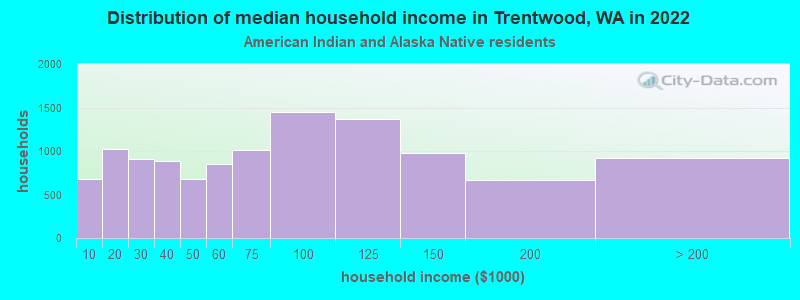
- $55,830American Indian and Alaska Native householders
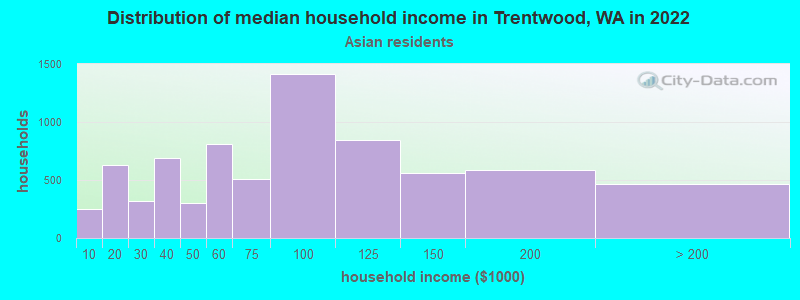
- $156,311Asian householders
- $78,228Some other race householders
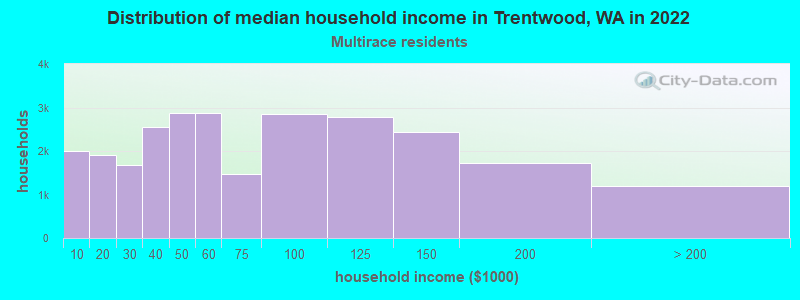
- $115,200Two or more races householders
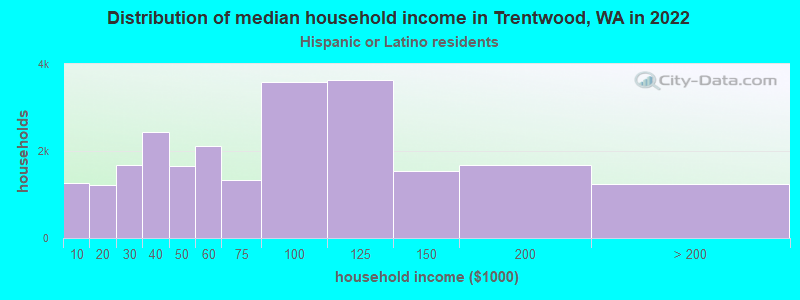
- $174,753Hispanic or Latino race householders
- Median 2022 house value
- $412,510White Non-Hispanic householders
- $298,920Black or African American householders
- $301,536American Indian or Alaska Native householders
- $345,627Asian householders
- $428,951Two or more races householders
- $446,886Hispanic or Latino householders
Household income for White non-Hispanic householders
Household income for Black householders
Household income for American Indian and Alaska Native householders
Household income for Asian householders
Household income for Two or more races householders
Household income for Hispanic or Latino race householders
Foreign-born residents in Trentwood
198 residents are foreign born (2.6% Asia, 1.0% Europe, 0.7% North America).
| This city: | 4.5% |
| Washington: | 10.4% |
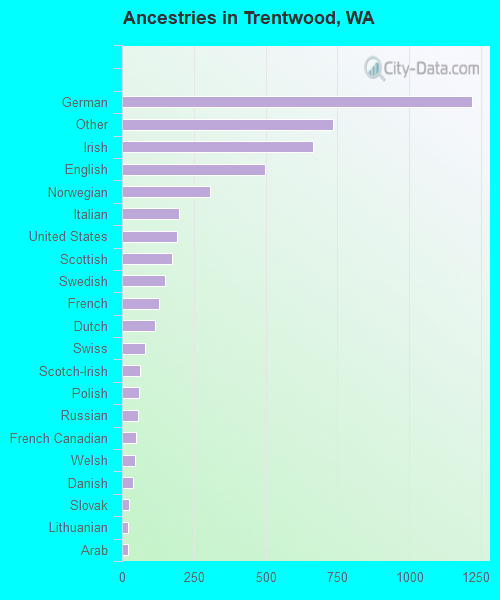
Ancestries in Trentwood

- 1,21725.1%German
- 73515.1%Other
- 66413.7%Irish
- 49910.3%English
- 3086.3%Norwegian
- 1994.1%Italian
- 1934.0%United States
- 1733.6%Scottish
- 1483.0%Swedish
- 1302.7%French
- 1142.3%Dutch
- 791.6%Swiss
- 611.3%Scotch-Irish
- 601.2%Polish
- 571.2%Russian
- 491.0%French Canadian
- 460.9%Welsh
- 370.8%Danish
- 250.5%Slovak
- 210.4%Lithuanian
- 200.4%Arab
- 70.1%Portuguese
- 70.1%Ukrainian
- 70.1%West Indian
Zip codes: 99216.