Races in Upper Falls, West Virginia (WV) Detailed Stats
Ancestries, Foreign-born residents, place of birth
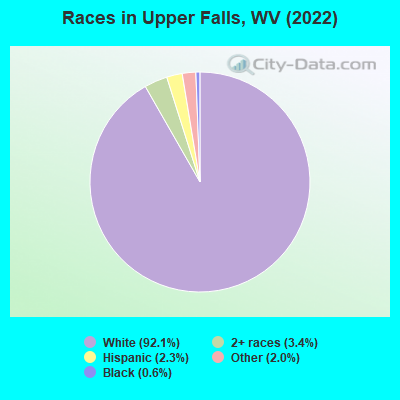
According to 2022 data, the most numerous races in Upper Falls, WV are White alone (3,558 residents), Two or more races (130 residents), and Black alone (23 residents). 98.6% of Upper Falls residents speak English at home.
Race distribution in Upper Falls

- 3,55892.1%White alone
- 1303.4%Two or more races
- 902.3%Hispanic
- 792.0%Other race alone
- 230.6%Black alone
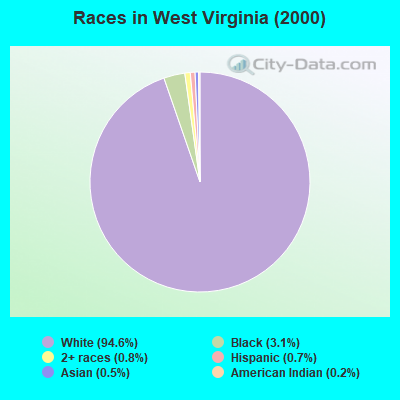
2000
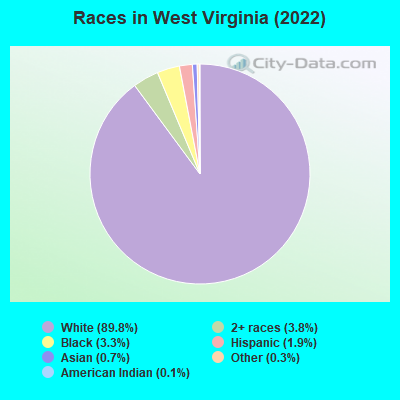
2022
-
- 1,709,96694.6%White alone
- 56,8253.1%Black alone
- 14,9830.8%Two or more races
- 12,2790.7%Hispanic
- 9,3560.5%Asian alone
- 3,4560.2%American Indian alone
- 1,1440.06%Other race alone
- 3350.02%Native Hawaiian and Other
Pacific Islander alone
-
- 1,594,12889.8%White alone
- 66,9323.8%Two or more races
- 59,3903.3%Black alone
- 34,3431.9%Hispanic
- 13,1340.7%Asian alone
- 5,2380.3%Other race alone
- 1,8800.1%American Indian alone
- 1110.01%Native Hawaiian and Other
Pacific Islander alone
Income and house value in Upper Falls
- Median household income in 2022
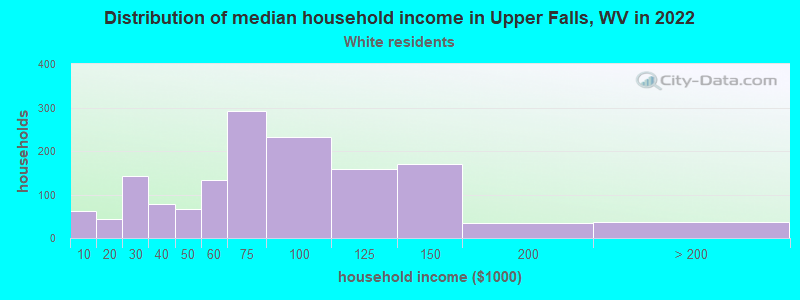
- $88,026White non-Hispanic householders
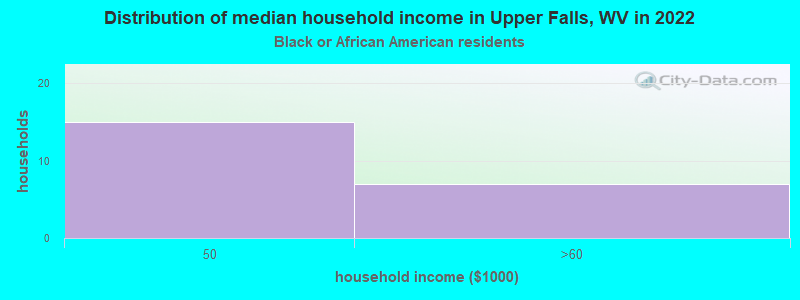
- $80,878Black householders
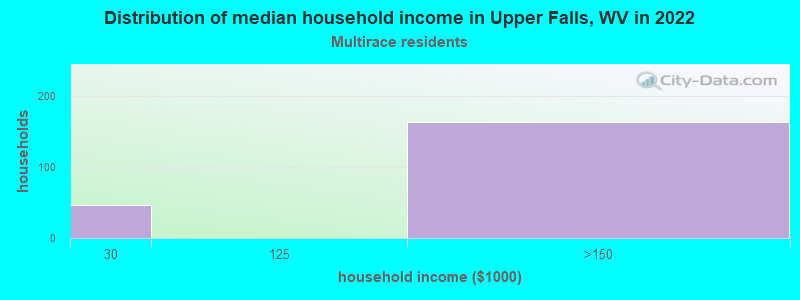
- $37,394Two or more races householders
- Median 2022 house value
Household income for White non-Hispanic householders
Household income for Black householders
Household income for Two or more races householders
Median age by race in Upper Falls
- 41.9Median age for White residents
- 40.6Males
- 42.3Females
- 60.0Median age for Black or African American residents
- 51.6Median age for Two or more races residents
- 6.8Males
- 57.4Females
- 42.8Median age for White alone residents
- 40.5Males
- 43.8Females
- 22.9Median age for Hispanic or Latino residents
Owner/renter occupied households by race in Upper Falls
- House owners and renters - White residents
- 1,14681.3%Owner occupied
- 26418.7%Renter occupied
- House owners and renters - Black or African American residents
- 17100.0%Owner occupied
- House owners and renters - Other race residents
- 76100.0%Owner occupied
- House owners and renters - Two or more races residents
- 94100.0%Owner occupied
- House owners and renters - White alone residents
- 1,14081.1%Owner occupied
- 26518.9%Renter occupied
Language usage in Upper Falls
- English speakers - Total
- 98.6% of residents of Upper Falls speak English at home.
- 0.5% of residents speak other language at home
- 18100.0%Speak English less than very well
- English speakers - Born in the United States
- 99.8% of residents of Upper Falls speak English at home.
- English speakers - Native, born elsewhere
- 93.1% of residents of Upper Falls speak English at home.
- English speakers - Foreign-born
- 54.0% of residents of Upper Falls speak English at home.
- 42.0% of residents speak other language at home
- 21100.0%Speak English less than very well
White (Caucasian) - Speak only English
| Native: | 100.0% (3,263) |
| Foreign-born: | 57.9% (26) |
White alone - Speak only English
| Native: | 100.0% (3,216) |
| Foreign-born: | 50.8% (26) |
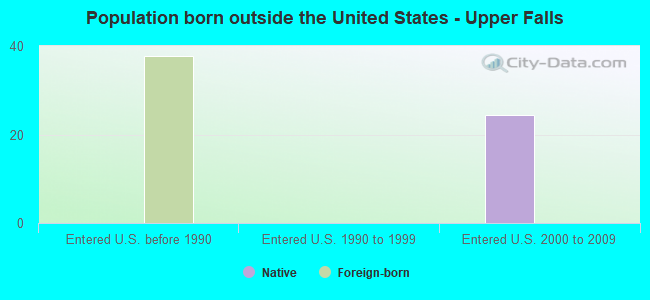
Foreign-born residents in Upper Falls
Marital status for residents in Upper Falls
Marital status - White (Caucasian) population 15 years and over
- Males
- 10.4%Never married
- 80.1%Now married
- 0.0%Separated
- 1.6%Widowed
- 8.0%Divorced
- Females
- 15.4%Never married
- 52.7%Now married
- 6.4%Separated
- 8.0%Widowed
- 17.4%Divorced
Women who gave birth in the past 12 months
| Now married: | 100.0% (30) |
| Unmarried: | 0.0% (0) |
Women who did not give birth in the past 12 months
| Now married: | 60.8% (415) |
| Unmarried: | 39.2% (268) |
Marital status - Two or more races population 15 years and over
- Males
- 0.0%Never married
- 100.0%Now married
- 0.0%Separated
- 0.0%Widowed
- 0.0%Divorced
- Females
- 22.2%Never married
- 33.3%Now married
- 0.0%Separated
- 0.0%Widowed
- 44.4%Divorced
Women who did not give birth in the past 12 months
| Now married: | 33.3% (37) |
| Unmarried: | 66.7% (75) |
Marital status - White alone, not Hispanic / Latino population 15 years and over
- Males
- 10.4%Never married
- 80.1%Now married
- 0.0%Separated
- 1.6%Widowed
- 8.0%Divorced
- Females
- 15.7%Never married
- 53.7%Now married
- 4.8%Separated
- 8.2%Widowed
- 17.7%Divorced
Women who gave birth in the past 12 months
| Now married: | 100.0% (30) |
| Unmarried: | 0.0% (0) |
Women who did not give birth in the past 12 months
| Now married: | 59.2% (387) |
| Unmarried: | 40.8% (266) |
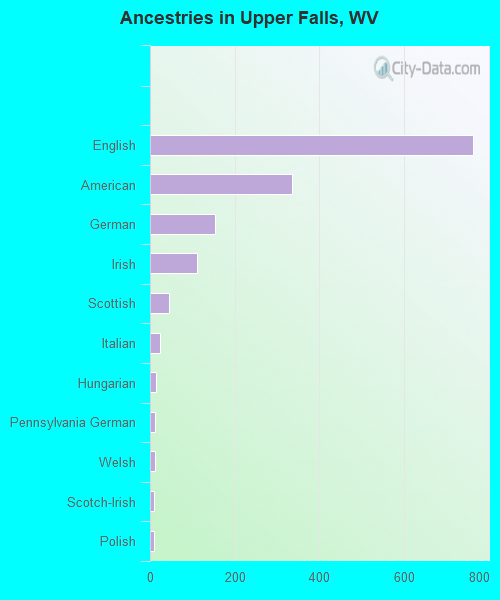
Ancestries in Upper Falls

- 76250.6%English
- 33422.2%American
- 15310.2%German
- 1117.4%Irish
- 463.1%Scottish
- 241.6%Italian
- 151.0%Hungarian
- 120.8%Pennsylvania German
- 120.8%Welsh
- 100.7%Scotch-Irish
- 90.6%Polish
- 50.3%Dutch
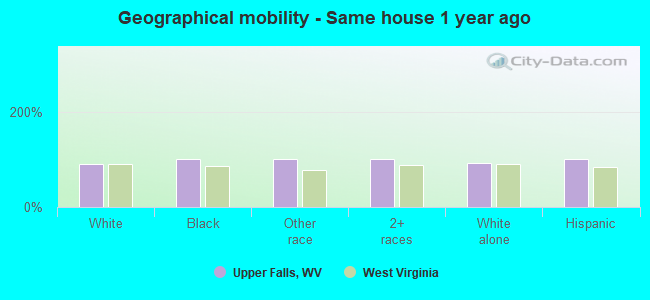
Geographical mobility in Upper Falls

- Same house 1 year ago
- 3,26791.5%White (Caucasian)
- 26100.0%Black or African American
- 49100.0%Other race
- 245100.0%Two or more races
- 3,22891.5%White alone, not Hispanic / Latino
- 92100.0%Hispanic or Latino
-
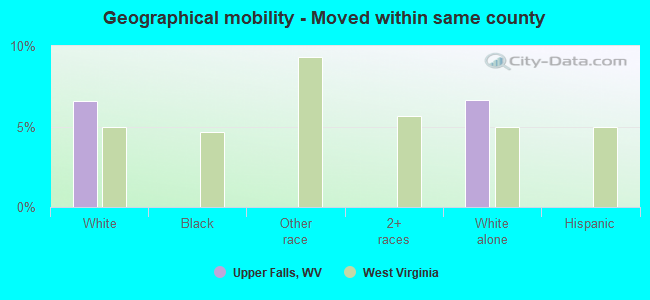
- Moved within same county
- 2366.6%White / Caucasian
- 2356.7%White alone, not Hispanic / Latino
Children Nativity (place of birth) in Upper Falls
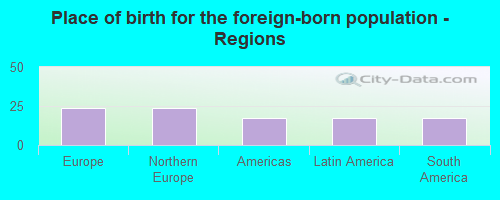
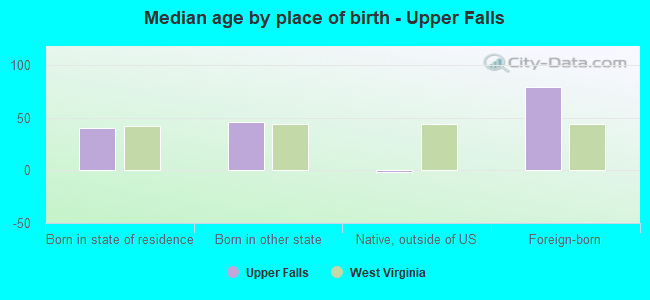
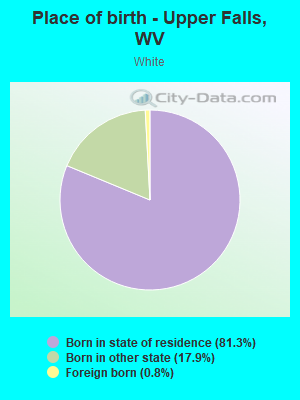
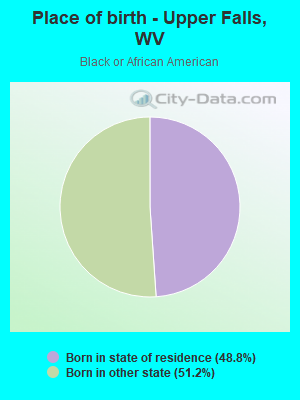
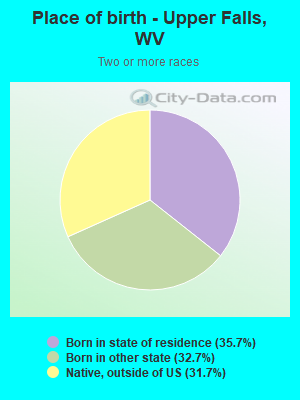
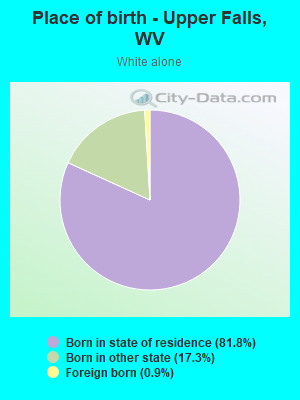
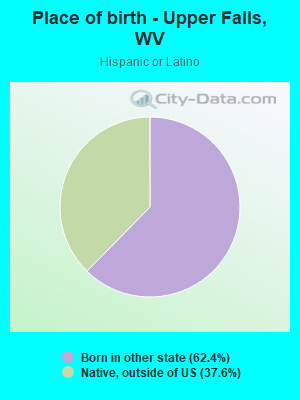
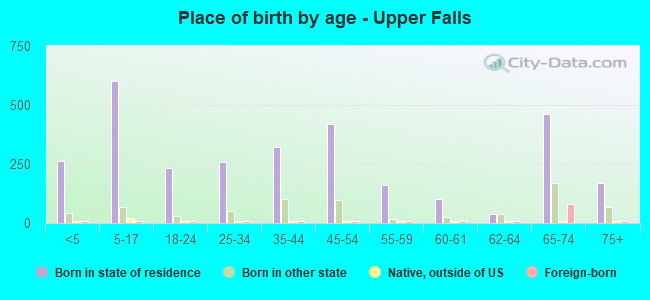
Place of birth for residents in Upper Falls
![Place of birth for the foreign-born population - Regions]()
- 24Europe
- 24Northern Europe
- 17Americas
- 17Latin America
- 17South America