Races in Urban Honolulu, Hawaii (HI) Detailed Stats
Data:
Races - White alone (%)
Races - White alone (% change since 2000)
Races - Black alone (%)
Races - Black alone (% change since 2000)
Races - American Indian alone (%)
Races - American Indian alone (% change since 2000)
Races - Asian alone (%)
Races - Asian alone (% change since 2000)
Races - Hispanic (%)
Races - Hispanic (% change since 2000)
Races - Native Hawaiian and Other Pacific Islander alone (%)
Races - Native Hawaiian and Other Pacific Islander alone (% change since 2000)
Races - Two or more races(%)
Races - Two or more races(% change since 2000)
Races - Other race alone (%)
Races - Other race alone (% change since 2000)
Racial diversity
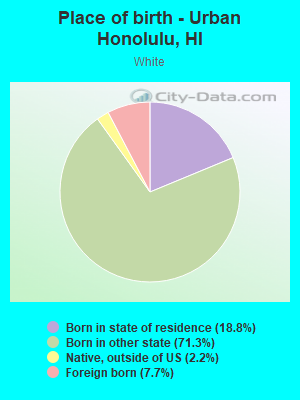
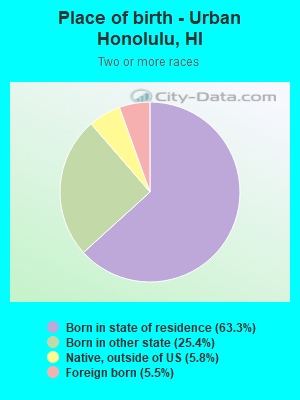
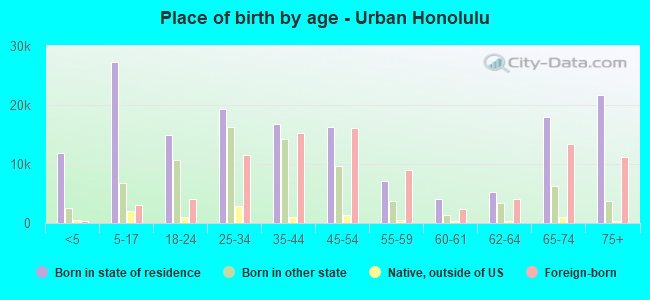
Place of birth - Born in state of residence (%)
Place of birth - Born in state of residence (%) - White
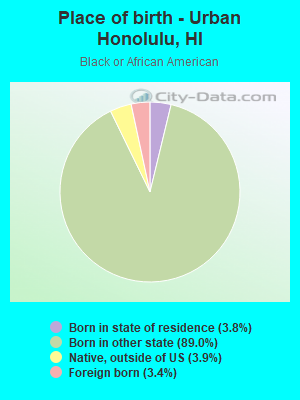
Place of birth - Born in state of residence (%) - Black or African American
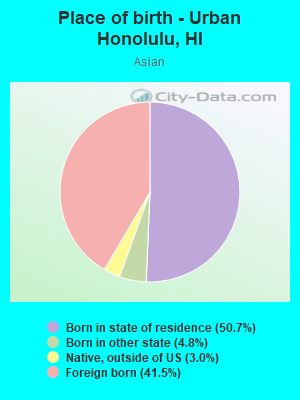
Place of birth - Born in state of residence (%) - Asian
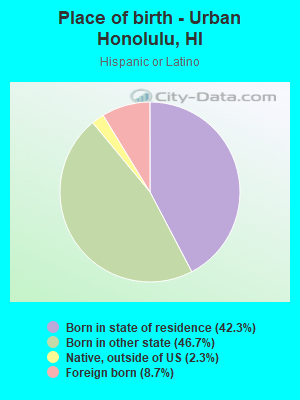
Place of birth - Born in state of residence (%) - Hispanic or Latino
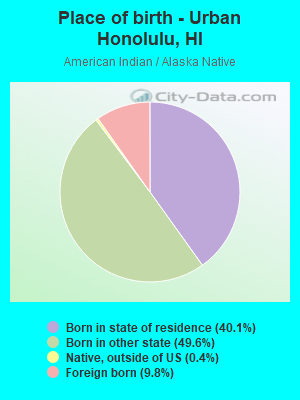
Place of birth - Born in state of residence (%) - American Indian and Alaska Native
Place of birth - Born in state of residence (%) - Multirace
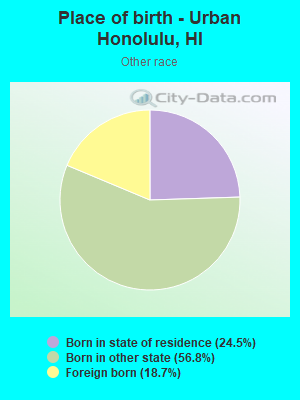
Place of birth - Born in state of residence (%) - Other Race
Place of birth - Born in other state (%)
Place of birth - Born in other state (%) - White
Place of birth - Born in other state (%) - Black or African American
Place of birth - Born in other state (%) - Asian
Place of birth - Born in other state (%) - Hispanic or Latino
Place of birth - Born in other state (%) - American Indian and Alaska Native
Place of birth - Born in other state (%) - Multirace
Place of birth - Born in other state (%) - Other Race
Place of birth - Native, outside of US (%)
Place of birth - Native, outside of US (%) - White
Place of birth - Native, outside of US (%) - Black or African American
Place of birth - Native, outside of US (%) - Asian
Place of birth - Native, outside of US (%) - Hispanic or Latino
Place of birth - Native, outside of US (%) - American Indian and Alaska Native
Place of birth - Native, outside of US (%) - Multirace
Place of birth - Native, outside of US (%) - Other Race
Place of birth - Foreign born (%)
Place of birth - Foreign born (%) - White
Place of birth - Foreign born (%) - Black or African American
Place of birth - Foreign born (%) - Asian
Place of birth - Foreign born (%) - Hispanic or Latino
Place of birth - Foreign born (%) - American Indian and Alaska Native
Place of birth - Foreign born (%) - Multirace
Place of birth - Foreign born (%) - Other Race
Residents speaking English at home (%)
Residents speaking English at home - Born in the United States (%)
Residents speaking English at home - Native, born elsewhere (%)
Residents speaking English at home - Foreign born (%)
Residents speaking Spanish at home (%)
Residents speaking Spanish at home - Born in the United States (%)
Residents speaking Spanish at home - Native, born elsewhere (%)
Residents speaking Spanish at home - Foreign born (%)
Residents speaking other language at home (%)
Residents speaking other language at home - Born in the United States (%)
Residents speaking other language at home - Native, born elsewhere (%)
Residents speaking other language at home - Foreign born (%)
Marital status - Never married (%)
Marital status - Now married (%)
Marital status - Separated (%)
Marital status - Widowed (%)
Marital status - Divorced (%)
Ancestries Reported - Arab (%)
Ancestries Reported - Czech (%)
Ancestries Reported - Danish (%)
Ancestries Reported - Dutch (%)
Ancestries Reported - English (%)
Ancestries Reported - French (%)
Ancestries Reported - French Canadian (%)
Ancestries Reported - German (%)
Ancestries Reported - Greek (%)
Ancestries Reported - Hungarian (%)
Ancestries Reported - Irish (%)
Ancestries Reported - Italian (%)
Ancestries Reported - Lithuanian (%)
Ancestries Reported - Norwegian (%)
Ancestries Reported - Polish (%)
Ancestries Reported - Portuguese (%)
Ancestries Reported - Russian (%)
Ancestries Reported - Scotch-Irish (%)
Ancestries Reported - Scottish (%)
Ancestries Reported - Slovak (%)
Ancestries Reported - Subsaharan African (%)
Ancestries Reported - Swedish (%)
Ancestries Reported - Swiss (%)
Ancestries Reported - Ukrainian (%)
Ancestries Reported - United States (%)
Ancestries Reported - Welsh (%)
Ancestries Reported - West Indian (%)
Ancestries Reported - Other (%)
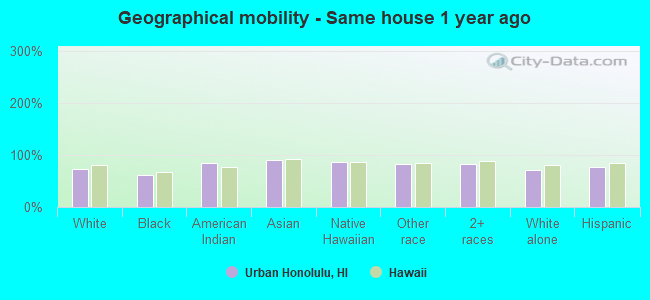
Geographical mobility - Same house 1 year ago (%)
Geographical mobility - Same house 1 year ago (%) - White
Geographical mobility - Same house 1 year ago (%) - Black or African American
Geographical mobility - Same house 1 year ago (%) - Asian
Geographical mobility - Same house 1 year ago (%) - Hispanic or Latino
Geographical mobility - Same house 1 year ago (%) - American Indian and Alaska Native
Geographical mobility - Same house 1 year ago (%) - Multirace
Geographical mobility - Same house 1 year ago (%) - Other Race
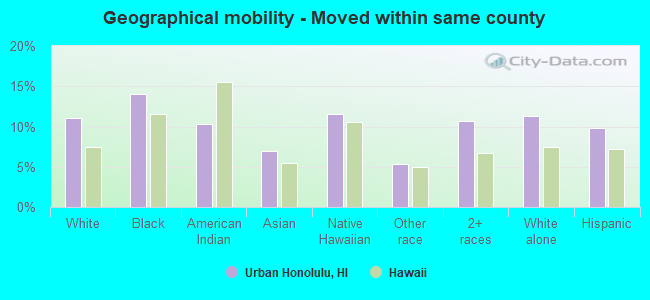
Geographical mobility - Moved within same county (%)
Geographical mobility - Moved within same county (%) - White
Geographical mobility - Moved within same county (%) - Black or African American
Geographical mobility - Moved within same county (%) - Asian
Geographical mobility - Moved within same county (%) - Hispanic or Latino
Geographical mobility - Moved within same county (%) - American Indian and Alaska Native
Geographical mobility - Moved within same county (%) - Multirace
Geographical mobility - Moved within same county (%) - Other Race
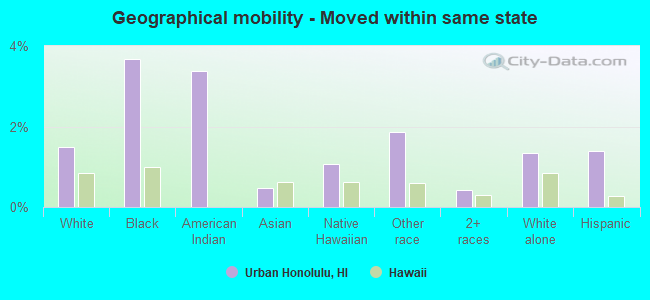
Geographical mobility - Moved from different county within same state (%)
Geographical mobility - Moved from different county within same state (%) - White
Geographical mobility - Moved from different county within same state (%) - Black or African American
Geographical mobility - Moved from different county within same state (%) - Asian
Geographical mobility - Moved from different county within same state (%) - Hispanic or Latino
Geographical mobility - Moved from different county within same state (%) - American Indian and Alaska Native
Geographical mobility - Moved from different county within same state (%) - Multirace
Geographical mobility - Moved from different county within same state (%) - Other Race
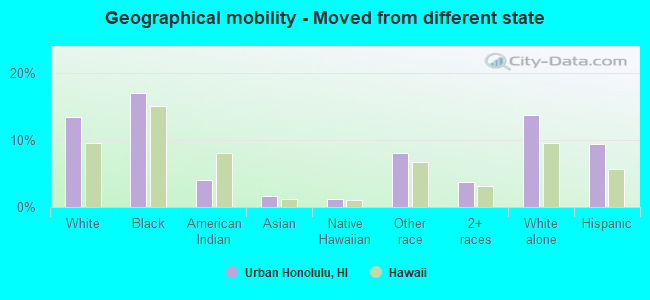
Geographical mobility - Moved from different state (%)
Geographical mobility - Moved from different state (%) - White
Geographical mobility - Moved from different state (%) - Black or African American
Geographical mobility - Moved from different state (%) - Asian
Geographical mobility - Moved from different state (%) - Hispanic or Latino
Geographical mobility - Moved from different state (%) - American Indian and Alaska Native
Geographical mobility - Moved from different state (%) - Multirace
Geographical mobility - Moved from different state (%) - Other Race
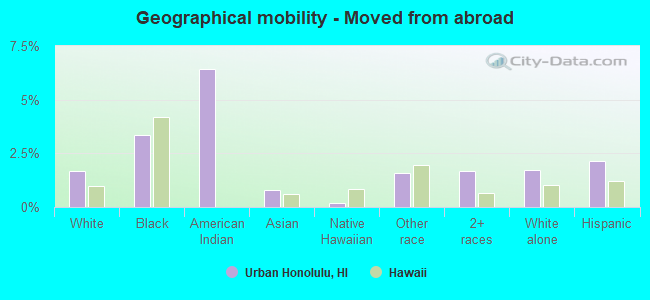
Geographical mobility - Moved from abroad (%)
Geographical mobility - Moved from abroad (%) - White
Geographical mobility - Moved from abroad (%) - Black or African American
Geographical mobility - Moved from abroad (%) - Asian
Geographical mobility - Moved from abroad (%) - Hispanic or Latino
Geographical mobility - Moved from abroad (%) - American Indian and Alaska Native
Geographical mobility - Moved from abroad (%) - Multirace
Geographical mobility - Moved from abroad (%) - Other Race
Place of birth for the foreign-born population - Ireland (%)
Place of birth for the foreign-born population - Denmark (%)
Place of birth for the foreign-born population - Norway (%)
Place of birth for the foreign-born population - Sweden (%)
Place of birth for the foreign-born population - United Kingdom (%)
Place of birth for the foreign-born population - England (%)
Place of birth for the foreign-born population - Scotland (%)
Place of birth for the foreign-born population - Other Northern Europe (%)
Place of birth for the foreign-born population - Austria (%)
Place of birth for the foreign-born population - Belgium (%)
Place of birth for the foreign-born population - France (%)
Place of birth for the foreign-born population - Germany (%)
Place of birth for the foreign-born population - Netherlands (%)
Place of birth for the foreign-born population - Switzerland (%)
Place of birth for the foreign-born population - Other Western Europe (%)
Place of birth for the foreign-born population - Greece (%)
Place of birth for the foreign-born population - Italy (%)
Place of birth for the foreign-born population - Portugal (%)
Place of birth for the foreign-born population - Spain (%)
Place of birth for the foreign-born population - Other Southern Europe (%)
Place of birth for the foreign-born population - Albania (%)
Place of birth for the foreign-born population - Belarus (%)
Place of birth for the foreign-born population - Bosnia and Herzegovina (%)
Place of birth for the foreign-born population - Bulgaria (%)
Place of birth for the foreign-born population - Croatia (%)
Place of birth for the foreign-born population - Czechoslovakia (%)
Place of birth for the foreign-born population - Hungary (%)
Place of birth for the foreign-born population - Latvia (%)
Place of birth for the foreign-born population - Lithuania (%)
Place of birth for the foreign-born population - North Macedonia (Macedonia) (%)
Place of birth for the foreign-born population - Moldova (%)
Place of birth for the foreign-born population - Poland (%)
Place of birth for the foreign-born population - Romania (%)
Place of birth for the foreign-born population - Russia (%)
Place of birth for the foreign-born population - Serbia (%)
Place of birth for the foreign-born population - Ukraine (%)
Place of birth for the foreign-born population - Other Eastern Europe (%)
Place of birth for the foreign-born population - China (%)
Place of birth for the foreign-born population - Hong Kong (%)
Place of birth for the foreign-born population - Taiwan (%)
Place of birth for the foreign-born population - Japan (%)
Place of birth for the foreign-born population - Korea (%)
Place of birth for the foreign-born population - Other Eastern Asia (%)
Place of birth for the foreign-born population - Afghanistan (%)
Place of birth for the foreign-born population - Bangladesh (%)
Place of birth for the foreign-born population - India (%)
Place of birth for the foreign-born population - Iran (%)
Place of birth for the foreign-born population - Kazakhstan (%)
Place of birth for the foreign-born population - Nepal (%)
Place of birth for the foreign-born population - Pakistan (%)
Place of birth for the foreign-born population - Sri Lanka (%)
Place of birth for the foreign-born population - Uzbekistan (%)
Place of birth for the foreign-born population - Other South Central Asia (%)
Place of birth for the foreign-born population - Burma (%)
Place of birth for the foreign-born population - Cambodia (%)
Place of birth for the foreign-born population - Indonesia (%)
Place of birth for the foreign-born population - Laos (%)
Place of birth for the foreign-born population - Malaysia (%)
Place of birth for the foreign-born population - Philippines (%)
Place of birth for the foreign-born population - Singapore (%)
Place of birth for the foreign-born population - Thailand (%)
Place of birth for the foreign-born population - Vietnam (%)
Place of birth for the foreign-born population - Other South Eastern Asia (%)
Place of birth for the foreign-born population - Armenia (%)
Place of birth for the foreign-born population - Iraq (%)
Place of birth for the foreign-born population - Israel (%)
Place of birth for the foreign-born population - Jordan (%)
Place of birth for the foreign-born population - Kuwait (%)
Place of birth for the foreign-born population - Lebanon (%)
Place of birth for the foreign-born population - Saudi Arabia (%)
Place of birth for the foreign-born population - Syria (%)
Place of birth for the foreign-born population - Turkey (%)
Place of birth for the foreign-born population - Yemen (%)
Place of birth for the foreign-born population - Other Western Asia (%)
Place of birth for the foreign-born population - Eritrea (%)
Place of birth for the foreign-born population - Ethiopia (%)
Place of birth for the foreign-born population - Kenya (%)
Place of birth for the foreign-born population - Somalia (%)
Place of birth for the foreign-born population - Uganda (%)
Place of birth for the foreign-born population - Zimbabwe (%)
Place of birth for the foreign-born population - Other Eastern Africa (%)
Place of birth for the foreign-born population - Cameroon (%)
Place of birth for the foreign-born population - Congo (%)
Place of birth for the foreign-born population - Democratic Republic of Congo (Zaire) (%)
Place of birth for the foreign-born population - Other Middle Africa (%)
Place of birth for the foreign-born population - Egypt (%)
Place of birth for the foreign-born population - Morocco (%)
Place of birth for the foreign-born population - Sudan (%)
Place of birth for the foreign-born population - Other Northern Africa (%)
Place of birth for the foreign-born population - South Africa (%)
Place of birth for the foreign-born population - Other Southern Africa (%)
Place of birth for the foreign-born population - Cabo Verde (%)
Place of birth for the foreign-born population - Ghana (%)
Place of birth for the foreign-born population - Liberia (%)
Place of birth for the foreign-born population - Nigeria (%)
Place of birth for the foreign-born population - Senegal (%)
Place of birth for the foreign-born population - Sierra Leone (%)
Place of birth for the foreign-born population - Other Western Africa (%)
Place of birth for the foreign-born population - Australia (%)
Place of birth for the foreign-born population - New Zealand (%)
Place of birth for the foreign-born population - Fiji (%)
Place of birth for the foreign-born population - Micronesia (%)
Place of birth for the foreign-born population - Bahamas (%)
Place of birth for the foreign-born population - Barbados (%)
Place of birth for the foreign-born population - Cuba (%)
Place of birth for the foreign-born population - Dominica (%)
Place of birth for the foreign-born population - Dominican Republic (%)
Place of birth for the foreign-born population - Grenada (%)
Place of birth for the foreign-born population - Haiti (%)
Place of birth for the foreign-born population - Jamaica (%)
Place of birth for the foreign-born population - St. Vincent and the Grenadines (%)
Place of birth for the foreign-born population - Trinidad and Tobago (%)
Place of birth for the foreign-born population - West Indies (%)
Place of birth for the foreign-born population - Other Caribbean (%)
Place of birth for the foreign-born population - Belize (%)
Place of birth for the foreign-born population - Costa Rica (%)
Place of birth for the foreign-born population - El Salvador (%)
Place of birth for the foreign-born population - Guatemala (%)
Place of birth for the foreign-born population - Honduras (%)
Place of birth for the foreign-born population - Mexico (%)
Place of birth for the foreign-born population - Nicaragua (%)
Place of birth for the foreign-born population - Panama (%)
Place of birth for the foreign-born population - Other Central America (%)
Place of birth for the foreign-born population - Argentina (%)
Place of birth for the foreign-born population - Bolivia (%)
Place of birth for the foreign-born population - Brazil (%)
Place of birth for the foreign-born population - Chile (%)
Place of birth for the foreign-born population - Colombia (%)
Place of birth for the foreign-born population - Ecuador (%)
Place of birth for the foreign-born population - Guyana (%)
Place of birth for the foreign-born population - Peru (%)
Place of birth for the foreign-born population - Uruguay (%)
Place of birth for the foreign-born population - Venezuela (%)
Place of birth for the foreign-born population - Other South America (%)
Place of birth for the foreign-born population - Canada (%)
Place of birth for the foreign-born population - Other Northern America (%)
Place of birth for the foreign-born population - Other (%)
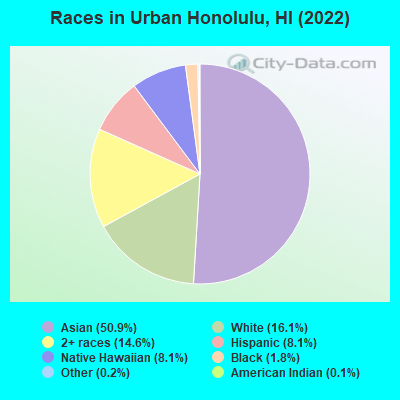
According to 2022 data, the most numerous races in Urban Honolulu, HI are Asian alone (174,878 residents), Two or more races (50,173 residents), and White alone (55,374 residents). 65.9% of Urban Honolulu residents speak English at home.
Race distribution in Urban Honolulu 174,878 50.9% Asian alone 55,374 16.1% White alone 50,173 14.6% Two or more races 27,777 8.1% Hispanic 27,748 8.1% Native Hawaiian and Other 6,267 1.8% Black alone 809 0.2% Other race alone 411 0.1% American Indian alone
2000 2022
494,149 40.8% Asian alone 277,091 22.9% White alone 218,700 18.1% Two or more races 108,441 9.0% Native Hawaiian and Other 87,699 7.2% Hispanic 20,829 1.7% Black alone 2,089 0.2% Other race alone 2,539 0.2% American Indian alone
498,125 34.6% Asian alone 318,574 22.1% Two or more races 297,937 20.7% White alone 160,103 11.1% Hispanic 134,567 9.3% Native Hawaiian and Other 23,682 1.6% Black alone 5,378 0.4% Other race alone 1,830 0.1% American Indian alone
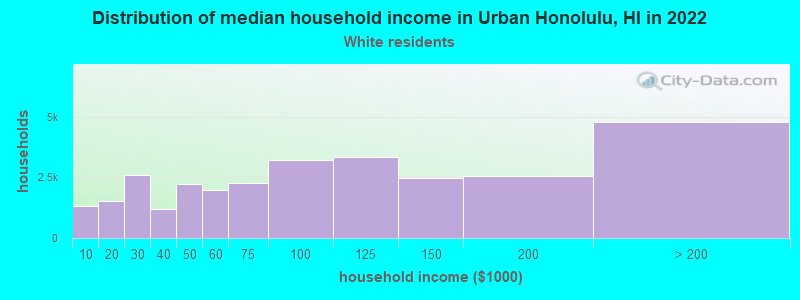
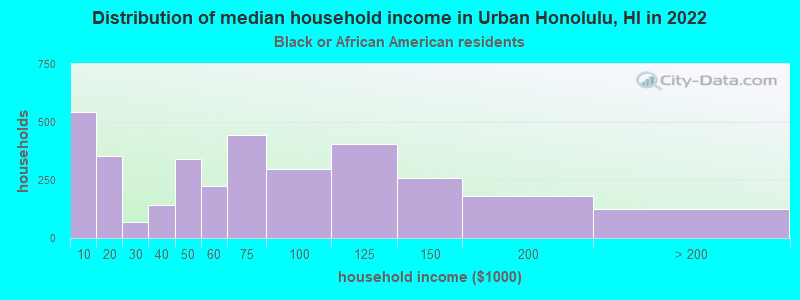
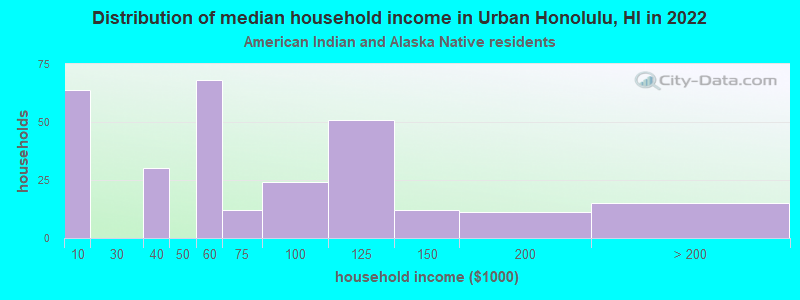
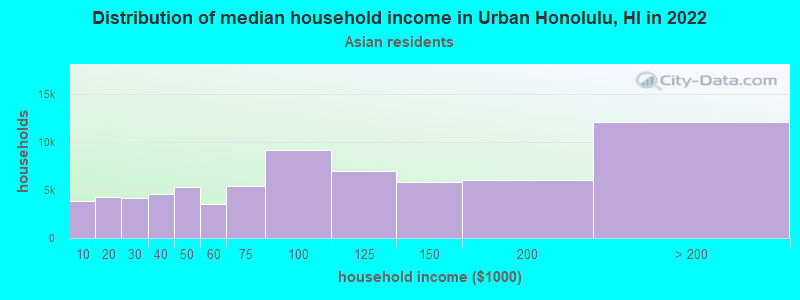
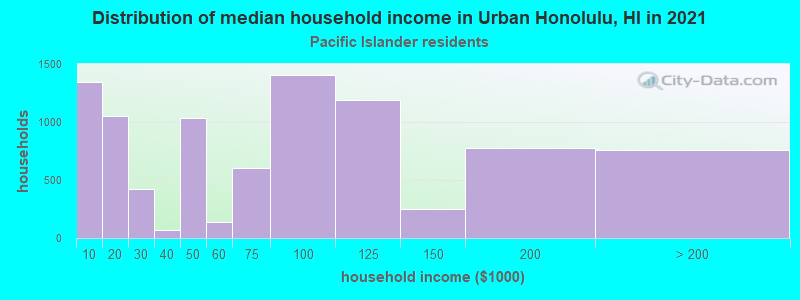
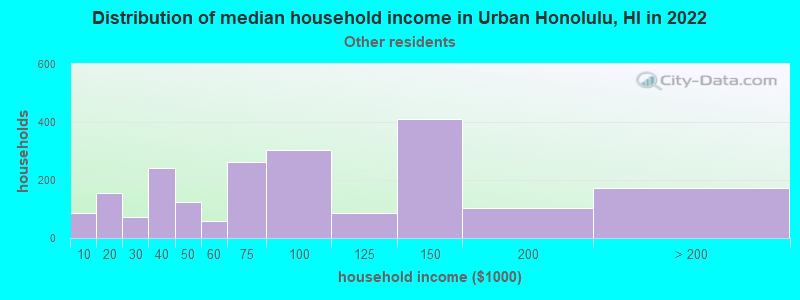
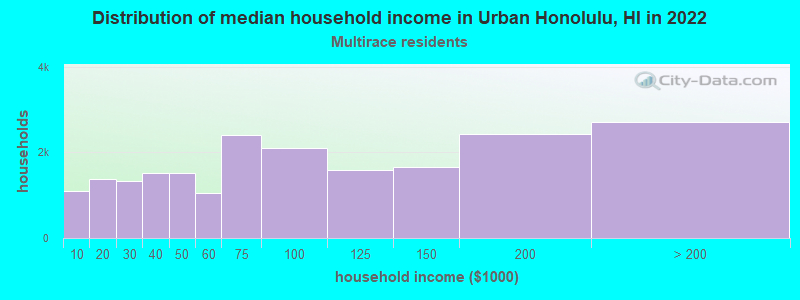
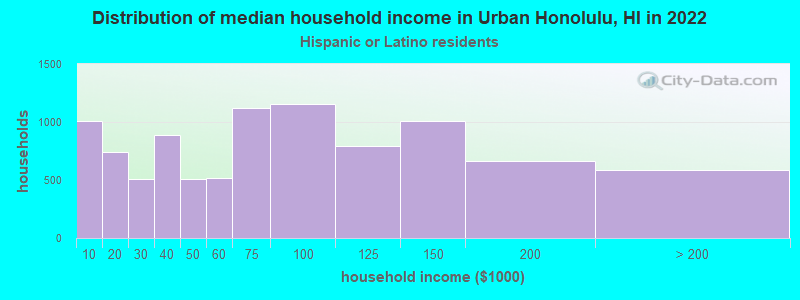
Income and house value in Urban Honolulu Median household income in 2022 $89,684 White non-Hispanic householders$60,252 Black householders$59,102 American Indian and Alaska Native householders$87,894 Asian householders$50,596 Native Hawaiian and other Pacific Islander householders$79,355 Some other race householders$77,774 Two or more races householders$68,908 Hispanic or Latino race householders
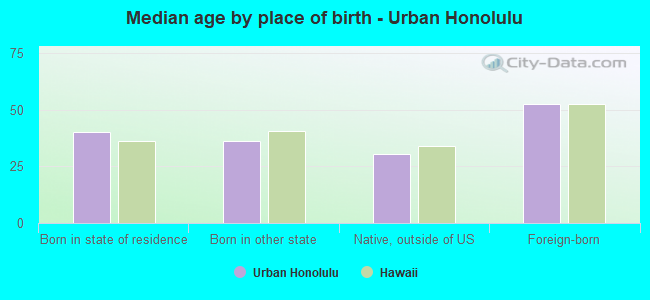
Median age by race in Urban Honolulu
37.4 Median age for White residents39.5 35.9 38.9 Median age for Black or African American residents41.4 36.9 25.2 Median age for American Indian / Alaska Native residents13.2 29.1 51.8 Median age for Asian residents50.8 52.6 31.7 Median age for Native Hawaiian / Pacific Islander residents30.3 36.4 34.7 Median age for Other race residents42.2 29.7 30.8 Median age for Two or more races residents30.7 30.9 38.5 Median age for White alone residents40.1 37.1 28.8 Median age for Hispanic or Latino residents31.6 27.6
Owner/renter occupied households by race in Urban Honolulu
House owners and renters - White residents 10,727 36.3% Owner occupied18,820 63.7% Renter occupiedHouse owners and renters - Black or African American residents 186 5.1% Owner occupied3,464 94.9% Renter occupiedHouse owners and renters - American Indian / Alaska Native residents 26 13.4% Owner occupied164 86.6% Renter occupiedHouse owners and renters - Asian residents 44,112 62.0% Owner occupied27,082 38.0% Renter occupiedHouse owners and renters - Native Hawaiian / Pacific Islander residents 1,984 23.1% Owner occupied6,622 76.9% Renter occupiedHouse owners and renters - Other race residents 322 15.6% Owner occupied1,738 84.4% Renter occupiedHouse owners and renters - Two or more races residents 7,274 35.0% Owner occupied13,500 65.0% Renter occupiedHouse owners and renters - White alone residents 10,188 37.5% Owner occupied16,987 62.5% Renter occupiedHouse owners and renters - Hispanic or Latino residents 1,923 20.3% Owner occupied7,573 79.7% Renter occupied
Language usage in Urban Honolulu
English speakers - Total 65.9% of residents of Urban Honolulu speak English at home.
1.9% of residents speak Spanish at home 4,492 72.9% Speak English very well1,668 27.1% Speak English less than very well32.3% of residents speak other language at home 49,175 46.5% Speak English very well56,654 53.5% Speak English less than very well
English speakers - Born in the United States 89.4% of residents of Urban Honolulu speak English at home.
4.9% of residents speak Spanish at home 2,955 78.7% Speak English very well799 21.3% Speak English less than very well5.7% of residents speak other language at home 3,950 90.9% Speak English very well397 9.1% Speak English less than very well
English speakers - Native, born elsewhere 59.5% of residents of Urban Honolulu speak English at home.
1.2% of residents speak Spanish at home 55 42.0% Speak English very well76 58.0% Speak English less than very well39.3% of residents speak other language at home 3,115 72.7% Speak English very well1,170 27.3% Speak English less than very well
English speakers - Foreign-born 14.5% of residents of Urban Honolulu speak English at home.
1.8% of residents speak Spanish at home 898 54.2% Speak English very well760 45.8% Speak English less than very well83.6% of residents speak other language at home 24,329 32.3% Speak English very well50,968 67.7% Speak English less than very well
White (Caucasian) - Speak only English Native:
95.1% (51,171)Foreign-born:
47.3% (2,177)
White (Caucasian) - Speak another language Native:
4.9% (2,633)Foreign-born:
52.7% (2,430)
Black or African American - Speak only English Native:
95.5% (4,886)Foreign-born:
70.7% (133)
Black or African American - Speak another language Native:
4.4% (227)Foreign-born:
100.0% (187)
American Indian / Alaska Native - Speak only English Native:
85.5% (488)Foreign-born:
21.8% (23)
American Indian / Alaska Native - Speak another language Native:
11.4% (65)Foreign-born:
74.7% (79)
Asian - Speak only English Native:
82.0% (80,936)Foreign-born:
11.7% (8,576)
Asian - Speak another language Native:
18.0% (17,797)Foreign-born:
88.3% (64,525)
Native Hawaiian / Pacific Islander - Speak only English Native:
72.7% (13,693)Foreign-born:
12.1% (921)
Native Hawaiian / Pacific Islander - Speak another language Native:
27.3% (5,147)Foreign-born:
87.9% (6,690)
Other race - Speak only English Native:
68.9% (3,139)Foreign-born:
13.3% (142)
Other race - Speak another language Native:
31.1% (1,415)Foreign-born:
86.7% (923)
Two or more races - Speak only English Native:
85.8% (46,968)Foreign-born:
31.6% (1,105)
Two or more races - Speak another language Native:
14.2% (7,785)Foreign-born:
68.4% (2,387)
White alone - Speak only English Native:
95.7% (46,915)Foreign-born:
50.0% (2,177)
White alone - Speak another language Native:
4.3% (2,131)Foreign-born:
50.0% (2,177)
Hispanic or Latino - Speak only English Native:
79.4% (17,919)Foreign-born:
16.1% (390)
Hispanic or Latino - Speak another language Native:
20.6% (4,663)Foreign-born:
83.9% (2,031)
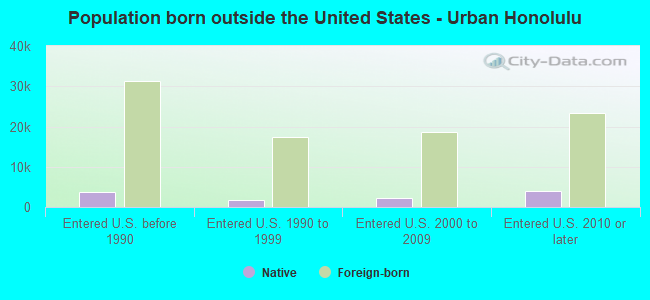
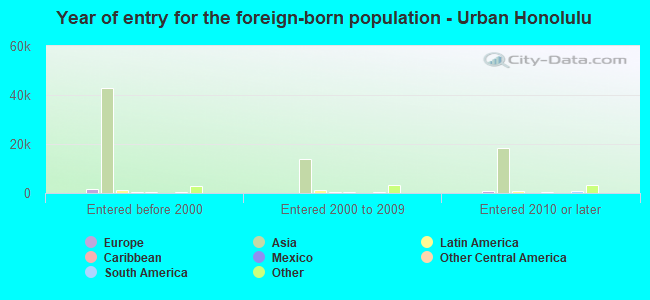
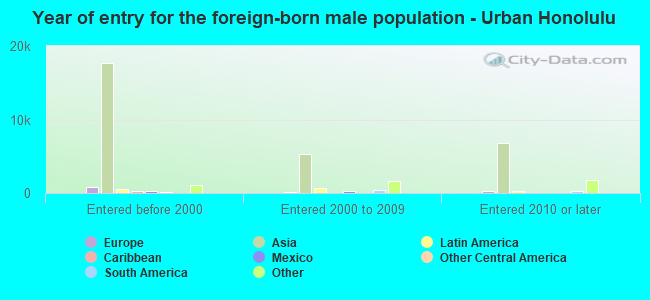
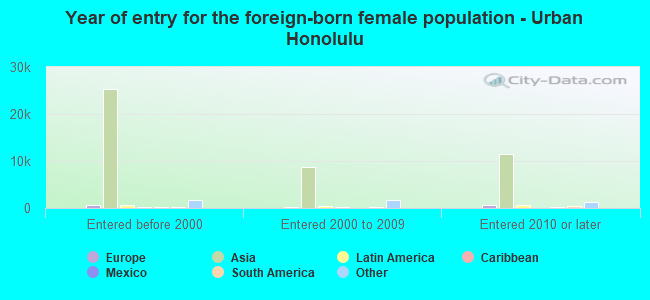
Foreign-born residents in Urban Honolulu
Marital status for residents in Urban Honolulu Marital status - White (Caucasian) population 15 years and over
Males 47.7% Never married40.0% Now married0.9% Separated1.4% Widowed10.0% DivorcedFemales 38.7% Never married39.3% Now married0.4% Separated6.2% Widowed15.4% DivorcedWomen who gave birth in the past 12 months Now married:
82.4% (501)Unmarried:
17.6% (107)
Women who did not give birth in the past 12 months Now married:
34.8% (5,029)Unmarried:
65.2% (9,403)
Marital status - Black or African American population 15 years and over
Males 52.6% Never married32.3% Now married0.8% Separated1.0% Widowed13.3% DivorcedFemales 34.6% Never married39.9% Now married6.3% Separated1.6% Widowed17.6% DivorcedWomen who gave birth in the past 12 months Now married:
100.0% (78)Unmarried:
0.0% (0)
Women who did not give birth in the past 12 months Now married:
46.0% (566)Unmarried:
54.0% (666)
Marital status - American Indian / Alaska Native population 15 years and over
Males 25.1% Never married56.8% Now married16.6% Separated0.0% Widowed1.5% DivorcedFemales 40.7% Never married34.7% Now married0.0% Separated15.8% Widowed8.8% DivorcedWomen who did not give birth in the past 12 months Now married:
38.7% (99)Unmarried:
61.3% (157)
Marital status - Asian population 15 years and over
Males 35.8% Never married51.4% Now married0.9% Separated3.5% Widowed8.3% DivorcedFemales 26.4% Never married49.4% Now married0.8% Separated13.2% Widowed10.2% DivorcedWomen who gave birth in the past 12 months Now married:
81.1% (879)Unmarried:
18.9% (205)
Women who did not give birth in the past 12 months Now married:
48.4% (17,412)Unmarried:
51.6% (18,575)
Marital status - Native Hawaiian / Pacific Islander population 15 years and over
Males 55.5% Never married34.8% Now married1.4% Separated3.3% Widowed5.0% DivorcedFemales 44.8% Never married27.8% Now married4.4% Separated8.9% Widowed14.1% DivorcedWomen who gave birth in the past 12 months Now married:
9.7% (59)Unmarried:
90.3% (548)
Women who did not give birth in the past 12 months Now married:
24.4% (1,273)Unmarried:
75.6% (3,937)
Marital status - Other race population 15 years and over
Males 52.4% Never married26.2% Now married1.5% Separated0.0% Widowed19.9% DivorcedFemales 48.4% Never married39.2% Now married0.0% Separated8.2% Widowed4.1% DivorcedWomen who gave birth in the past 12 months Now married:
73.6% (66)Unmarried:
26.4% (24)
Women who did not give birth in the past 12 months Now married:
43.7% (645)Unmarried:
56.3% (832)
Marital status - Two or more races population 15 years and over
Males 56.2% Never married35.5% Now married1.0% Separated0.7% Widowed6.5% DivorcedFemales 46.4% Never married33.9% Now married1.1% Separated8.0% Widowed10.7% DivorcedWomen who gave birth in the past 12 months Now married:
34.2% (152)Unmarried:
65.8% (293)
Women who did not give birth in the past 12 months Now married:
29.9% (4,071)Unmarried:
70.1% (9,549)
Marital status - White alone, not Hispanic / Latino population 15 years and over
Males 47.6% Never married40.1% Now married0.9% Separated1.5% Widowed9.9% DivorcedFemales 39.2% Never married39.1% Now married0.3% Separated6.9% Widowed14.5% DivorcedWomen who gave birth in the past 12 months Now married:
81.6% (475)Unmarried:
18.4% (107)
Women who did not give birth in the past 12 months Now married:
33.5% (4,218)Unmarried:
66.5% (8,373)
Marital status - Hispanic or Latino population 15 years and over
Males 58.5% Never married30.6% Now married0.7% Separated0.0% Widowed10.2% DivorcedFemales 44.9% Never married35.2% Now married2.8% Separated3.4% Widowed13.7% DivorcedWomen who gave birth in the past 12 months Now married:
100.0% (57)Unmarried:
0.0% (0)
Women who did not give birth in the past 12 months Now married:
34.5% (2,568)Unmarried:
65.5% (4,882)
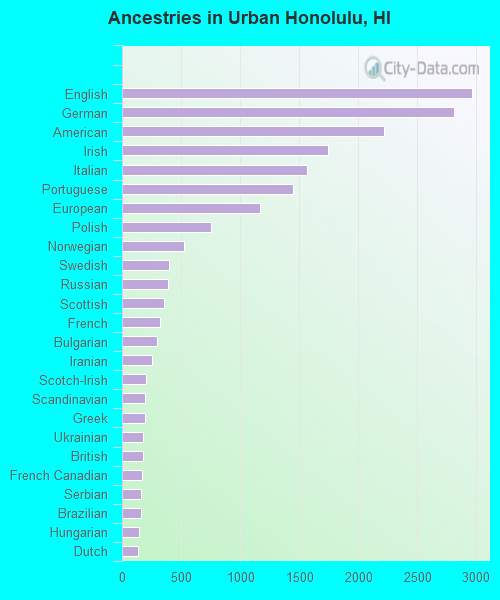
Ancestries in Urban Honolulu
2,960 1.5% English2,813 1.4% German2,217 1.1% American1,744 0.9% Irish1,567 0.8% Italian1,444 0.7% Portuguese1,171 0.6% European757 0.4% Polish521 0.3% Norwegian396 0.2% Swedish390 0.2% Russian354 0.2% Scottish319 0.2% French293 0.1% Bulgarian250 0.1% Iranian206 0.1% Scotch-Irish193 0.10% Scandinavian191 0.10% Greek177 0.09% Ukrainian176 0.09% British172 0.09% French Canadian165 0.08% Serbian158 0.08% Brazilian143 0.07% Hungarian135 0.07% Dutch123 0.06% Belizean111 0.06% Czech110 0.06% Afghan105 0.05% African103 0.05% Haitian103 0.05% Jamaican97 0.05% Canadian96 0.05% Northern European93 0.05% Danish83 0.04% Czechoslovakian80 0.04% Egyptian77 0.04% Austrian75 0.04% Kenyan73 0.04% Eastern European68 0.03% Swiss67 0.03% Lebanese56 0.03% West Indian47 0.02% Lithuanian46 0.02% Finnish42 0.02% Yugoslavian38 0.02% Australian35 0.02% Welsh34 0.02% Romanian33 0.02% Slavic33 0.02% Nigerian30 0.02% Armenian28 0.01% Syrian27 0.01% Slovak26 0.01% Arab25 0.01% Palestinian24 0.01% Slovene24 0.01% Belgian24 0.01% Israeli17 0.01% Estonian16 0.01% Bermudan15 0.01% Iraqi15 0.01% Trinidadian and Tobagonian14 0.01% New Zealander11 0.01% Croatian11 0.01% British West Indian11 0.01% German Russian10 0.01% Ghanaian10 0.01% Barbadian
Geographical mobility in Urban Honolulu Same house 1 year ago 43,636 72.4% White (Caucasian)3,362 62.0% Black or African American498 84.2% American Indian / Alaska Native158,831 90.2% Asian24,147 86.0% Native Hawaiian / Pacific Islander3,968 82.1% Other race52,839 83.5% Two or more races39,497 71.9% White alone, not Hispanic / Latino21,250 77.3% Hispanic or LatinoMoved within same county 6,638 11.0% White / Caucasian763 14.1% Black or African American61 10.3% American Indian / Alaska Native12,195 6.9% Asian3,255 11.6% Native Hawaiian / Pacific Islander261 5.4% Other race6,794 10.7% Two or more races6,220 11.3% White alone, not Hispanic / Latino2,680 9.8% Hispanic or LatinoMoved within same state 898 1.5% White / Caucasian200 3.7% Black or African American20 3.4% American Indian / Alaska Native814 0.5% Asian301 1.1% Native Hawaiian / Pacific Islander91 1.9% Other race262 0.4% Two or more races742 1.4% White alone, not Hispanic / Latino381 1.4% Hispanic or LatinoMoved from different state 8,071 13.4% White / Caucasian920 17.0% Black or African American24 4.1% American Indian / Alaska Native2,914 1.7% Asian326 1.2% Native Hawaiian / Pacific Islander390 8.1% Other race2,348 3.7% Two or more races7,501 13.7% White alone, not Hispanic / Latino2,582 9.4% Hispanic or LatinoMoved from abroad 1,019 1.7% White181 3.3% Black or African American38 6.4% American Indian / Alaska Native1,407 0.8% Asian56 0.2% Native Hawaiian / Pacific Islander77 1.6% Other race1,072 1.7% Two or more races950 1.7% White alone, not Hispanic / Latino587 2.1% Hispanic or Latino
Children Nativity (place of birth) in Urban Honolulu
Children under 6 years - Living with two parents Both parents native 6,115 100.0% NativeBoth parents foreign-born 3,284 98.0% Native66 2.0% Foreign-bornOne native, one foreign-born parent 1,688 93.2% Native124 6.8% Foreign-bornChildren under 6 years - Living with one parent Native parent 3,456 100.0% NativeForeign-born parent 1,222 87.2% Native180 12.8% Foreign-bornChildren 6 to 17 years - Living with two parents Both parents native 10,978 100.0% NativeBoth parents foreign-born 4,750 70.1% Native2,030 29.9% Foreign-bornOne native, one foreign-born parent 3,981 100.0% NativeChildren 6 to 17 years - Living with one parent Native parent 7,218 100.0% NativeForeign-born parent 4,030 51.7% Native3,765 48.3% Foreign-born
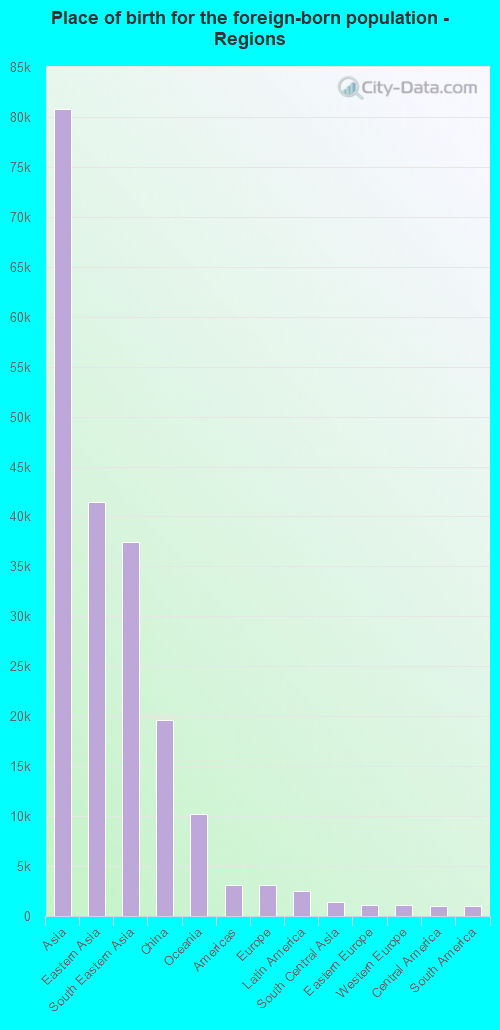
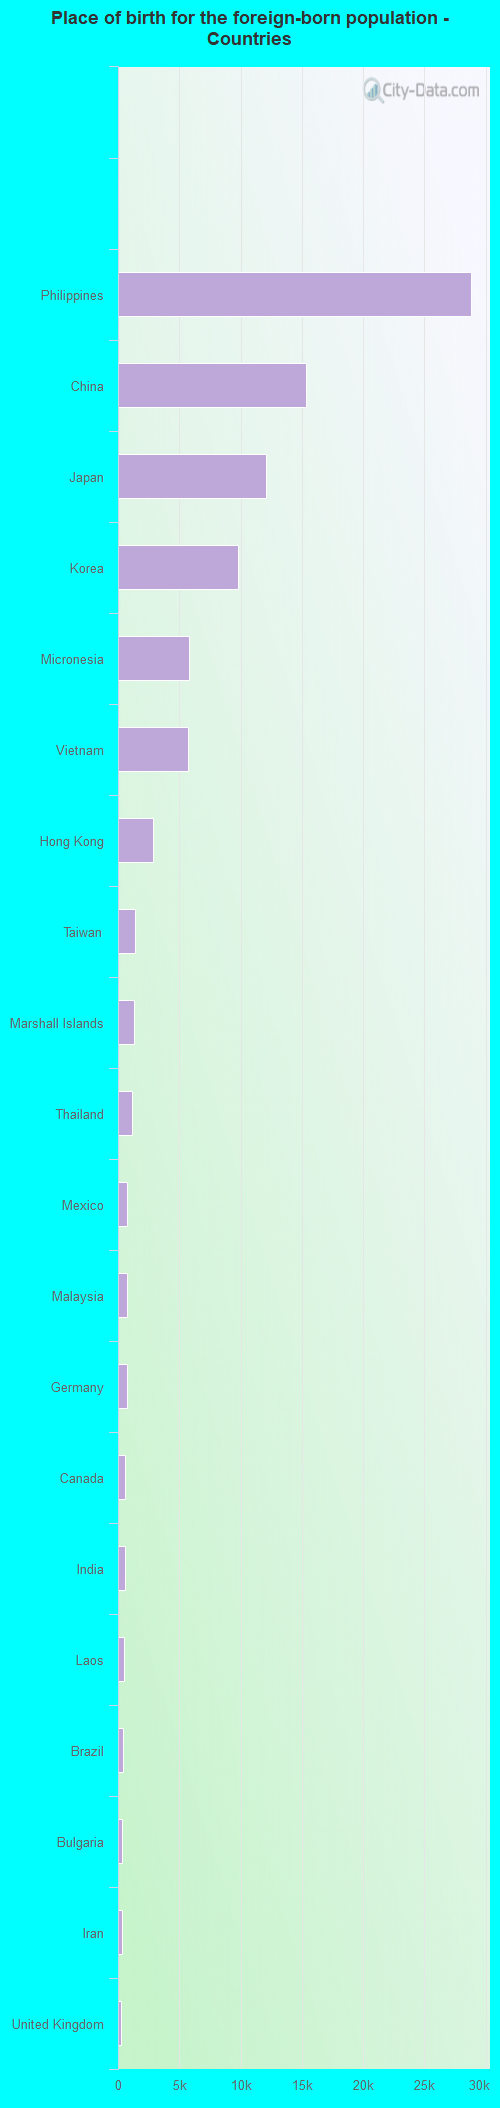
Place of birth for residents in Urban Honolulu 80,764 Asia41,478 Eastern Asia37,448 South Eastern Asia19,585 China10,188 Oceania3,088 Americas3,057 Europe2,471 Latin America1,402 South Central Asia1,115 Eastern Europe1,090 Western Europe1,008 Central America959 South America697 Northern Europe617 Northern America502 Caribbean496 Africa406 Australia and New Zealand Subregion282 Western Asia154 Southern Europe128 Eastern Africa103 Middle Africa96 Southern Africa84 Western Africa83 Northern Africa28,831 Philippines15,362 China12,075 Japan9,756 Korea5,767 Micronesia5,728 Vietnam2,837 Hong Kong1,385 Taiwan1,339 Marshall Islands1,114 Thailand774 Mexico749 Malaysia718 Germany588 Canada568 India463 Laos368 Brazil321 Bulgaria320 Iran283 United Kingdom247 Australia241 Russia198 England197 France176 Fiji169 Singapore160 Indonesia159 New Zealand154 Colombia142 Haiti134 Cambodia117 Venezuela111 Turkey107 Poland106 Jamaica105 Chile103 Cameroon97 Bhutan96 South Africa95 Nepal95 Sri Lanka95 Israel95 Serbia94 Italy85 Nicaragua80 Burma (Myanmar)77 Switzerland77 Ukraine75 Ireland75 Peru74 Egypt71 Trinidad and Tobago71 Cuba70 Norway68 Argentina68 Bangladesh67 Lithuania67 Dominican Republic66 Kenya64 Sweden63 Romania60 Belize60 Ecuador55 Austria52 Pakistan47 Afghanistan44 El Salvador39 Czechoslovakia37 Hungary36 Spain32 Saudi Arabia30 Kazakhstan29 Nigeria29 Iraq29 Eritrea29 Grenada25 Uzbekistan24 Panama24 Belgium20 Sierra Leone19 Cabo Verde17 Netherlands17 Ethiopia14 Portugal10 Guatemala9 Jordan9 Bosnia and Herzegovina9 Costa Rica9 Sudan8 Liberia8 Greece5 Zimbabwe4 Latvia4 Albania3 Denmark2 United Arab Emirates2 Georgia2 Scotland1 Dominica
Grandparents responsible for own grandchildren in Urban Honolulu
Grandparents (30 to 59 years) White / Caucasian 7 7.2% Responsible for grandchildren87 92.8% Not responsible for grandchildrenBlack or African American 88 100.0% Not responsible for grandchildrenAmerican Indian / Alaska Native 10 100.0% Responsible for grandchildrenAsian 254 16.7% Responsible for grandchildren1,263 83.3% Not responsible for grandchildrenNative Hawaiian / Pacific Islander 211 49.7% Responsible for grandchildren213 50.3% Not responsible for grandchildrenTwo or more races 68 20.4% Responsible for grandchildren266 79.6% Not responsible for grandchildrenWhite alone, not Hispanic / Latino 4 3.8% Responsible for grandchildren97 96.2% Not responsible for grandchildrenHispanic or Latino 44 34.7% Responsible for grandchildren82 65.3% Not responsible for grandchildrenGrandparents (60 years and over) White / Caucasian 51 17.5% Responsible for grandchildren238 82.5% Not responsible for grandchildrenBlack or African American 12 31.7% Responsible for grandchildren27 68.3% Not responsible for grandchildrenAmerican Indian / Alaska Native 8 100.0% Not responsible for grandchildrenAsian 245 5.7% Responsible for grandchildren4,088 94.3% Not responsible for grandchildrenNative Hawaiian / Pacific Islander 479 52.9% Responsible for grandchildren426 47.1% Not responsible for grandchildrenTwo or more races 267 24.8% Responsible for grandchildren809 75.2% Not responsible for grandchildrenWhite alone, not Hispanic / Latino 38 14.5% Responsible for grandchildren223 85.5% Not responsible for grandchildrenHispanic or Latino 81 24.3% Responsible for grandchildren252 75.7% Not responsible for grandchildren