Races in Ute Mountain, Colorado (CO) Detailed Stats
Ancestries, Foreign-born residents, place of birth
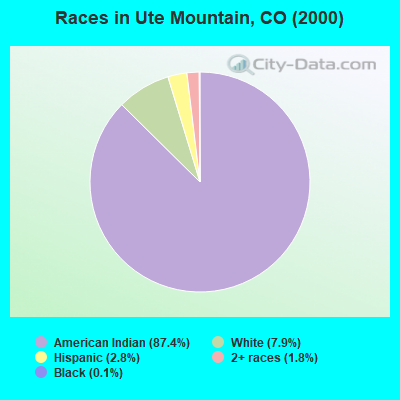
Race distribution in Ute Mountain

- 1,32287.4%American Indian alone
- 1197.9%White alone
- 432.8%Hispanic
- 271.8%Two or more races
- 20.1%Black alone
2000
2022
-
- 3,202,88074.5%White alone
- 735,60117.1%Hispanic
- 158,4433.7%Black alone
- 93,2772.2%Asian alone
- 72,7211.7%Two or more races
- 28,9820.7%American Indian alone
- 5,5120.1%Other race alone
- 3,8450.09%Native Hawaiian and Other
Pacific Islander alone

-
- 3,793,27065.0%White alone
- 1,314,96222.5%Hispanic
- 268,7544.6%Two or more races
- 220,7563.8%Black alone
- 182,6583.1%Asian alone
- 29,7980.5%Other race alone
- 23,3890.4%American Indian alone
- 6,3390.1%Native Hawaiian and Other
Pacific Islander alone

Income and house value in Ute Mountain
- Median household income in 2022
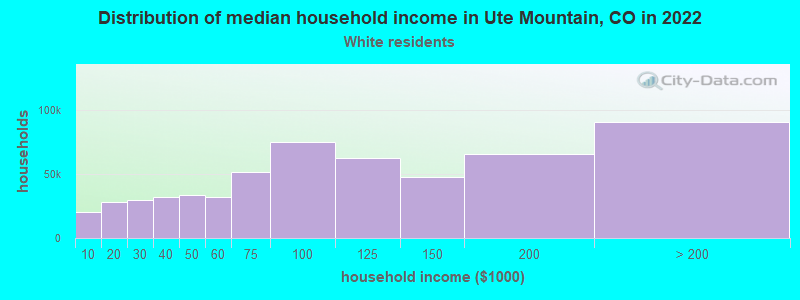
- $56,638White non-Hispanic householders
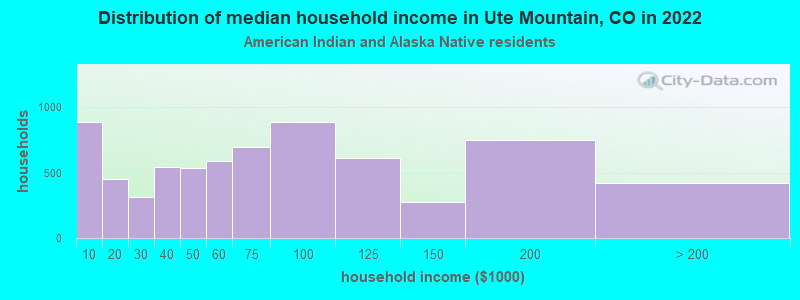
- $38,530American Indian and Alaska Native householders
- $88,995Some other race householders
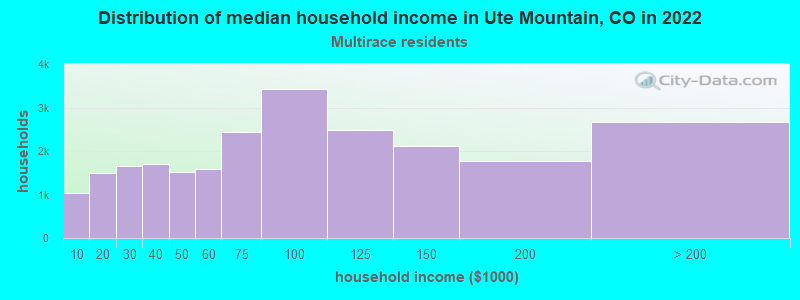
- $13,566Two or more races householders
- $13,852Hispanic or Latino race householders
- Median 2022 house value
- $139,990American Indian or Alaska Native householders
- over $1,000,000Two or more races householders
- $33,169Hispanic or Latino householders
Household income for White non-Hispanic householders
Household income for American Indian and Alaska Native householders
Household income for Two or more races householders
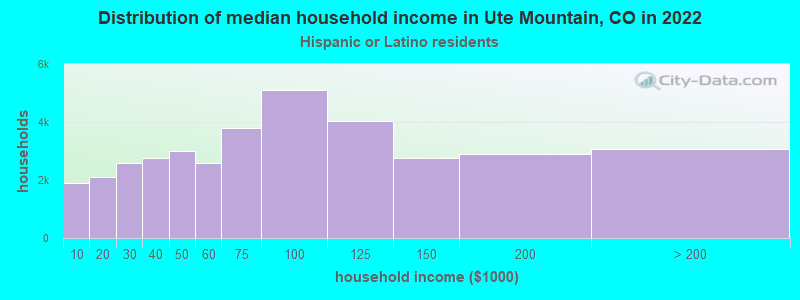
Household income for Hispanic or Latino race householders
Zip code: 81334