Races in Vinland, Wisconsin (WI) Detailed Stats
Ancestries, Foreign-born residents, place of birth
1.1% of Vinland, WI residents are foreign-born , which is 340.2% less than the foreign-born rate of 5.0% across the entire state of Wisconsin.
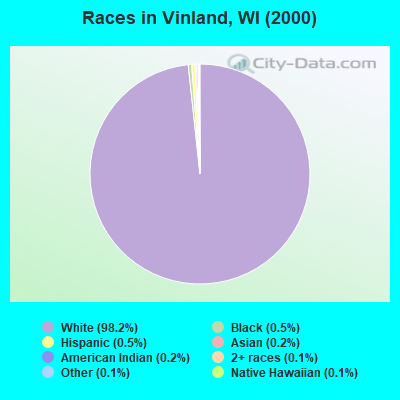
Race distribution in Vinland

- 1,81698.2%White alone
- 90.5%Hispanic
- 100.5%Black alone
- 40.2%Asian alone
- 40.2%American Indian alone
- 20.1%Two or more races
- 20.1%Other race alone
- 20.1%Native Hawaiian and Other
Pacific Islander alone
2000
2022
-
- 4,681,63087.3%White alone
- 300,2455.6%Black alone
- 192,9213.6%Hispanic
- 87,9951.6%Asian alone
- 51,9211.0%Two or more races
- 43,9800.8%American Indian alone
- 3,6370.07%Other race alone
- 1,3460.03%Native Hawaiian and Other
Pacific Islander alone

-
- 4,654,03179.0%White alone
- 447,0227.6%Hispanic
- 345,6785.9%Black alone
- 217,5323.7%Two or more races
- 172,2422.9%Asian alone
- 33,7620.6%American Indian alone
- 19,6800.3%Other race alone
- 2,5920.04%Native Hawaiian and Other
Pacific Islander alone

Income and house value in Vinland
- Median household income in 2022
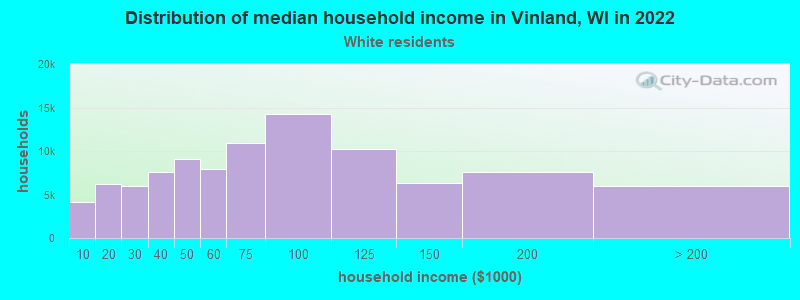
- $102,060White non-Hispanic householders
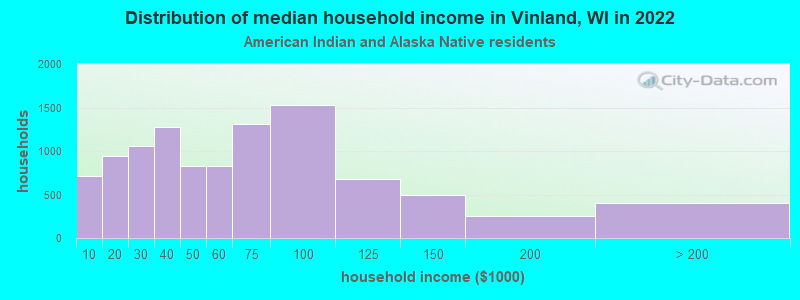
- $69,416American Indian and Alaska Native householders
- $139,527Some other race householders
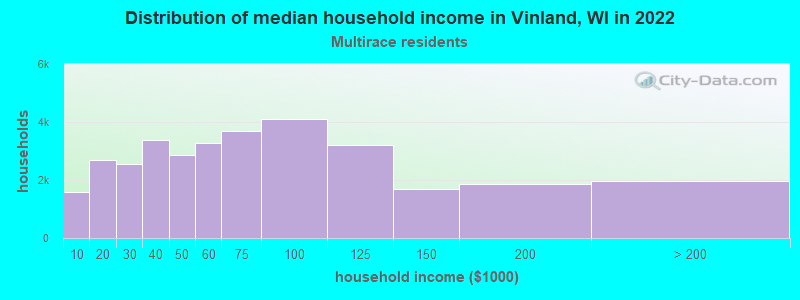
- $35,416Two or more races householders
- $80,201Hispanic or Latino race householders
- Median 2022 house value
- $297,129White Non-Hispanic householders
- $267,010American Indian or Alaska Native householders
- $293,711Some other race householders
- $293,711Two or more races householders
- $293,711Hispanic or Latino householders
Household income for White non-Hispanic householders
Household income for American Indian and Alaska Native householders
Household income for Two or more races householders
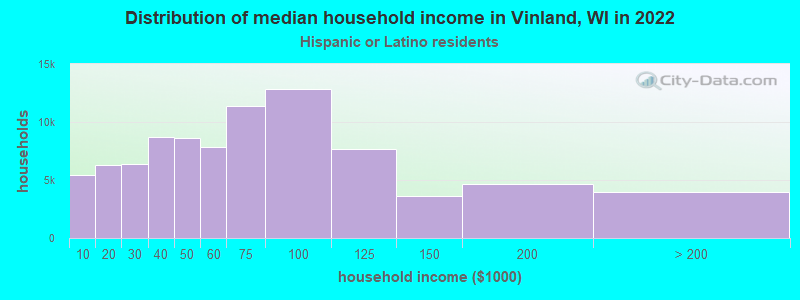
Household income for Hispanic or Latino race householders
Foreign-born residents in Vinland
21 residents are foreign born
| This city: | 1.1% |
| Wisconsin: | 3.6% |
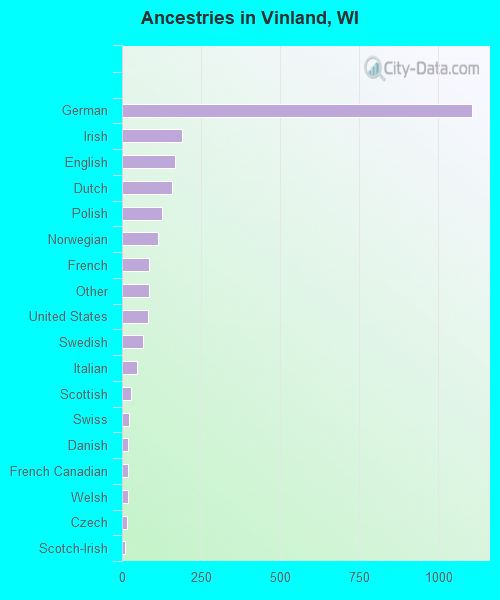
Ancestries in Vinland

- 1,10646.5%German
- 1918.0%Irish
- 1677.0%English
- 1576.6%Dutch
- 1255.3%Polish
- 1144.8%Norwegian
- 873.7%French
- 843.5%Other
- 813.4%United States
- 662.8%Swedish
- 461.9%Italian
- 301.3%Scottish
- 220.9%Swiss
- 200.8%Danish
- 200.8%French Canadian
- 180.8%Welsh
- 150.6%Czech
- 110.5%Scotch-Irish
- 70.3%Russian
- 50.2%Lithuanian
- 20.08%Arab
- 20.08%Greek
- 20.08%Hungarian
- 20.08%Slovak
Zip codes: 54904.