Races in Virginia City, Nevada (NV) Detailed Stats
Ancestries, Foreign-born residents, place of birth
Data:
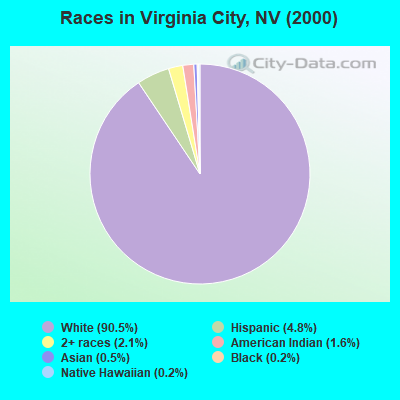
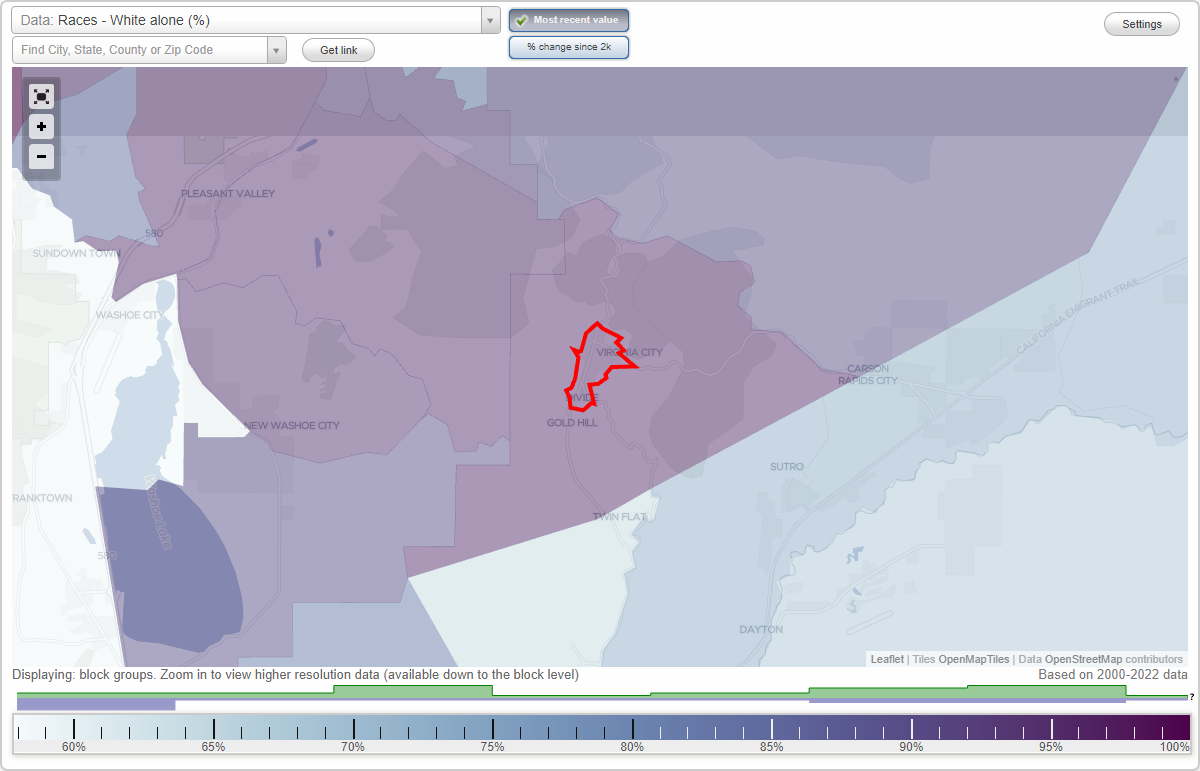
Race distribution in Virginia City

- 2,27790.5%White alone
- 1224.8%Hispanic
- 542.1%Two or more races
- 411.6%American Indian alone
- 120.5%Asian alone
- 50.2%Black alone
- 40.2%Native Hawaiian and Other
Pacific Islander alone
- 20.08%Other race alone
2000
2022
-
- 1,303,00165.2%White alone
- 393,97019.7%Hispanic
- 131,5096.6%Black alone
- 88,5934.4%Asian alone
- 49,2312.5%Two or more races
- 21,3971.1%American Indian alone
- 7,7690.4%Native Hawaiian and Other
Pacific Islander alone
- 2,7870.1%Other race alone
-
- 1,410,14544.4%White alone
- 961,35730.3%Hispanic
- 286,4719.0%Black alone
- 281,1498.8%Asian alone
- 182,1515.7%Two or more races
- 20,1020.6%Native Hawaiian and Other
Pacific Islander alone
- 18,7810.6%Other race alone
- 17,6160.6%American Indian alone
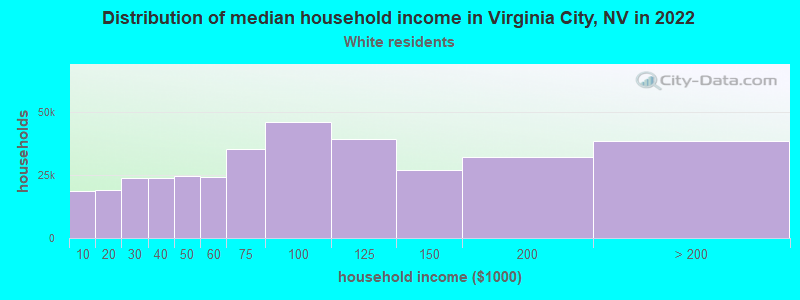
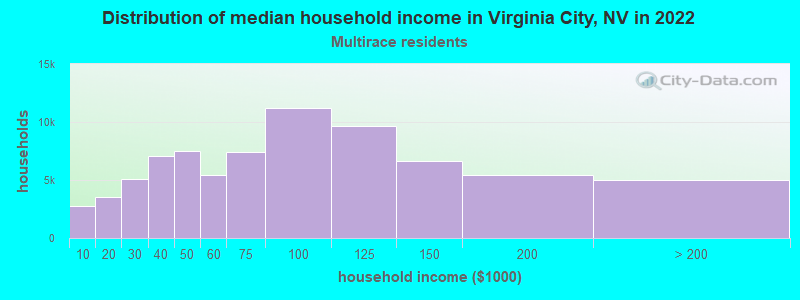
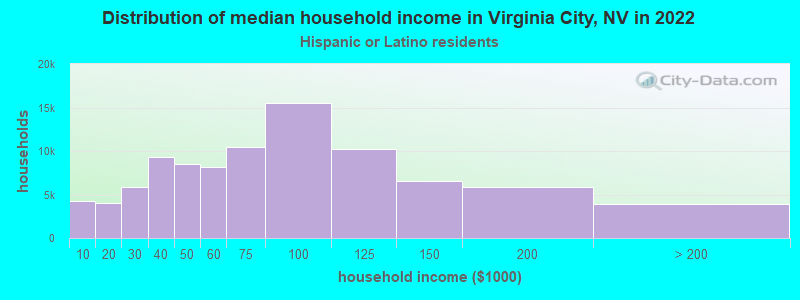
Income and house value in Virginia City
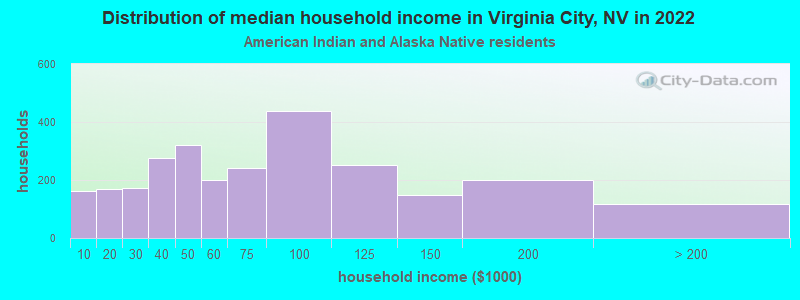
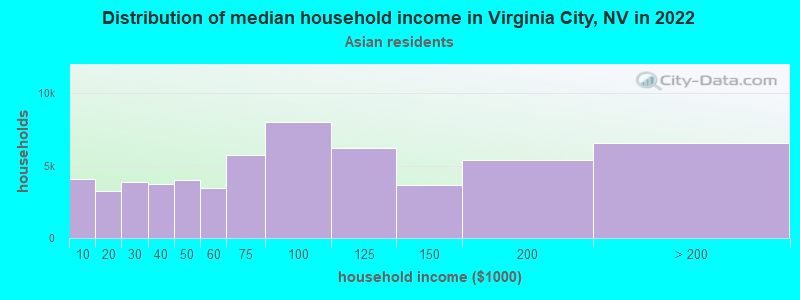
- Median household income in 2022
- $83,279White non-Hispanic householders
- $20,573American Indian and Alaska Native householders
- $30,599Asian householders
- $44,907Some other race householders
- $112,047Two or more races householders
- $77,537Hispanic or Latino race householders
- Median 2022 house value
- $437,424White Non-Hispanic householders
- $550,600American Indian or Alaska Native householders
- $389,041Two or more races householders
- $389,041Hispanic or Latino householders