Races in Westerville, Ohio (OH) Detailed Stats
Data:
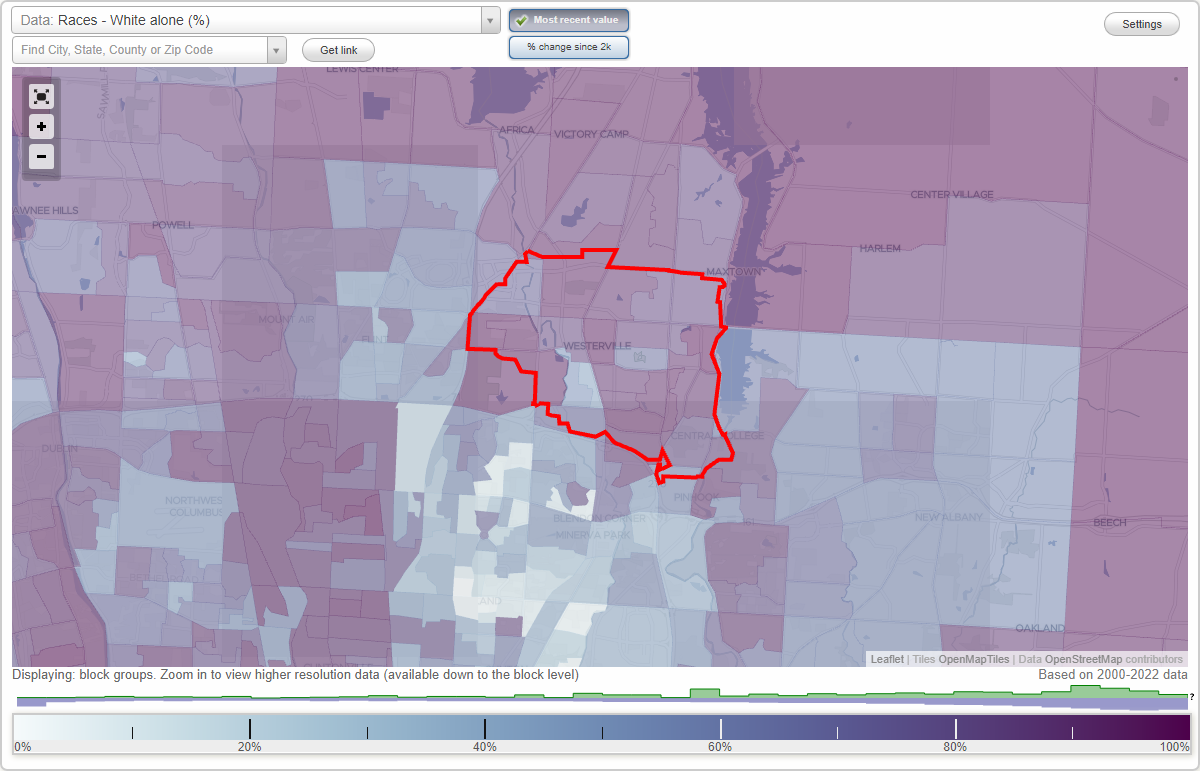
Races - White alone (%)
Races - White alone (% change since 2000)
Races - Black alone (%)
Races - Black alone (% change since 2000)
Races - American Indian alone (%)
Races - American Indian alone (% change since 2000)
Races - Asian alone (%)
Races - Asian alone (% change since 2000)
Races - Hispanic (%)
Races - Hispanic (% change since 2000)
Races - Native Hawaiian and Other Pacific Islander alone (%)
Races - Native Hawaiian and Other Pacific Islander alone (% change since 2000)
Races - Two or more races(%)
Races - Two or more races(% change since 2000)
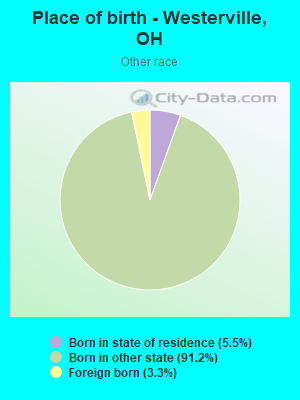
Races - Other race alone (%)
Races - Other race alone (% change since 2000)
Racial diversity
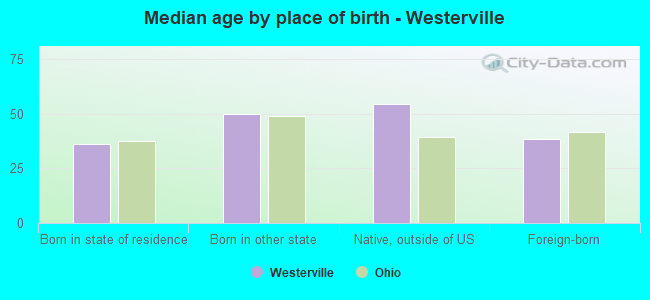
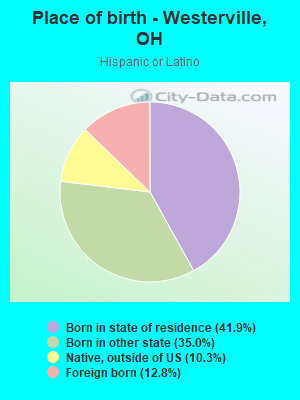
Place of birth - Born in state of residence (%)
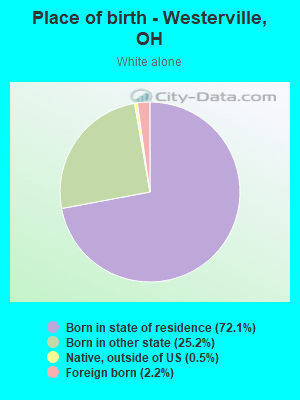
Place of birth - Born in state of residence (%) - White
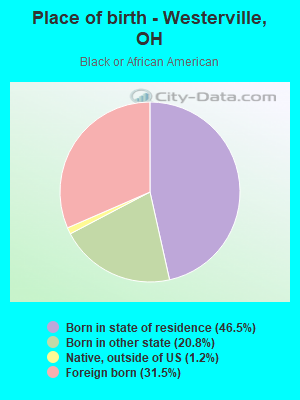
Place of birth - Born in state of residence (%) - Black or African American
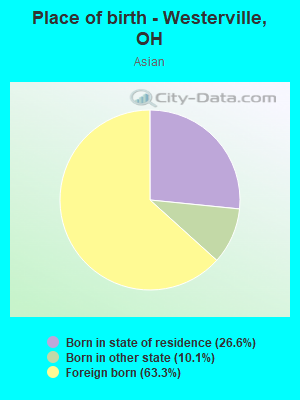
Place of birth - Born in state of residence (%) - Asian
Place of birth - Born in state of residence (%) - Hispanic or Latino
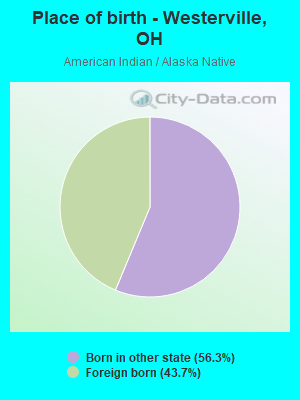
Place of birth - Born in state of residence (%) - American Indian and Alaska Native
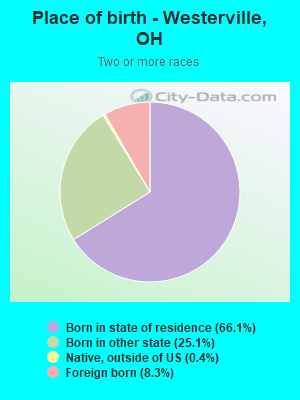
Place of birth - Born in state of residence (%) - Multirace
Place of birth - Born in state of residence (%) - Other Race
Place of birth - Born in other state (%)
Place of birth - Born in other state (%) - White
Place of birth - Born in other state (%) - Black or African American
Place of birth - Born in other state (%) - Asian
Place of birth - Born in other state (%) - Hispanic or Latino
Place of birth - Born in other state (%) - American Indian and Alaska Native
Place of birth - Born in other state (%) - Multirace
Place of birth - Born in other state (%) - Other Race
Place of birth - Native, outside of US (%)
Place of birth - Native, outside of US (%) - White
Place of birth - Native, outside of US (%) - Black or African American
Place of birth - Native, outside of US (%) - Asian
Place of birth - Native, outside of US (%) - Hispanic or Latino
Place of birth - Native, outside of US (%) - American Indian and Alaska Native
Place of birth - Native, outside of US (%) - Multirace
Place of birth - Native, outside of US (%) - Other Race
Place of birth - Foreign born (%)
Place of birth - Foreign born (%) - White
Place of birth - Foreign born (%) - Black or African American
Place of birth - Foreign born (%) - Asian
Place of birth - Foreign born (%) - Hispanic or Latino
Place of birth - Foreign born (%) - American Indian and Alaska Native
Place of birth - Foreign born (%) - Multirace
Place of birth - Foreign born (%) - Other Race
Residents speaking English at home (%)
Residents speaking English at home - Born in the United States (%)
Residents speaking English at home - Native, born elsewhere (%)
Residents speaking English at home - Foreign born (%)
Residents speaking Spanish at home (%)
Residents speaking Spanish at home - Born in the United States (%)
Residents speaking Spanish at home - Native, born elsewhere (%)
Residents speaking Spanish at home - Foreign born (%)
Residents speaking other language at home (%)
Residents speaking other language at home - Born in the United States (%)
Residents speaking other language at home - Native, born elsewhere (%)
Residents speaking other language at home - Foreign born (%)
Marital status - Never married (%)
Marital status - Now married (%)
Marital status - Separated (%)
Marital status - Widowed (%)
Marital status - Divorced (%)
Ancestries Reported - Arab (%)
Ancestries Reported - Czech (%)
Ancestries Reported - Danish (%)
Ancestries Reported - Dutch (%)
Ancestries Reported - English (%)
Ancestries Reported - French (%)
Ancestries Reported - French Canadian (%)
Ancestries Reported - German (%)
Ancestries Reported - Greek (%)
Ancestries Reported - Hungarian (%)
Ancestries Reported - Irish (%)
Ancestries Reported - Italian (%)
Ancestries Reported - Lithuanian (%)
Ancestries Reported - Norwegian (%)
Ancestries Reported - Polish (%)
Ancestries Reported - Portuguese (%)
Ancestries Reported - Russian (%)
Ancestries Reported - Scotch-Irish (%)
Ancestries Reported - Scottish (%)
Ancestries Reported - Slovak (%)
Ancestries Reported - Subsaharan African (%)
Ancestries Reported - Swedish (%)
Ancestries Reported - Swiss (%)
Ancestries Reported - Ukrainian (%)
Ancestries Reported - United States (%)
Ancestries Reported - Welsh (%)
Ancestries Reported - West Indian (%)
Ancestries Reported - Other (%)
Geographical mobility - Same house 1 year ago (%)
Geographical mobility - Same house 1 year ago (%) - White
Geographical mobility - Same house 1 year ago (%) - Black or African American
Geographical mobility - Same house 1 year ago (%) - Asian
Geographical mobility - Same house 1 year ago (%) - Hispanic or Latino
Geographical mobility - Same house 1 year ago (%) - American Indian and Alaska Native
Geographical mobility - Same house 1 year ago (%) - Multirace
Geographical mobility - Same house 1 year ago (%) - Other Race
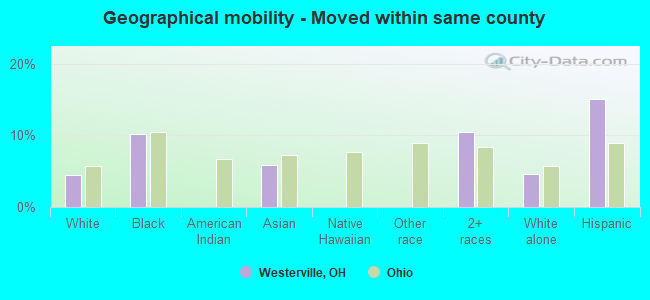
Geographical mobility - Moved within same county (%)
Geographical mobility - Moved within same county (%) - White
Geographical mobility - Moved within same county (%) - Black or African American
Geographical mobility - Moved within same county (%) - Asian
Geographical mobility - Moved within same county (%) - Hispanic or Latino
Geographical mobility - Moved within same county (%) - American Indian and Alaska Native
Geographical mobility - Moved within same county (%) - Multirace
Geographical mobility - Moved within same county (%) - Other Race
Geographical mobility - Moved from different county within same state (%)
Geographical mobility - Moved from different county within same state (%) - White
Geographical mobility - Moved from different county within same state (%) - Black or African American
Geographical mobility - Moved from different county within same state (%) - Asian
Geographical mobility - Moved from different county within same state (%) - Hispanic or Latino
Geographical mobility - Moved from different county within same state (%) - American Indian and Alaska Native
Geographical mobility - Moved from different county within same state (%) - Multirace
Geographical mobility - Moved from different county within same state (%) - Other Race
Geographical mobility - Moved from different state (%)
Geographical mobility - Moved from different state (%) - White
Geographical mobility - Moved from different state (%) - Black or African American
Geographical mobility - Moved from different state (%) - Asian
Geographical mobility - Moved from different state (%) - Hispanic or Latino
Geographical mobility - Moved from different state (%) - American Indian and Alaska Native
Geographical mobility - Moved from different state (%) - Multirace
Geographical mobility - Moved from different state (%) - Other Race
Geographical mobility - Moved from abroad (%)
Geographical mobility - Moved from abroad (%) - White
Geographical mobility - Moved from abroad (%) - Black or African American
Geographical mobility - Moved from abroad (%) - Asian
Geographical mobility - Moved from abroad (%) - Hispanic or Latino
Geographical mobility - Moved from abroad (%) - American Indian and Alaska Native
Geographical mobility - Moved from abroad (%) - Multirace
Geographical mobility - Moved from abroad (%) - Other Race
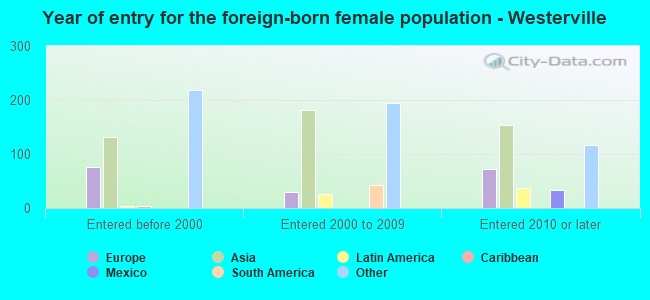
Place of birth for the foreign-born population - Ireland (%)
Place of birth for the foreign-born population - Denmark (%)
Place of birth for the foreign-born population - Norway (%)
Place of birth for the foreign-born population - Sweden (%)
Place of birth for the foreign-born population - United Kingdom (%)
Place of birth for the foreign-born population - England (%)
Place of birth for the foreign-born population - Scotland (%)
Place of birth for the foreign-born population - Other Northern Europe (%)
Place of birth for the foreign-born population - Austria (%)
Place of birth for the foreign-born population - Belgium (%)
Place of birth for the foreign-born population - France (%)
Place of birth for the foreign-born population - Germany (%)
Place of birth for the foreign-born population - Netherlands (%)
Place of birth for the foreign-born population - Switzerland (%)
Place of birth for the foreign-born population - Other Western Europe (%)
Place of birth for the foreign-born population - Greece (%)
Place of birth for the foreign-born population - Italy (%)
Place of birth for the foreign-born population - Portugal (%)
Place of birth for the foreign-born population - Spain (%)
Place of birth for the foreign-born population - Other Southern Europe (%)
Place of birth for the foreign-born population - Albania (%)
Place of birth for the foreign-born population - Belarus (%)
Place of birth for the foreign-born population - Bosnia and Herzegovina (%)
Place of birth for the foreign-born population - Bulgaria (%)
Place of birth for the foreign-born population - Croatia (%)
Place of birth for the foreign-born population - Czechoslovakia (%)
Place of birth for the foreign-born population - Hungary (%)
Place of birth for the foreign-born population - Latvia (%)
Place of birth for the foreign-born population - Lithuania (%)
Place of birth for the foreign-born population - North Macedonia (Macedonia) (%)
Place of birth for the foreign-born population - Moldova (%)
Place of birth for the foreign-born population - Poland (%)
Place of birth for the foreign-born population - Romania (%)
Place of birth for the foreign-born population - Russia (%)
Place of birth for the foreign-born population - Serbia (%)
Place of birth for the foreign-born population - Ukraine (%)
Place of birth for the foreign-born population - Other Eastern Europe (%)
Place of birth for the foreign-born population - China (%)
Place of birth for the foreign-born population - Hong Kong (%)
Place of birth for the foreign-born population - Taiwan (%)
Place of birth for the foreign-born population - Japan (%)
Place of birth for the foreign-born population - Korea (%)
Place of birth for the foreign-born population - Other Eastern Asia (%)
Place of birth for the foreign-born population - Afghanistan (%)
Place of birth for the foreign-born population - Bangladesh (%)
Place of birth for the foreign-born population - India (%)
Place of birth for the foreign-born population - Iran (%)
Place of birth for the foreign-born population - Kazakhstan (%)
Place of birth for the foreign-born population - Nepal (%)
Place of birth for the foreign-born population - Pakistan (%)
Place of birth for the foreign-born population - Sri Lanka (%)
Place of birth for the foreign-born population - Uzbekistan (%)
Place of birth for the foreign-born population - Other South Central Asia (%)
Place of birth for the foreign-born population - Burma (%)
Place of birth for the foreign-born population - Cambodia (%)
Place of birth for the foreign-born population - Indonesia (%)
Place of birth for the foreign-born population - Laos (%)
Place of birth for the foreign-born population - Malaysia (%)
Place of birth for the foreign-born population - Philippines (%)
Place of birth for the foreign-born population - Singapore (%)
Place of birth for the foreign-born population - Thailand (%)
Place of birth for the foreign-born population - Vietnam (%)
Place of birth for the foreign-born population - Other South Eastern Asia (%)
Place of birth for the foreign-born population - Armenia (%)
Place of birth for the foreign-born population - Iraq (%)
Place of birth for the foreign-born population - Israel (%)
Place of birth for the foreign-born population - Jordan (%)
Place of birth for the foreign-born population - Kuwait (%)
Place of birth for the foreign-born population - Lebanon (%)
Place of birth for the foreign-born population - Saudi Arabia (%)
Place of birth for the foreign-born population - Syria (%)
Place of birth for the foreign-born population - Turkey (%)
Place of birth for the foreign-born population - Yemen (%)
Place of birth for the foreign-born population - Other Western Asia (%)
Place of birth for the foreign-born population - Eritrea (%)
Place of birth for the foreign-born population - Ethiopia (%)
Place of birth for the foreign-born population - Kenya (%)
Place of birth for the foreign-born population - Somalia (%)
Place of birth for the foreign-born population - Uganda (%)
Place of birth for the foreign-born population - Zimbabwe (%)
Place of birth for the foreign-born population - Other Eastern Africa (%)
Place of birth for the foreign-born population - Cameroon (%)
Place of birth for the foreign-born population - Congo (%)
Place of birth for the foreign-born population - Democratic Republic of Congo (Zaire) (%)
Place of birth for the foreign-born population - Other Middle Africa (%)
Place of birth for the foreign-born population - Egypt (%)
Place of birth for the foreign-born population - Morocco (%)
Place of birth for the foreign-born population - Sudan (%)
Place of birth for the foreign-born population - Other Northern Africa (%)
Place of birth for the foreign-born population - South Africa (%)
Place of birth for the foreign-born population - Other Southern Africa (%)
Place of birth for the foreign-born population - Cabo Verde (%)
Place of birth for the foreign-born population - Ghana (%)
Place of birth for the foreign-born population - Liberia (%)
Place of birth for the foreign-born population - Nigeria (%)
Place of birth for the foreign-born population - Senegal (%)
Place of birth for the foreign-born population - Sierra Leone (%)
Place of birth for the foreign-born population - Other Western Africa (%)
Place of birth for the foreign-born population - Australia (%)
Place of birth for the foreign-born population - New Zealand (%)
Place of birth for the foreign-born population - Fiji (%)
Place of birth for the foreign-born population - Micronesia (%)
Place of birth for the foreign-born population - Bahamas (%)
Place of birth for the foreign-born population - Barbados (%)
Place of birth for the foreign-born population - Cuba (%)
Place of birth for the foreign-born population - Dominica (%)
Place of birth for the foreign-born population - Dominican Republic (%)
Place of birth for the foreign-born population - Grenada (%)
Place of birth for the foreign-born population - Haiti (%)
Place of birth for the foreign-born population - Jamaica (%)
Place of birth for the foreign-born population - St. Vincent and the Grenadines (%)
Place of birth for the foreign-born population - Trinidad and Tobago (%)
Place of birth for the foreign-born population - West Indies (%)
Place of birth for the foreign-born population - Other Caribbean (%)
Place of birth for the foreign-born population - Belize (%)
Place of birth for the foreign-born population - Costa Rica (%)
Place of birth for the foreign-born population - El Salvador (%)
Place of birth for the foreign-born population - Guatemala (%)
Place of birth for the foreign-born population - Honduras (%)
Place of birth for the foreign-born population - Mexico (%)
Place of birth for the foreign-born population - Nicaragua (%)
Place of birth for the foreign-born population - Panama (%)
Place of birth for the foreign-born population - Other Central America (%)
Place of birth for the foreign-born population - Argentina (%)
Place of birth for the foreign-born population - Bolivia (%)
Place of birth for the foreign-born population - Brazil (%)
Place of birth for the foreign-born population - Chile (%)
Place of birth for the foreign-born population - Colombia (%)
Place of birth for the foreign-born population - Ecuador (%)
Place of birth for the foreign-born population - Guyana (%)
Place of birth for the foreign-born population - Peru (%)
Place of birth for the foreign-born population - Uruguay (%)
Place of birth for the foreign-born population - Venezuela (%)
Place of birth for the foreign-born population - Other South America (%)
Place of birth for the foreign-born population - Canada (%)
Place of birth for the foreign-born population - Other Northern America (%)
Place of birth for the foreign-born population - Other (%)
Latest news about races in Westerville, OH collected exclusively by city-data.com from local newspapers, TV, and radio stations
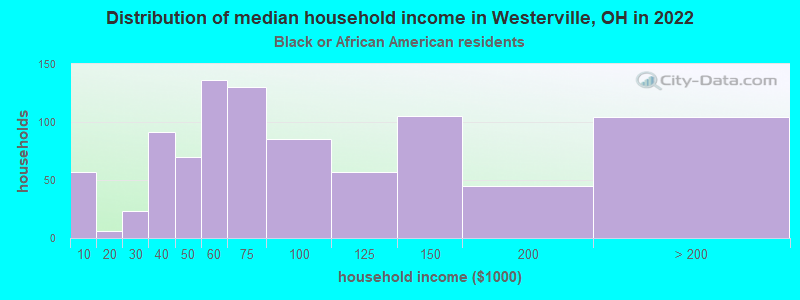
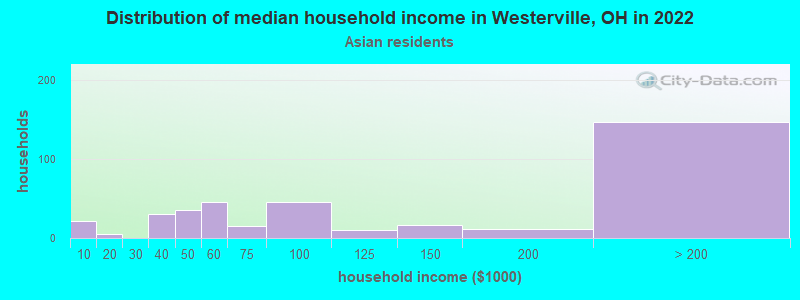
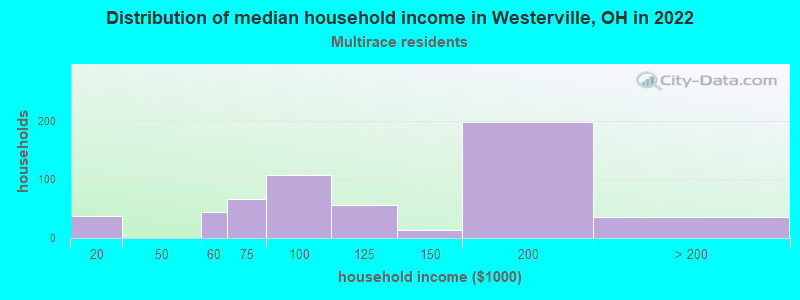
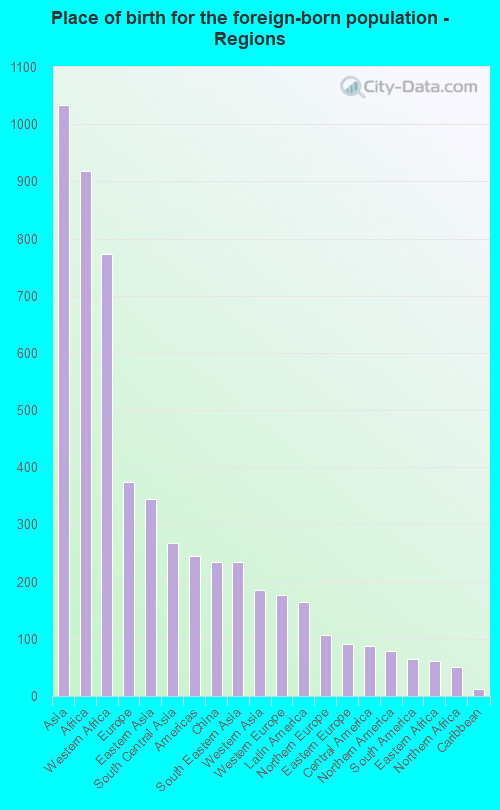
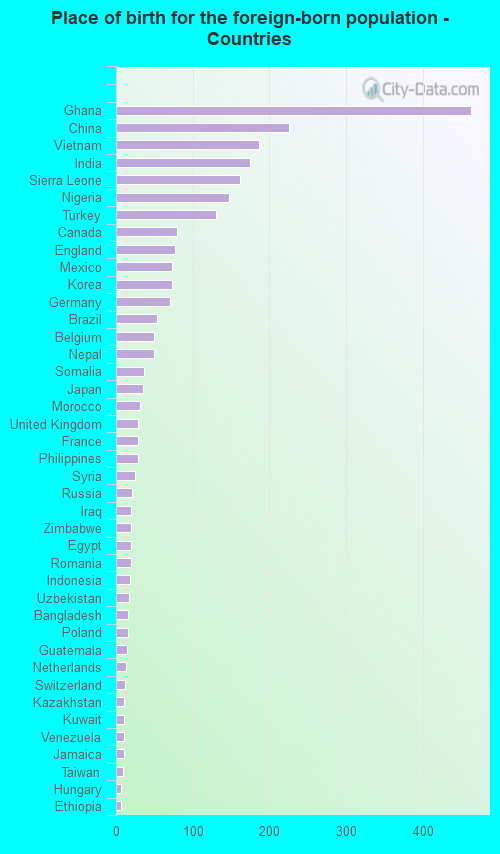
According to 2022 data, the most numerous races in Westerville, OH are White alone (31,628 residents), Black alone (2,619 residents), and Two or more races (2,456 residents). 91.1% of Westerville residents speak English at home. 6.6% of Westerville, OH residents are foreign-born (2.6% born in Asia, 2.3% born in Africa, 0.9% born in Europe), which is 39.3% greater than the foreign-born rate of 4.0% across the entire state of Ohio.
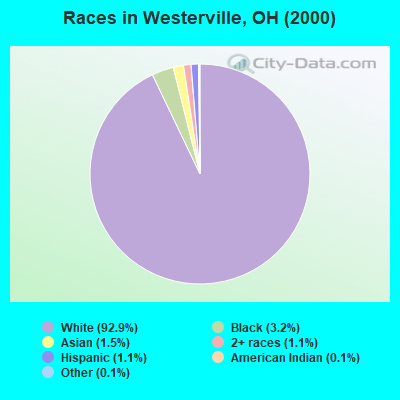
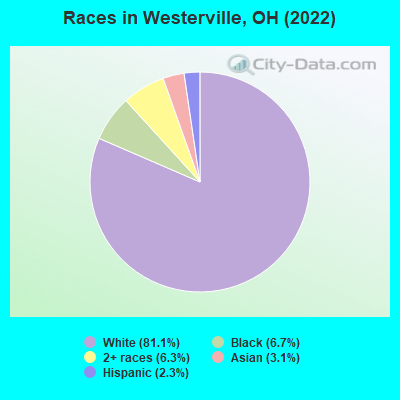
Race distribution in Westerville
2000 2022
9,538,111 84.0% White alone 1,290,662 11.4% Black alone 217,123 1.9% Hispanic 137,770 1.2% Two or more races 131,670 1.2% Asian alone 21,985 0.2% American Indian alone 13,483 0.1% Other race alone 2,336 0.02% Native Hawaiian and Other
8,948,793 76.1% White alone 1,401,403 11.9% Black alone 529,291 4.5% Two or more races 517,232 4.4% Hispanic 293,387 2.5% Asian alone 52,805 0.4% Other race alone 9,785 0.08% American Indian alone 3,362 0.03% Native Hawaiian and Other
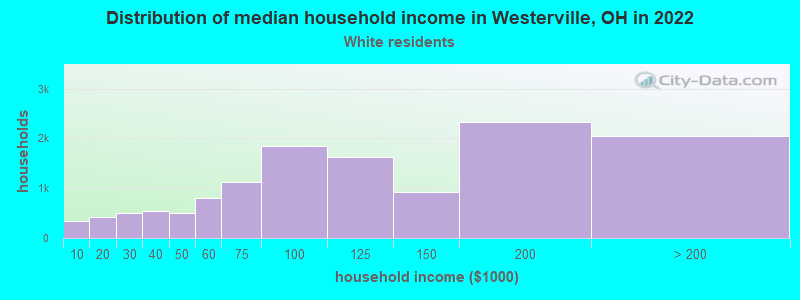
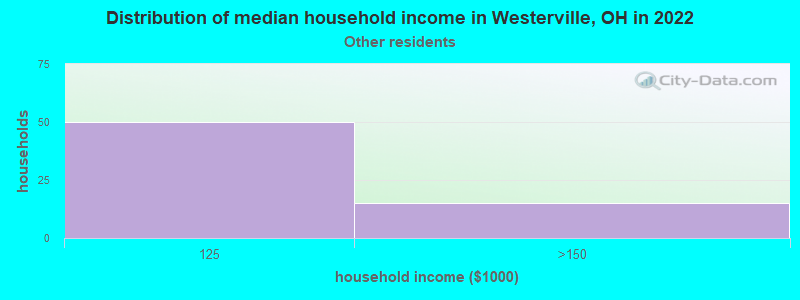
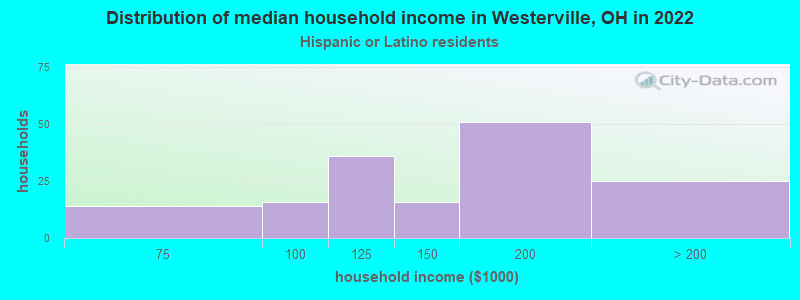
Income and house value in Westerville Median household income in 2022 $103,718 White non-Hispanic householders$65,643 Black householders$100,949 Asian householders$124,987 Some other race householders$116,554 Two or more races householders$108,774 Hispanic or Latino race householdersMedian 2022 house value $370,466 White Non-Hispanic householders$420,984 Black or African American householders $447,743 Asian householders$63,436 Some other race householders$468,273 Two or more races householders$415,217 Hispanic or Latino householders
Median age by race in Westerville
44.1 Median age for White residents42.9 44.8 35.3 Median age for Black or African American residents35.7 35.2 43.0 Median age for American Indian / Alaska Native residents18.8 -732,121,211.4 36.4 Median age for Asian residents35.8 36.5 -497,206,703.4 Median age for Native Hawaiian / Pacific Islander residents-544,891,640.3 -805,394,989.6 33.9 Median age for Other race residents16.3 60.8 22.1 Median age for Two or more races residents31.4 16.0 43.8 Median age for White alone residents42.7 44.6 19.7 Median age for Hispanic or Latino residents14.8 33.7
Owner/renter occupied households by race in Westerville
House owners and renters - White residents 10,196 78.6% Owner occupied2,776 21.4% Renter occupiedHouse owners and renters - Black or African American residents 264 30.2% Owner occupied610 69.8% Renter occupiedHouse owners and renters - American Indian / Alaska Native residents 13 100.0% Renter occupiedHouse owners and renters - Asian residents 248 68.1% Owner occupied116 31.9% Renter occupiedHouse owners and renters - Other race residents 58 100.0% Owner occupiedHouse owners and renters - Two or more races residents 354 60.0% Owner occupied236 40.0% Renter occupiedHouse owners and renters - White alone residents 10,260 78.6% Owner occupied2,788 21.4% Renter occupiedHouse owners and renters - Hispanic or Latino residents 101 68.2% Owner occupied47 31.8% Renter occupied
Language usage in Westerville
English speakers - Total 91.1% of residents of Westerville speak English at home.
1.3% of residents speak Spanish at home 363 74.2% Speak English very well126 25.8% Speak English less than very well6.8% of residents speak other language at home 2,095 83.5% Speak English very well414 16.5% Speak English less than very well
English speakers - Born in the United States 95.7% of residents of Westerville speak English at home.
2.0% of residents speak Spanish at home 192 100.0% Speak English very well2.2% of residents speak other language at home 211 100.0% Speak English very well
English speakers - Native, born elsewhere 59.1% of residents of Westerville speak English at home.
35.8% of residents speak Spanish at home 21 22.8% Speak English very well71 77.2% Speak English less than very well5.8% of residents speak other language at home 15 100.0% Speak English very well
English speakers - Foreign-born 23.2% of residents of Westerville speak English at home.
4.1% of residents speak Spanish at home 67 62.0% Speak English very well41 38.0% Speak English less than very well69.3% of residents speak other language at home 1,446 79.5% Speak English very well373 20.5% Speak English less than very well
White (Caucasian) - Speak only English Native:
98.4% (28,764)Foreign-born:
38.2% (225)
White (Caucasian) - Speak another language Native:
1.7% (485)Foreign-born:
62.4% (367)
Black or African American - Speak only English Native:
91.0% (1,409)Foreign-born:
22.0% (183)
Black or African American - Speak another language Native:
9.7% (150)Foreign-born:
77.8% (645)
American Indian / Alaska Native - Speak only English Native:
89.2% (30)Foreign-born:
100.0% (15)
Asian - Speak only English Native:
83.4% (327)Foreign-born:
18.0% (141)
Asian - Speak another language Native:
23.0% (90)Foreign-born:
79.8% (624)
Other race - Speak another language Native:
85.6% (165)Foreign-born:
100.0% (7)
Two or more races - Speak only English Native:
97.7% (2,304)Foreign-born:
12.8% (32)
Two or more races - Speak another language Native:
3.2% (76)Foreign-born:
87.2% (221)
White alone - Speak only English Native:
98.5% (28,827)Foreign-born:
32.6% (231)
White alone - Speak another language Native:
1.5% (449)Foreign-born:
65.9% (466)
Hispanic or Latino - Speak only English Native:
51.9% (348)Foreign-born:
17.3% (19)
Hispanic or Latino - Speak another language Native:
47.6% (320)Foreign-born:
84.5% (94)
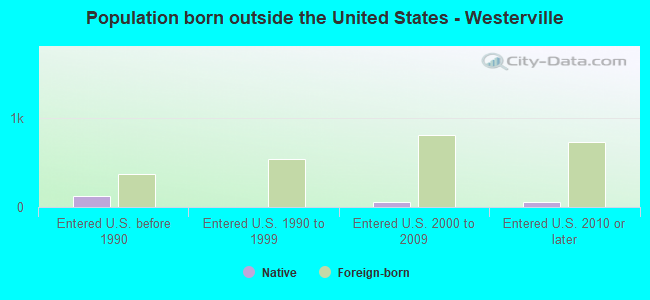
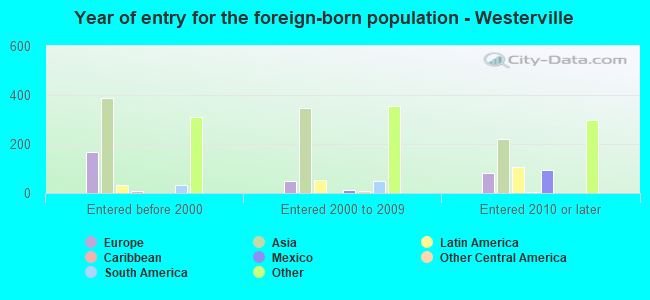
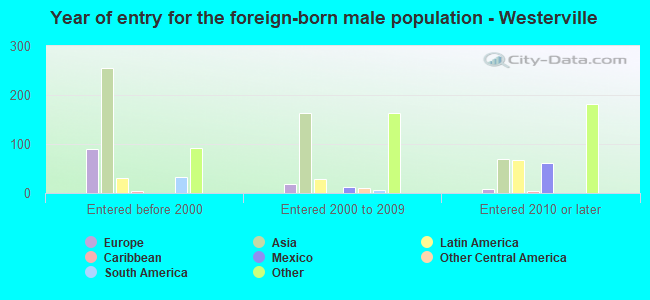
Foreign-born residents in Westerville 2,571 residents are foreign born (2.6% Asia , 2.3% Africa , 0.9% Europe ).
Marital status for residents in Westerville Marital status - White (Caucasian) population 15 years and over
Males 25.8% Never married63.3% Now married0.3% Separated2.3% Widowed8.3% DivorcedFemales 21.3% Never married57.8% Now married0.6% Separated7.5% Widowed12.8% DivorcedWomen who gave birth in the past 12 months Now married:
95.4% (342)Unmarried:
4.6% (16)
Women who did not give birth in the past 12 months Now married:
53.7% (3,543)Unmarried:
46.3% (3,049)
Marital status - Black or African American population 15 years and over
Males 32.3% Never married59.0% Now married0.0% Separated0.7% Widowed8.1% DivorcedFemales 26.9% Never married46.5% Now married0.6% Separated11.5% Widowed14.5% DivorcedWomen who gave birth in the past 12 months Now married:
31.8% (7)Unmarried:
68.2% (14)
Women who did not give birth in the past 12 months Now married:
46.6% (349)Unmarried:
53.4% (401)
Marital status - American Indian / Alaska Native population 15 years and over
Males 73.7% Never married0.0% Now married0.0% Separated0.0% Widowed26.3% DivorcedFemales 0.0% Never married0.0% Now married100.0% Separated0.0% Widowed0.0% DivorcedMarital status - Asian population 15 years and over
Males 23.2% Never married70.3% Now married2.9% Separated0.0% Widowed3.5% DivorcedFemales 21.1% Never married62.9% Now married0.0% Separated3.2% Widowed12.9% DivorcedWomen who gave birth in the past 12 months Now married:
100.0% (44)Unmarried:
0.0% (0)
Women who did not give birth in the past 12 months Now married:
55.1% (156)Unmarried:
44.9% (127)
Marital status - Other race population 15 years and over
Males 11.3% Never married88.7% Now married0.0% Separated0.0% Widowed0.0% DivorcedFemales 3.1% Never married96.9% Now married0.0% Separated0.0% Widowed0.0% DivorcedWomen who did not give birth in the past 12 months Now married:
92.3% (29)Unmarried:
7.7% (2)
Marital status - Two or more races population 15 years and over
Males 30.9% Never married66.5% Now married0.0% Separated0.0% Widowed2.6% DivorcedFemales 43.8% Never married44.2% Now married0.0% Separated0.0% Widowed12.0% DivorcedWomen who gave birth in the past 12 months Now married:
100.0% (10)Unmarried:
0.0% (0)
Women who did not give birth in the past 12 months Now married:
31.4% (158)Unmarried:
68.6% (347)
Marital status - White alone, not Hispanic / Latino population 15 years and over
Males 25.7% Never married63.3% Now married0.3% Separated2.3% Widowed8.4% DivorcedFemales 21.1% Never married57.9% Now married0.6% Separated7.5% Widowed12.9% DivorcedWomen who gave birth in the past 12 months Now married:
95.4% (346)Unmarried:
4.6% (17)
Women who did not give birth in the past 12 months Now married:
54.0% (3,593)Unmarried:
46.0% (3,058)
Marital status - Hispanic or Latino population 15 years and over
Males 22.7% Never married77.3% Now married0.0% Separated0.0% Widowed0.0% DivorcedFemales 29.1% Never married67.1% Now married0.0% Separated3.8% Widowed0.0% DivorcedWomen who did not give birth in the past 12 months Now married:
51.2% (72)Unmarried:
48.8% (69)
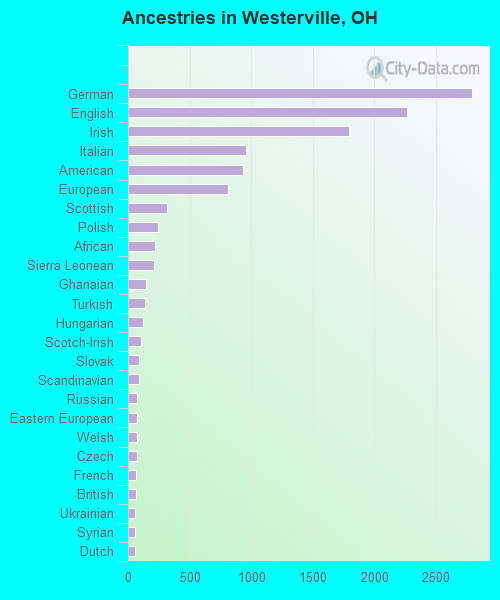
Ancestries in Westerville
2,794 17.4% German2,268 14.1% English1,795 11.2% Irish960 6.0% Italian936 5.8% American811 5.1% European317 2.0% Scottish242 1.5% Polish220 1.4% African212 1.3% Sierra Leonean144 0.9% Ghanaian138 0.9% Turkish124 0.8% Hungarian109 0.7% Scotch-Irish90 0.6% Slovak86 0.5% Scandinavian76 0.5% Russian75 0.5% Eastern European73 0.5% Welsh70 0.4% Czech67 0.4% French64 0.4% British56 0.3% Ukrainian53 0.3% Syrian53 0.3% Dutch53 0.3% Romanian48 0.3% Egyptian47 0.3% Nigerian41 0.3% Somali38 0.2% Swedish38 0.2% Greek29 0.2% Czechoslovakian22 0.1% Zimbabwean22 0.1% Northern European19 0.1% Swiss18 0.1% Palestinian17 0.1% Danish17 0.1% Lebanese14 0.09% Cajun13 0.08% Iranian12 0.07% Lithuanian12 0.07% Jamaican10 0.06% Austrian10 0.06% Slovene8 0.05% Arab6 0.04% Canadian4 0.02% Moroccan4 0.02% Norwegian3 0.02% West Indian1 0.01% Finnish
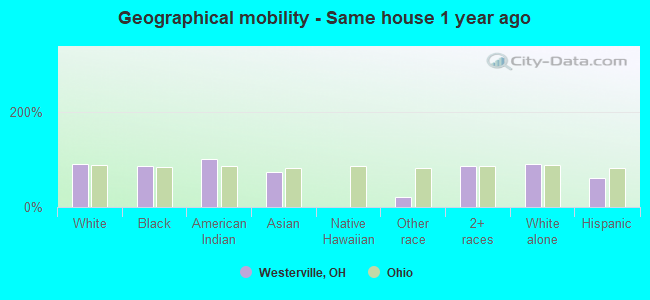
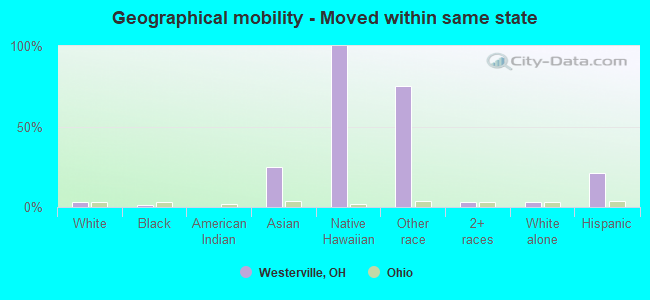
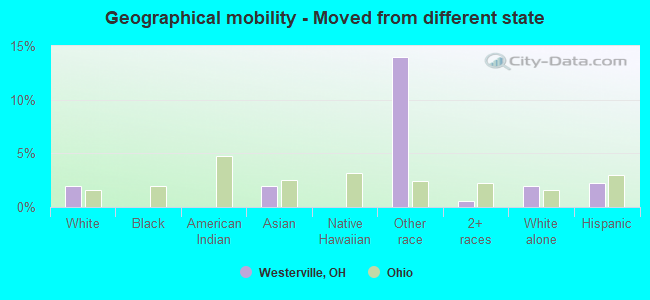
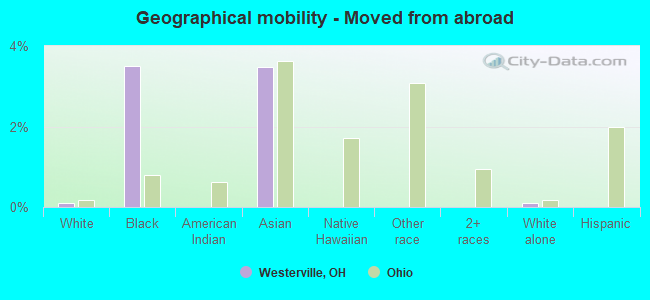
Geographical mobility in Westerville Same house 1 year ago 27,985 90.3% White (Caucasian)2,211 85.3% Black or African American37 100.0% American Indian / Alaska Native862 73.1% Asian50 22.1% Other race2,510 84.8% Two or more races28,208 90.2% White alone, not Hispanic / Latino546 60.2% Hispanic or LatinoMoved within same county 1,404 4.5% White / Caucasian263 10.2% Black or African American70 5.9% Asian309 10.4% Two or more races1,437 4.6% White alone, not Hispanic / Latino137 15.1% Hispanic or LatinoMoved within same state 1,032 3.3% White / Caucasian33 1.3% Black or African American298 25.2% Asian33 100.0% Native Hawaiian / Pacific Islander168 74.6% Other race100 3.4% Two or more races1,021 3.3% White alone, not Hispanic / Latino190 21.0% Hispanic or LatinoMoved from different state 597 1.9% White / Caucasian24 2.0% Asian32 14.0% Other race16 0.5% Two or more races611 2.0% White alone, not Hispanic / Latino20 2.2% Hispanic or LatinoMoved from abroad 30 0.1% White91 3.5% Black or African American41 3.5% Asian33 0.1% White alone, not Hispanic / Latino
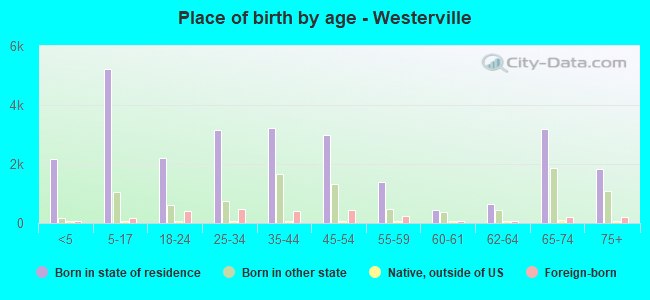
Children Nativity (place of birth) in Westerville
Children under 6 years - Living with two parents Both parents native 2,151 100.0% NativeBoth parents foreign-born 169 100.0% NativeOne native, one foreign-born parent 143 100.0% NativeChildren under 6 years - Living with one parent Native parent 303 100.0% NativeForeign-born parent 53 100.0% NativeChildren 6 to 17 years - Living with two parents Both parents native 3,872 99.1% Native34 0.9% Foreign-bornBoth parents foreign-born 215 74.1% Native75 25.9% Foreign-bornOne native, one foreign-born parent 235 93.7% Native16 6.3% Foreign-bornChildren 6 to 17 years - Living with one parent Native parent 1,172 100.0% NativeForeign-born parent 89 58.5% Native63 41.5% Foreign-born
Grandparents responsible for own grandchildren in Westerville
Grandparents (30 to 59 years) White / Caucasian 44 100.0% Not responsible for grandchildrenBlack or African American 10 100.0% Not responsible for grandchildrenTwo or more races 107 100.0% Responsible for grandchildrenWhite alone, not Hispanic / Latino 46 100.0% Not responsible for grandchildrenGrandparents (60 years and over) White / Caucasian 56 26.0% Responsible for grandchildren160 74.0% Not responsible for grandchildrenBlack or African American 25 58.3% Responsible for grandchildren18 41.7% Not responsible for grandchildrenWhite alone, not Hispanic / Latino 57 31.1% Responsible for grandchildren126 68.9% Not responsible for grandchildren