Races in Wheaton, Illinois (IL) Detailed Stats
Data:
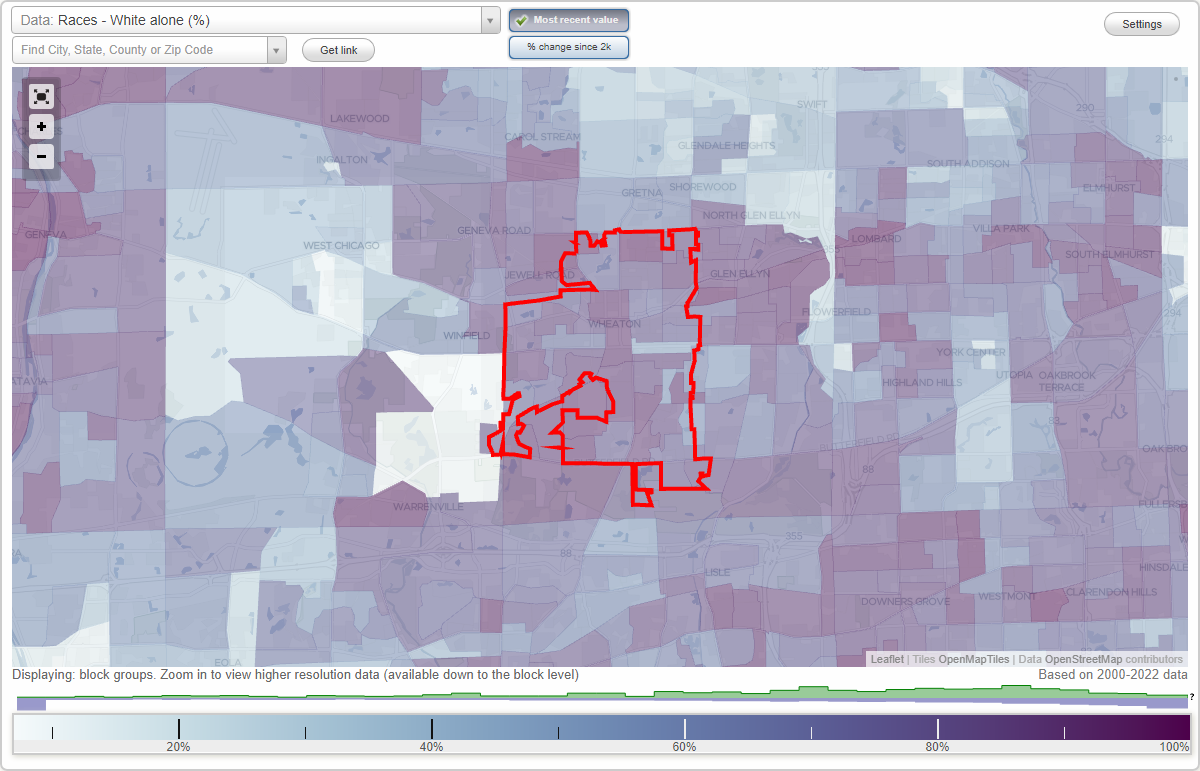
Races - White alone (%)
Races - White alone (% change since 2000)
Races - Black alone (%)
Races - Black alone (% change since 2000)
Races - American Indian alone (%)
Races - American Indian alone (% change since 2000)
Races - Asian alone (%)
Races - Asian alone (% change since 2000)
Races - Hispanic (%)
Races - Hispanic (% change since 2000)
Races - Native Hawaiian and Other Pacific Islander alone (%)
Races - Native Hawaiian and Other Pacific Islander alone (% change since 2000)
Races - Two or more races(%)
Races - Two or more races(% change since 2000)
Races - Other race alone (%)
Races - Other race alone (% change since 2000)
Racial diversity
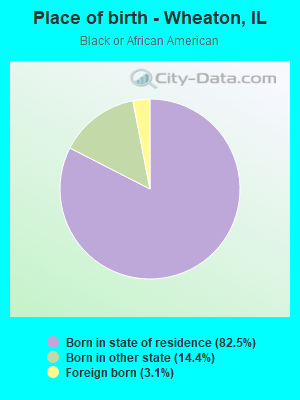
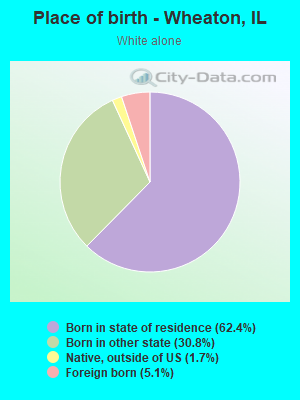
Place of birth - Born in state of residence (%)
Place of birth - Born in state of residence (%) - White
Place of birth - Born in state of residence (%) - Black or African American
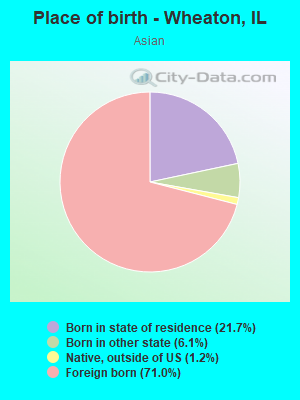
Place of birth - Born in state of residence (%) - Asian
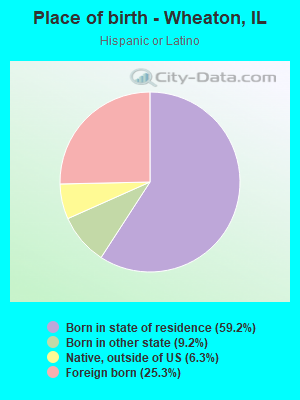
Place of birth - Born in state of residence (%) - Hispanic or Latino
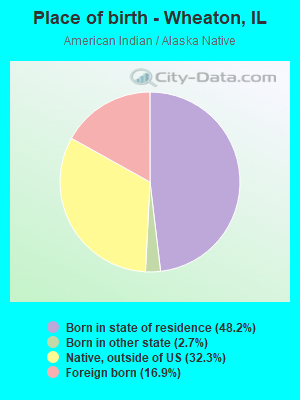
Place of birth - Born in state of residence (%) - American Indian and Alaska Native
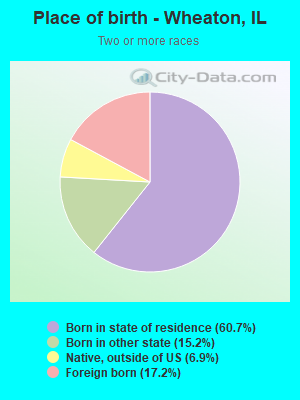
Place of birth - Born in state of residence (%) - Multirace
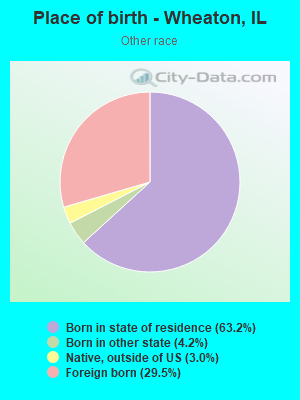
Place of birth - Born in state of residence (%) - Other Race
Place of birth - Born in other state (%)
Place of birth - Born in other state (%) - White
Place of birth - Born in other state (%) - Black or African American
Place of birth - Born in other state (%) - Asian
Place of birth - Born in other state (%) - Hispanic or Latino
Place of birth - Born in other state (%) - American Indian and Alaska Native
Place of birth - Born in other state (%) - Multirace
Place of birth - Born in other state (%) - Other Race
Place of birth - Native, outside of US (%)
Place of birth - Native, outside of US (%) - White
Place of birth - Native, outside of US (%) - Black or African American
Place of birth - Native, outside of US (%) - Asian
Place of birth - Native, outside of US (%) - Hispanic or Latino
Place of birth - Native, outside of US (%) - American Indian and Alaska Native
Place of birth - Native, outside of US (%) - Multirace
Place of birth - Native, outside of US (%) - Other Race
Place of birth - Foreign born (%)
Place of birth - Foreign born (%) - White
Place of birth - Foreign born (%) - Black or African American
Place of birth - Foreign born (%) - Asian
Place of birth - Foreign born (%) - Hispanic or Latino
Place of birth - Foreign born (%) - American Indian and Alaska Native
Place of birth - Foreign born (%) - Multirace
Place of birth - Foreign born (%) - Other Race
Residents speaking English at home (%)
Residents speaking English at home - Born in the United States (%)
Residents speaking English at home - Native, born elsewhere (%)
Residents speaking English at home - Foreign born (%)
Residents speaking Spanish at home (%)
Residents speaking Spanish at home - Born in the United States (%)
Residents speaking Spanish at home - Native, born elsewhere (%)
Residents speaking Spanish at home - Foreign born (%)
Residents speaking other language at home (%)
Residents speaking other language at home - Born in the United States (%)
Residents speaking other language at home - Native, born elsewhere (%)
Residents speaking other language at home - Foreign born (%)
Marital status - Never married (%)
Marital status - Now married (%)
Marital status - Separated (%)
Marital status - Widowed (%)
Marital status - Divorced (%)
Ancestries Reported - Arab (%)
Ancestries Reported - Czech (%)
Ancestries Reported - Danish (%)
Ancestries Reported - Dutch (%)
Ancestries Reported - English (%)
Ancestries Reported - French (%)
Ancestries Reported - French Canadian (%)
Ancestries Reported - German (%)
Ancestries Reported - Greek (%)
Ancestries Reported - Hungarian (%)
Ancestries Reported - Irish (%)
Ancestries Reported - Italian (%)
Ancestries Reported - Lithuanian (%)
Ancestries Reported - Norwegian (%)
Ancestries Reported - Polish (%)
Ancestries Reported - Portuguese (%)
Ancestries Reported - Russian (%)
Ancestries Reported - Scotch-Irish (%)
Ancestries Reported - Scottish (%)
Ancestries Reported - Slovak (%)
Ancestries Reported - Subsaharan African (%)
Ancestries Reported - Swedish (%)
Ancestries Reported - Swiss (%)
Ancestries Reported - Ukrainian (%)
Ancestries Reported - United States (%)
Ancestries Reported - Welsh (%)
Ancestries Reported - West Indian (%)
Ancestries Reported - Other (%)
Geographical mobility - Same house 1 year ago (%)
Geographical mobility - Same house 1 year ago (%) - White
Geographical mobility - Same house 1 year ago (%) - Black or African American
Geographical mobility - Same house 1 year ago (%) - Asian
Geographical mobility - Same house 1 year ago (%) - Hispanic or Latino
Geographical mobility - Same house 1 year ago (%) - American Indian and Alaska Native
Geographical mobility - Same house 1 year ago (%) - Multirace
Geographical mobility - Same house 1 year ago (%) - Other Race
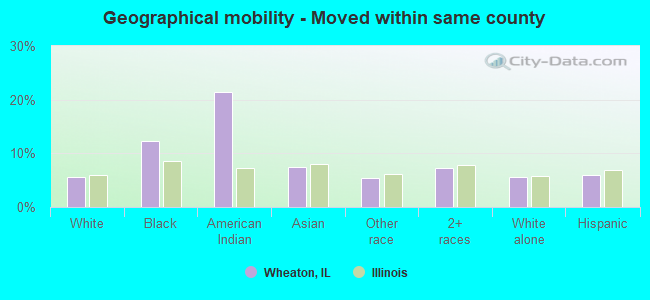
Geographical mobility - Moved within same county (%)
Geographical mobility - Moved within same county (%) - White
Geographical mobility - Moved within same county (%) - Black or African American
Geographical mobility - Moved within same county (%) - Asian
Geographical mobility - Moved within same county (%) - Hispanic or Latino
Geographical mobility - Moved within same county (%) - American Indian and Alaska Native
Geographical mobility - Moved within same county (%) - Multirace
Geographical mobility - Moved within same county (%) - Other Race
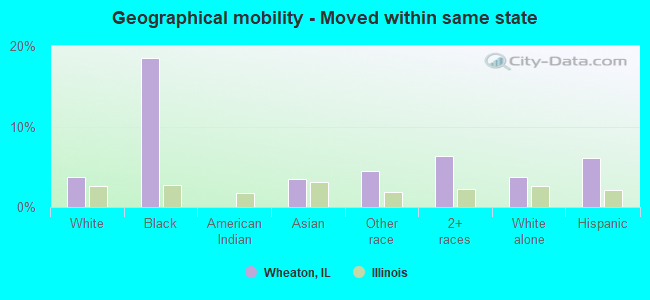
Geographical mobility - Moved from different county within same state (%)
Geographical mobility - Moved from different county within same state (%) - White
Geographical mobility - Moved from different county within same state (%) - Black or African American
Geographical mobility - Moved from different county within same state (%) - Asian
Geographical mobility - Moved from different county within same state (%) - Hispanic or Latino
Geographical mobility - Moved from different county within same state (%) - American Indian and Alaska Native
Geographical mobility - Moved from different county within same state (%) - Multirace
Geographical mobility - Moved from different county within same state (%) - Other Race
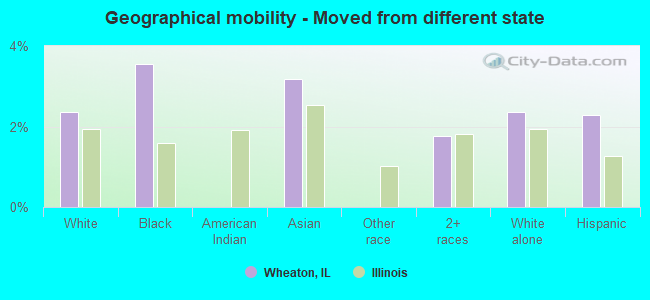
Geographical mobility - Moved from different state (%)
Geographical mobility - Moved from different state (%) - White
Geographical mobility - Moved from different state (%) - Black or African American
Geographical mobility - Moved from different state (%) - Asian
Geographical mobility - Moved from different state (%) - Hispanic or Latino
Geographical mobility - Moved from different state (%) - American Indian and Alaska Native
Geographical mobility - Moved from different state (%) - Multirace
Geographical mobility - Moved from different state (%) - Other Race
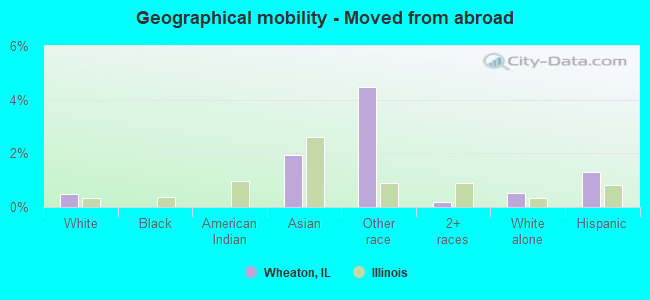
Geographical mobility - Moved from abroad (%)
Geographical mobility - Moved from abroad (%) - White
Geographical mobility - Moved from abroad (%) - Black or African American
Geographical mobility - Moved from abroad (%) - Asian
Geographical mobility - Moved from abroad (%) - Hispanic or Latino
Geographical mobility - Moved from abroad (%) - American Indian and Alaska Native
Geographical mobility - Moved from abroad (%) - Multirace
Geographical mobility - Moved from abroad (%) - Other Race
Place of birth for the foreign-born population - Ireland (%)
Place of birth for the foreign-born population - Denmark (%)
Place of birth for the foreign-born population - Norway (%)
Place of birth for the foreign-born population - Sweden (%)
Place of birth for the foreign-born population - United Kingdom (%)
Place of birth for the foreign-born population - England (%)
Place of birth for the foreign-born population - Scotland (%)
Place of birth for the foreign-born population - Other Northern Europe (%)
Place of birth for the foreign-born population - Austria (%)
Place of birth for the foreign-born population - Belgium (%)
Place of birth for the foreign-born population - France (%)
Place of birth for the foreign-born population - Germany (%)
Place of birth for the foreign-born population - Netherlands (%)
Place of birth for the foreign-born population - Switzerland (%)
Place of birth for the foreign-born population - Other Western Europe (%)
Place of birth for the foreign-born population - Greece (%)
Place of birth for the foreign-born population - Italy (%)
Place of birth for the foreign-born population - Portugal (%)
Place of birth for the foreign-born population - Spain (%)
Place of birth for the foreign-born population - Other Southern Europe (%)
Place of birth for the foreign-born population - Albania (%)
Place of birth for the foreign-born population - Belarus (%)
Place of birth for the foreign-born population - Bosnia and Herzegovina (%)
Place of birth for the foreign-born population - Bulgaria (%)
Place of birth for the foreign-born population - Croatia (%)
Place of birth for the foreign-born population - Czechoslovakia (%)
Place of birth for the foreign-born population - Hungary (%)
Place of birth for the foreign-born population - Latvia (%)
Place of birth for the foreign-born population - Lithuania (%)
Place of birth for the foreign-born population - North Macedonia (Macedonia) (%)
Place of birth for the foreign-born population - Moldova (%)
Place of birth for the foreign-born population - Poland (%)
Place of birth for the foreign-born population - Romania (%)
Place of birth for the foreign-born population - Russia (%)
Place of birth for the foreign-born population - Serbia (%)
Place of birth for the foreign-born population - Ukraine (%)
Place of birth for the foreign-born population - Other Eastern Europe (%)
Place of birth for the foreign-born population - China (%)
Place of birth for the foreign-born population - Hong Kong (%)
Place of birth for the foreign-born population - Taiwan (%)
Place of birth for the foreign-born population - Japan (%)
Place of birth for the foreign-born population - Korea (%)
Place of birth for the foreign-born population - Other Eastern Asia (%)
Place of birth for the foreign-born population - Afghanistan (%)
Place of birth for the foreign-born population - Bangladesh (%)
Place of birth for the foreign-born population - India (%)
Place of birth for the foreign-born population - Iran (%)
Place of birth for the foreign-born population - Kazakhstan (%)
Place of birth for the foreign-born population - Nepal (%)
Place of birth for the foreign-born population - Pakistan (%)
Place of birth for the foreign-born population - Sri Lanka (%)
Place of birth for the foreign-born population - Uzbekistan (%)
Place of birth for the foreign-born population - Other South Central Asia (%)
Place of birth for the foreign-born population - Burma (%)
Place of birth for the foreign-born population - Cambodia (%)
Place of birth for the foreign-born population - Indonesia (%)
Place of birth for the foreign-born population - Laos (%)
Place of birth for the foreign-born population - Malaysia (%)
Place of birth for the foreign-born population - Philippines (%)
Place of birth for the foreign-born population - Singapore (%)
Place of birth for the foreign-born population - Thailand (%)
Place of birth for the foreign-born population - Vietnam (%)
Place of birth for the foreign-born population - Other South Eastern Asia (%)
Place of birth for the foreign-born population - Armenia (%)
Place of birth for the foreign-born population - Iraq (%)
Place of birth for the foreign-born population - Israel (%)
Place of birth for the foreign-born population - Jordan (%)
Place of birth for the foreign-born population - Kuwait (%)
Place of birth for the foreign-born population - Lebanon (%)
Place of birth for the foreign-born population - Saudi Arabia (%)
Place of birth for the foreign-born population - Syria (%)
Place of birth for the foreign-born population - Turkey (%)
Place of birth for the foreign-born population - Yemen (%)
Place of birth for the foreign-born population - Other Western Asia (%)
Place of birth for the foreign-born population - Eritrea (%)
Place of birth for the foreign-born population - Ethiopia (%)
Place of birth for the foreign-born population - Kenya (%)
Place of birth for the foreign-born population - Somalia (%)
Place of birth for the foreign-born population - Uganda (%)
Place of birth for the foreign-born population - Zimbabwe (%)
Place of birth for the foreign-born population - Other Eastern Africa (%)
Place of birth for the foreign-born population - Cameroon (%)
Place of birth for the foreign-born population - Congo (%)
Place of birth for the foreign-born population - Democratic Republic of Congo (Zaire) (%)
Place of birth for the foreign-born population - Other Middle Africa (%)
Place of birth for the foreign-born population - Egypt (%)
Place of birth for the foreign-born population - Morocco (%)
Place of birth for the foreign-born population - Sudan (%)
Place of birth for the foreign-born population - Other Northern Africa (%)
Place of birth for the foreign-born population - South Africa (%)
Place of birth for the foreign-born population - Other Southern Africa (%)
Place of birth for the foreign-born population - Cabo Verde (%)
Place of birth for the foreign-born population - Ghana (%)
Place of birth for the foreign-born population - Liberia (%)
Place of birth for the foreign-born population - Nigeria (%)
Place of birth for the foreign-born population - Senegal (%)
Place of birth for the foreign-born population - Sierra Leone (%)
Place of birth for the foreign-born population - Other Western Africa (%)
Place of birth for the foreign-born population - Australia (%)
Place of birth for the foreign-born population - New Zealand (%)
Place of birth for the foreign-born population - Fiji (%)
Place of birth for the foreign-born population - Micronesia (%)
Place of birth for the foreign-born population - Bahamas (%)
Place of birth for the foreign-born population - Barbados (%)
Place of birth for the foreign-born population - Cuba (%)
Place of birth for the foreign-born population - Dominica (%)
Place of birth for the foreign-born population - Dominican Republic (%)
Place of birth for the foreign-born population - Grenada (%)
Place of birth for the foreign-born population - Haiti (%)
Place of birth for the foreign-born population - Jamaica (%)
Place of birth for the foreign-born population - St. Vincent and the Grenadines (%)
Place of birth for the foreign-born population - Trinidad and Tobago (%)
Place of birth for the foreign-born population - West Indies (%)
Place of birth for the foreign-born population - Other Caribbean (%)
Place of birth for the foreign-born population - Belize (%)
Place of birth for the foreign-born population - Costa Rica (%)
Place of birth for the foreign-born population - El Salvador (%)
Place of birth for the foreign-born population - Guatemala (%)
Place of birth for the foreign-born population - Honduras (%)
Place of birth for the foreign-born population - Mexico (%)
Place of birth for the foreign-born population - Nicaragua (%)
Place of birth for the foreign-born population - Panama (%)
Place of birth for the foreign-born population - Other Central America (%)
Place of birth for the foreign-born population - Argentina (%)
Place of birth for the foreign-born population - Bolivia (%)
Place of birth for the foreign-born population - Brazil (%)
Place of birth for the foreign-born population - Chile (%)
Place of birth for the foreign-born population - Colombia (%)
Place of birth for the foreign-born population - Ecuador (%)
Place of birth for the foreign-born population - Guyana (%)
Place of birth for the foreign-born population - Peru (%)
Place of birth for the foreign-born population - Uruguay (%)
Place of birth for the foreign-born population - Venezuela (%)
Place of birth for the foreign-born population - Other South America (%)
Place of birth for the foreign-born population - Canada (%)
Place of birth for the foreign-born population - Other Northern America (%)
Place of birth for the foreign-born population - Other (%)
Latest news about races in Wheaton, IL collected exclusively by city-data.com from local newspapers, TV, and radio stations
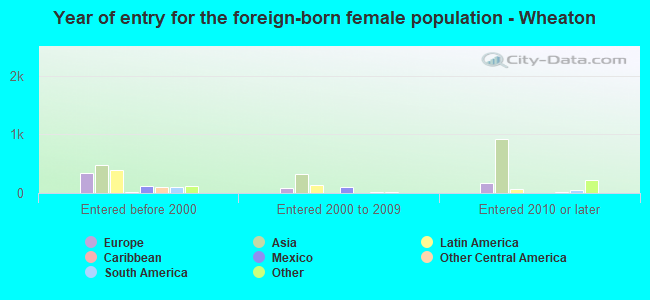
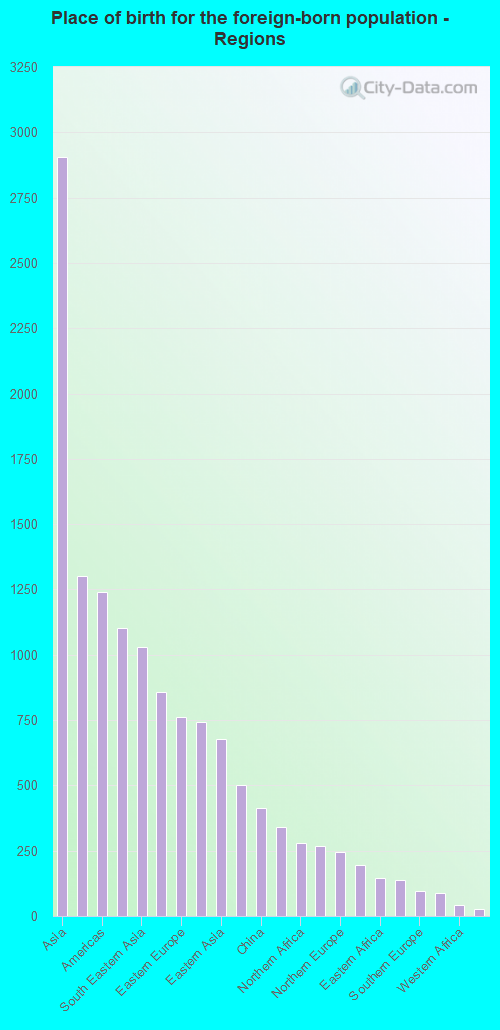
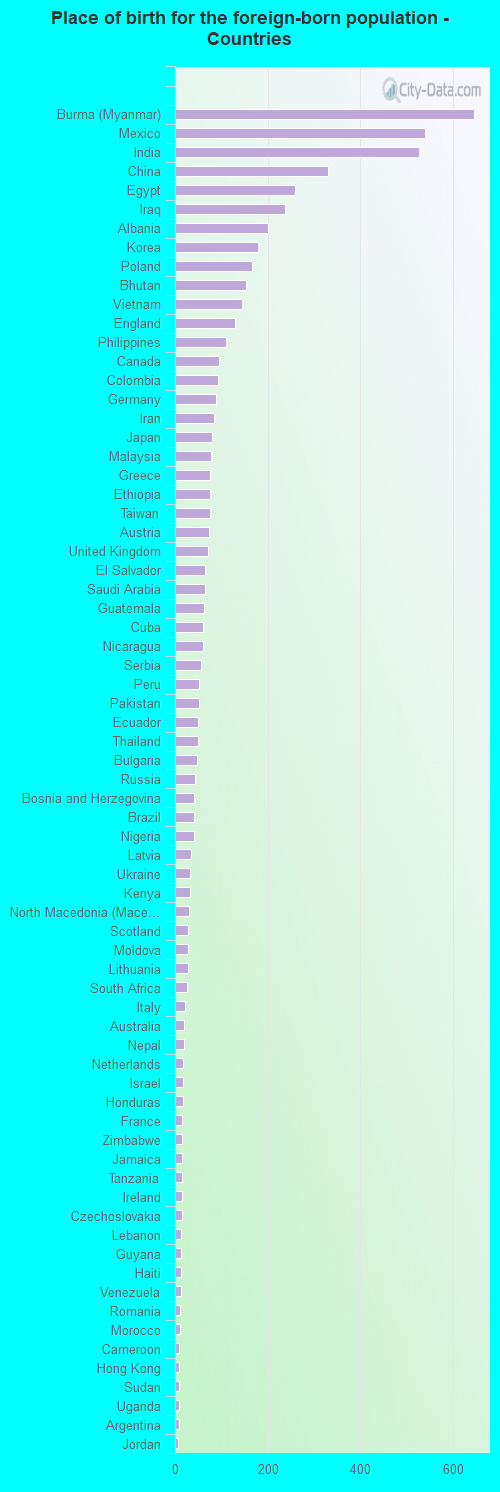
According to 2022 data, the most numerous races in Wheaton, IL are White alone (40,284 residents), Hispanic (4,184 residents), and Black alone (1,855 residents). 85.8% of Wheaton residents speak English at home. 11.3% of Wheaton, IL residents are foreign-born (5.4% born in Asia, 2.4% born in Europe, 2.0% born in Latin America), which is 24.4% less than the foreign-born rate of 14.0% across the entire state of Illinois.
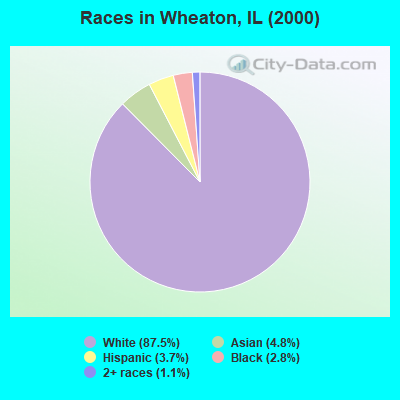
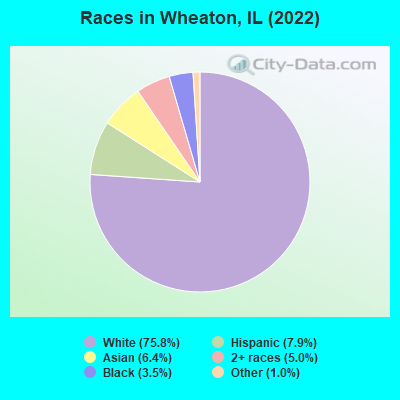
Race distribution in Wheaton
2000 2022
8,424,140 67.8% White alone 1,856,152 14.9% Black alone 1,530,262 12.3% Hispanic 419,916 3.4% Asian alone 153,996 1.2% Two or more races 13,479 0.1% Other race alone 18,232 0.1% American Indian alone 3,116 0.03% Native Hawaiian and Other
7,356,301 58.5% White alone 2,299,726 18.3% Hispanic 1,660,423 13.2% Black alone 747,296 5.9% Asian alone 458,599 3.6% Two or more races 45,386 0.4% Other race alone 10,405 0.08% American Indian alone 3,896 0.03% Native Hawaiian and Other
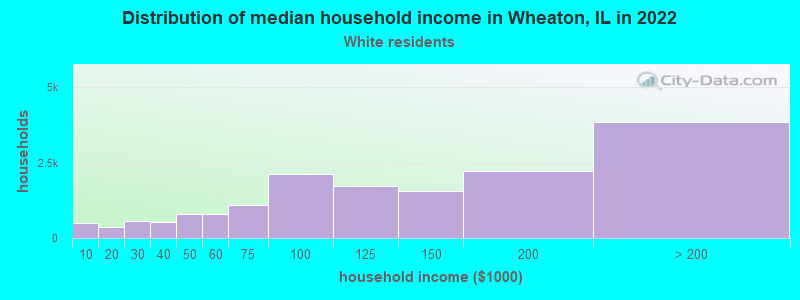
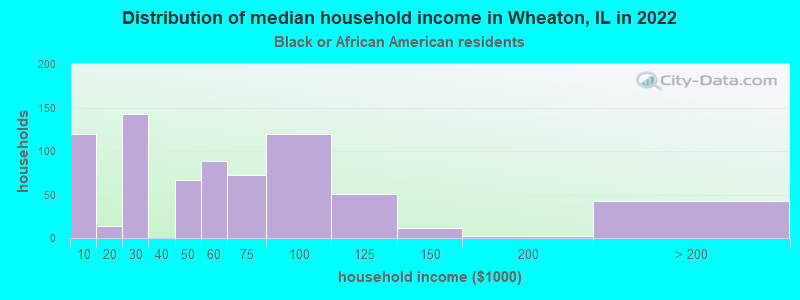
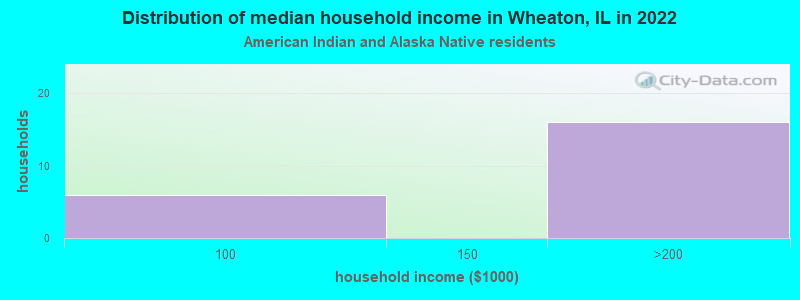
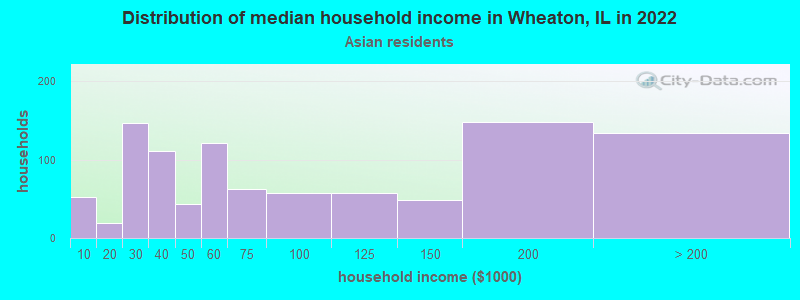
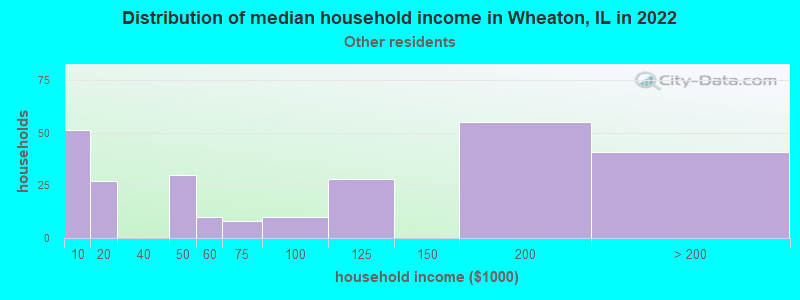
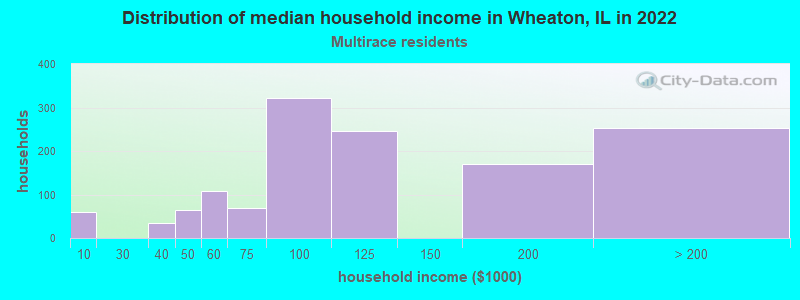
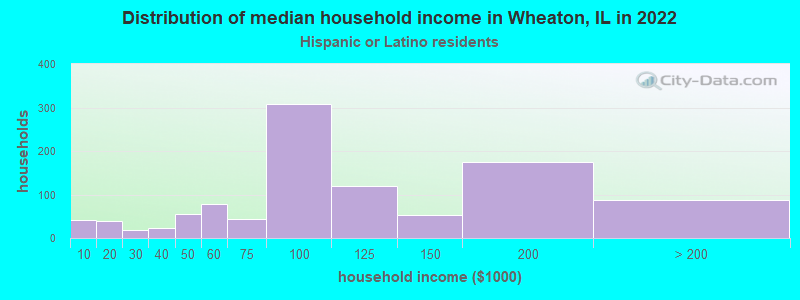
Income and house value in Wheaton Median household income in 2022 $115,959 White non-Hispanic householders$49,912 Black householders$65,868 Asian householders$100,387 Some other race householders$105,101 Two or more races householders$94,663 Hispanic or Latino race householdersMedian 2022 house value $460,737 White Non-Hispanic householders$403,762 Black or African American householders$334,240 American Indian or Alaska Native householders $409,521 Asian householders$355,426 Some other race householders$409,315 Two or more races householders$387,718 Hispanic or Latino householders
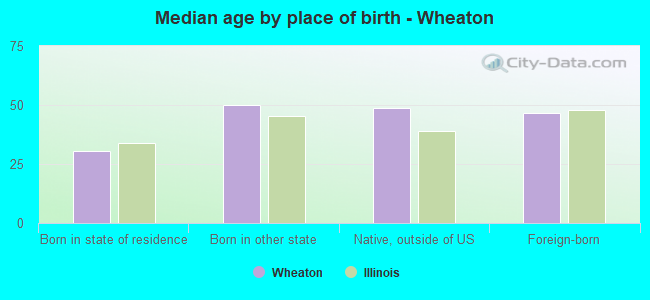
Median age by race in Wheaton
41.6 Median age for White residents39.7 43.2 30.5 Median age for Black or African American residents28.0 32.7 37.5 Median age for American Indian / Alaska Native residents39.5 14.5 37.3 Median age for Asian residents35.7 37.4 -593,236,714.4 Median age for Native Hawaiian / Pacific Islander residents-658,536,584.7 -576,015,108.0 26.3 Median age for Other race residents19.1 39.9 26.9 Median age for Two or more races residents23.9 27.6 41.4 Median age for White alone residents40.0 43.0 27.3 Median age for Hispanic or Latino residents23.9 28.2
Owner/renter occupied households by race in Wheaton
House owners and renters - White residents 12,688 78.2% Owner occupied3,537 21.8% Renter occupiedHouse owners and renters - Black or African American residents 140 21.9% Owner occupied498 78.1% Renter occupiedHouse owners and renters - American Indian / Alaska Native residents 17 100.0% Owner occupiedHouse owners and renters - Asian residents 712 70.5% Owner occupied298 29.5% Renter occupiedHouse owners and renters - Other race residents 154 60.3% Owner occupied101 39.7% Renter occupiedHouse owners and renters - Two or more races residents 919 67.0% Owner occupied453 33.0% Renter occupiedHouse owners and renters - White alone residents 12,782 77.9% Owner occupied3,633 22.1% Renter occupiedHouse owners and renters - Hispanic or Latino residents 547 52.5% Owner occupied495 47.5% Renter occupied
Language usage in Wheaton
English speakers - Total 85.8% of residents of Wheaton speak English at home.
4.5% of residents speak Spanish at home 1,775 79.0% Speak English very well471 21.0% Speak English less than very well9.4% of residents speak other language at home 2,941 62.2% Speak English very well1,786 37.8% Speak English less than very well
English speakers - Born in the United States 96.7% of residents of Wheaton speak English at home.
1.2% of residents speak Spanish at home 139 82.7% Speak English very well29 17.3% Speak English less than very well2.0% of residents speak other language at home 236 84.6% Speak English very well43 15.4% Speak English less than very well
English speakers - Native, born elsewhere 74.1% of residents of Wheaton speak English at home.
20.6% of residents speak Spanish at home 130 62.2% Speak English very well79 37.8% Speak English less than very well7.1% of residents speak other language at home 72 100.0% Speak English very well
English speakers - Foreign-born 19.7% of residents of Wheaton speak English at home.
14.9% of residents speak Spanish at home 602 68.0% Speak English very well283 32.0% Speak English less than very well63.1% of residents speak other language at home 2,035 54.3% Speak English very well1,711 45.7% Speak English less than very well
White (Caucasian) - Speak only English Native:
98.7% (35,478)Foreign-born:
31.6% (643)
White (Caucasian) - Speak another language Native:
2.5% (895)Foreign-born:
70.3% (1,433)
Black or African American - Speak only English Native:
98.8% (1,810)Foreign-born:
100.0% (52)
Black or African American - Speak another language Native:
1.9% (35)Foreign-born:
44.7% (23)
American Indian / Alaska Native - Speak only English Native:
53.2% (38)Foreign-born:
90.2% (16)
Asian - Speak only English Native:
69.1% (531)Foreign-born:
13.7% (334)
Asian - Speak another language Native:
33.0% (254)Foreign-born:
85.5% (2,082)
Other race - Speak only English Native:
52.9% (487)Foreign-born:
3.9% (15)
Other race - Speak another language Native:
51.8% (476)Foreign-born:
96.6% (381)
Two or more races - Speak only English Native:
80.6% (3,062)Foreign-born:
9.7% (88)
Two or more races - Speak another language Native:
16.7% (634)Foreign-born:
90.5% (818)
White alone - Speak only English Native:
97.7% (35,149)Foreign-born:
32.0% (664)
White alone - Speak another language Native:
2.5% (883)Foreign-born:
68.6% (1,424)
Hispanic or Latino - Speak only English Native:
64.3% (1,856)Foreign-born:
10.6% (113)
Hispanic or Latino - Speak another language Native:
34.5% (997)Foreign-born:
88.8% (943)
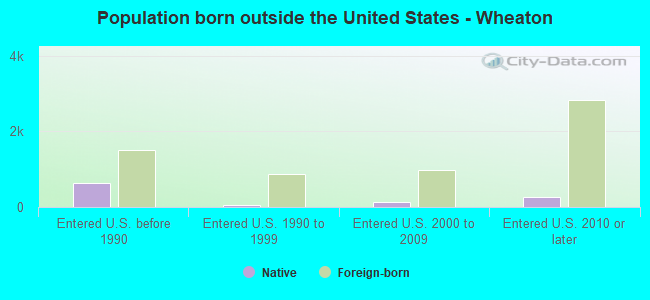
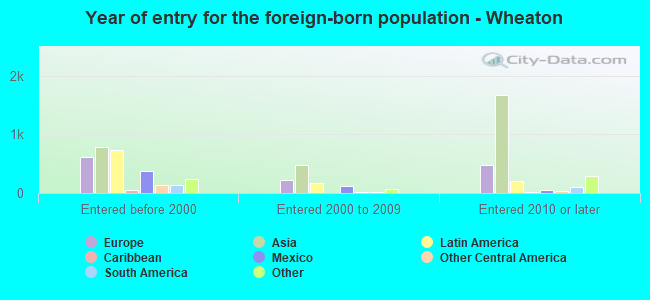
Foreign-born residents in Wheaton 5,976 residents are foreign born (5.4% Asia , 2.4% Europe , 2.0% Latin America ).
This city:
11.3%Illinois:
14.1%
Marital status for residents in Wheaton Marital status - White (Caucasian) population 15 years and over
Males 28.5% Never married61.4% Now married1.1% Separated2.9% Widowed6.0% DivorcedFemales 27.6% Never married53.0% Now married0.7% Separated8.2% Widowed10.6% DivorcedWomen who gave birth in the past 12 months Now married:
81.9% (417)Unmarried:
18.1% (92)
Women who did not give birth in the past 12 months Now married:
45.6% (3,665)Unmarried:
54.4% (4,377)
Marital status - Black or African American population 15 years and over
Males 70.5% Never married15.7% Now married0.0% Separated0.0% Widowed13.8% DivorcedFemales 61.1% Never married18.2% Now married0.0% Separated6.4% Widowed14.3% DivorcedWomen who gave birth in the past 12 months Now married:
87.5% (64)Unmarried:
12.5% (9)
Women who did not give birth in the past 12 months Now married:
9.1% (52)Unmarried:
90.9% (516)
Marital status - American Indian / Alaska Native population 15 years and over
Males 32.1% Never married21.4% Now married0.0% Separated0.0% Widowed46.4% DivorcedFemales 45.2% Never married9.7% Now married0.0% Separated0.0% Widowed45.2% DivorcedWomen who did not give birth in the past 12 months Now married:
9.7% (5)Unmarried:
90.3% (47)
Marital status - Asian population 15 years and over
Males 33.1% Never married59.6% Now married1.5% Separated2.0% Widowed3.8% DivorcedFemales 35.5% Never married56.0% Now married0.0% Separated3.1% Widowed5.3% DivorcedWomen who gave birth in the past 12 months Now married:
100.0% (9)Unmarried:
0.0% (0)
Women who did not give birth in the past 12 months Now married:
44.6% (475)Unmarried:
55.4% (591)
Marital status - Other race population 15 years and over
Males 57.4% Never married38.6% Now married2.3% Separated0.0% Widowed1.7% DivorcedFemales 40.5% Never married38.8% Now married0.0% Separated6.0% Widowed14.7% DivorcedWomen who gave birth in the past 12 months Now married:
100.0% (20)Unmarried:
0.0% (0)
Women who did not give birth in the past 12 months Now married:
39.8% (145)Unmarried:
60.2% (219)
Marital status - Two or more races population 15 years and over
Males 47.7% Never married52.0% Now married0.0% Separated0.3% Widowed0.0% DivorcedFemales 39.9% Never married51.0% Now married0.0% Separated2.2% Widowed7.0% DivorcedWomen who gave birth in the past 12 months Now married:
100.0% (74)Unmarried:
0.0% (0)
Women who did not give birth in the past 12 months Now married:
37.6% (491)Unmarried:
62.4% (816)
Marital status - White alone, not Hispanic / Latino population 15 years and over
Males 28.2% Never married61.7% Now married1.0% Separated3.0% Widowed6.1% DivorcedFemales 27.4% Never married53.3% Now married0.5% Separated8.4% Widowed10.5% DivorcedWomen who gave birth in the past 12 months Now married:
83.1% (440)Unmarried:
16.9% (90)
Women who did not give birth in the past 12 months Now married:
45.6% (3,770)Unmarried:
54.4% (4,498)
Marital status - Hispanic or Latino population 15 years and over
Males 41.6% Never married53.1% Now married2.3% Separated0.0% Widowed3.0% DivorcedFemales 41.8% Never married44.0% Now married2.4% Separated2.1% Widowed9.7% DivorcedWomen who gave birth in the past 12 months Now married:
59.1% (13)Unmarried:
40.9% (9)
Women who did not give birth in the past 12 months Now married:
39.9% (463)Unmarried:
60.1% (697)
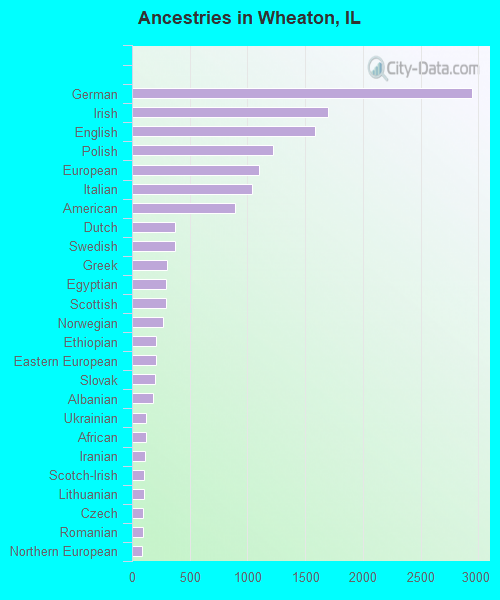
Ancestries in Wheaton
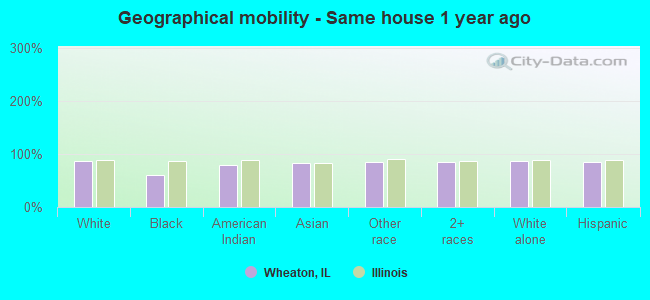
2,945 13.6% German1,694 7.8% Irish1,586 7.3% English1,220 5.6% Polish1,097 5.1% European1,036 4.8% Italian890 4.1% American375 1.7% Dutch369 1.7% Swedish300 1.4% Greek298 1.4% Egyptian292 1.3% Scottish268 1.2% Norwegian204 0.9% Ethiopian204 0.9% Eastern European201 0.9% Slovak185 0.9% Albanian124 0.6% Ukrainian119 0.5% African110 0.5% Iranian106 0.5% Scotch-Irish100 0.5% Lithuanian98 0.5% Czech95 0.4% Romanian86 0.4% Northern European77 0.4% British76 0.4% Iraqi73 0.3% Russian71 0.3% Bulgarian71 0.3% Serbian70 0.3% Australian68 0.3% Scandinavian59 0.3% Swiss58 0.3% Austrian51 0.2% French50 0.2% Yugoslavian46 0.2% Welsh44 0.2% Nigerian43 0.2% Macedonian41 0.2% Moroccan36 0.2% Croatian29 0.1% French Canadian28 0.1% Finnish26 0.1% Arab24 0.1% Armenian19 0.09% Hungarian19 0.09% Belgian18 0.08% Lebanese15 0.07% Haitian14 0.06% Danish14 0.06% Portuguese14 0.06% Zimbabwean12 0.06% Czechoslovakian10 0.05% Latvian10 0.05% Brazilian10 0.05% Jamaican9 0.04% Slovene8 0.04% Canadian8 0.04% Palestinian8 0.04% Soviet Union7 0.03% Slavic6 0.03% Assyrian5 0.02% Estonian
Geographical mobility in Wheaton Same house 1 year ago 34,602 87.6% White (Caucasian)1,132 61.2% Black or African American105 78.8% American Indian / Alaska Native2,821 82.6% Asian1,170 85.1% Other race4,177 84.3% Two or more races34,852 87.4% White alone, not Hispanic / Latino3,451 84.5% Hispanic or LatinoMoved within same county 2,232 5.6% White / Caucasian227 12.3% Black or African American29 21.4% American Indian / Alaska Native256 7.5% Asian75 5.4% Other race359 7.2% Two or more races2,260 5.7% White alone, not Hispanic / Latino245 6.0% Hispanic or LatinoMoved within same state 1,450 3.7% White / Caucasian342 18.5% Black or African American118 3.4% Asian62 4.5% Other race311 6.3% Two or more races1,488 3.7% White alone, not Hispanic / Latino248 6.1% Hispanic or LatinoMoved from different state 929 2.4% White / Caucasian66 3.6% Black or African American109 3.2% Asian87 1.8% Two or more races940 2.4% White alone, not Hispanic / Latino94 2.3% Hispanic or LatinoMoved from abroad 188 0.5% White66 1.9% Asian61 4.5% Other race8 0.2% Two or more races202 0.5% White alone, not Hispanic / Latino54 1.3% Hispanic or Latino
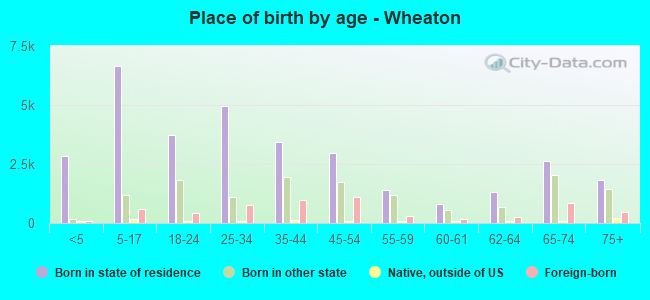
Children Nativity (place of birth) in Wheaton
Children under 6 years - Living with two parents Both parents native 2,638 99.6% Native10 0.4% Foreign-bornBoth parents foreign-born 330 96.2% Native13 3.8% Foreign-bornOne native, one foreign-born parent 325 100.0% NativeChildren under 6 years - Living with one parent Native parent 165 100.0% NativeForeign-born parent 10 100.0% NativeChildren 6 to 17 years - Living with two parents Both parents native 5,231 98.2% Native94 1.8% Foreign-bornBoth parents foreign-born 370 43.6% Native479 56.4% Foreign-bornOne native, one foreign-born parent 853 96.9% Native27 3.1% Foreign-bornChildren 6 to 17 years - Living with one parent Native parent 883 100.0% NativeForeign-born parent 112 48.1% Native121 51.9% Foreign-born
Grandparents responsible for own grandchildren in Wheaton
Grandparents (30 to 59 years) White / Caucasian 6 23.2% Responsible for grandchildren21 76.8% Not responsible for grandchildrenOther race 25 100.0% Responsible for grandchildrenWhite alone, not Hispanic / Latino 7 51.0% Responsible for grandchildren7 49.0% Not responsible for grandchildrenHispanic or Latino 6 19.0% Responsible for grandchildren27 81.0% Not responsible for grandchildrenGrandparents (60 years and over) White / Caucasian 36 23.6% Responsible for grandchildren115 76.4% Not responsible for grandchildrenOther race 18 31.1% Responsible for grandchildren39 68.9% Not responsible for grandchildrenWhite alone, not Hispanic / Latino 39 34.2% Responsible for grandchildren75 65.8% Not responsible for grandchildrenHispanic or Latino 28 13.9% Responsible for grandchildren171 86.1% Not responsible for grandchildren