Races in Willowbrook, Illinois (IL) Detailed Stats
Data:
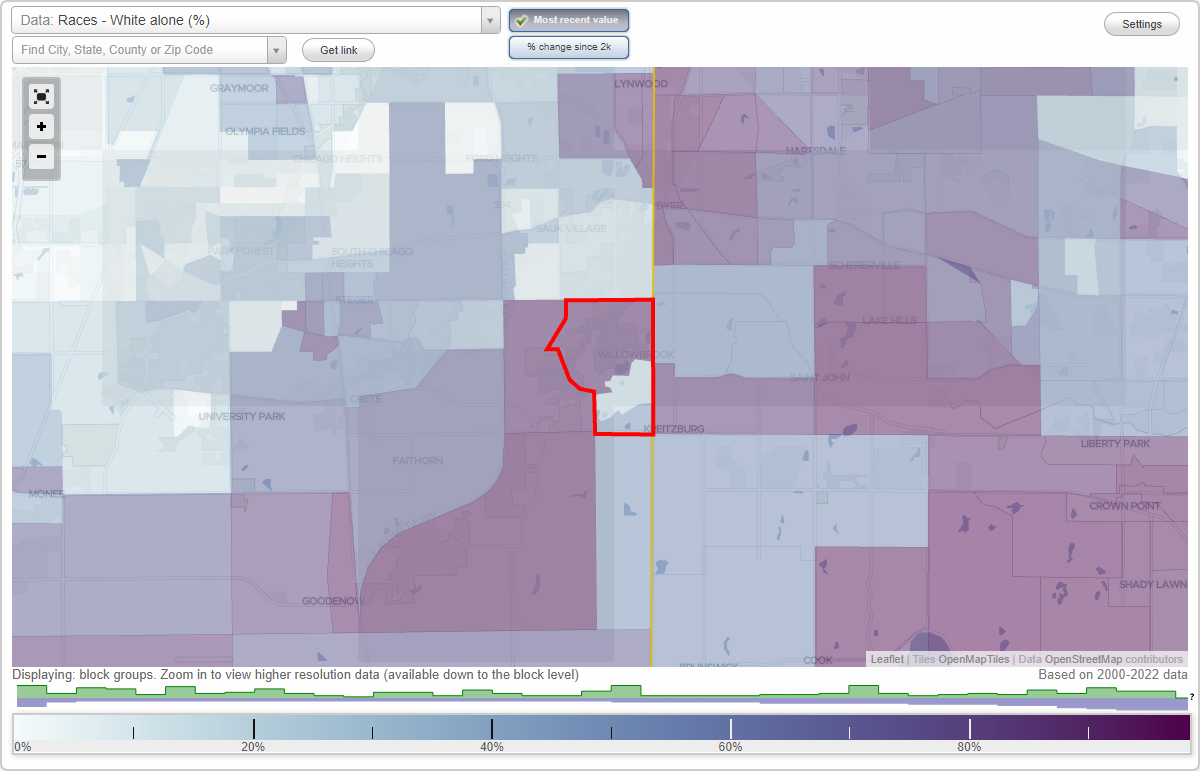
Races - White alone (%)
Races - White alone (% change since 2000)
Races - Black alone (%)
Races - Black alone (% change since 2000)
Races - American Indian alone (%)
Races - American Indian alone (% change since 2000)
Races - Asian alone (%)
Races - Asian alone (% change since 2000)
Races - Hispanic (%)
Races - Hispanic (% change since 2000)
Races - Native Hawaiian and Other Pacific Islander alone (%)
Races - Native Hawaiian and Other Pacific Islander alone (% change since 2000)
Races - Two or more races(%)
Races - Two or more races(% change since 2000)
Races - Other race alone (%)
Races - Other race alone (% change since 2000)
Racial diversity
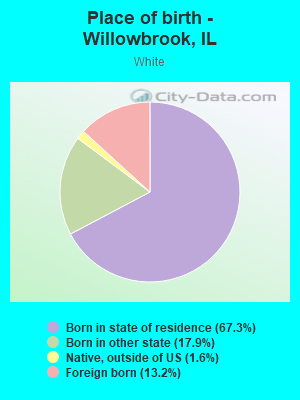
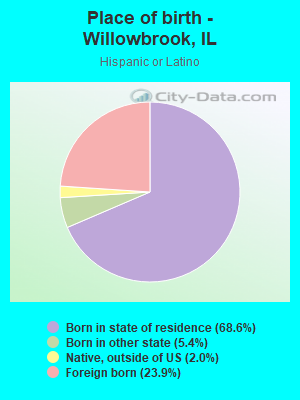
Place of birth - Born in state of residence (%)
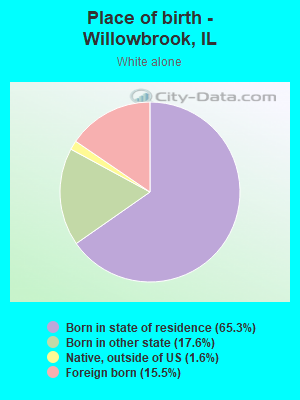
Place of birth - Born in state of residence (%) - White
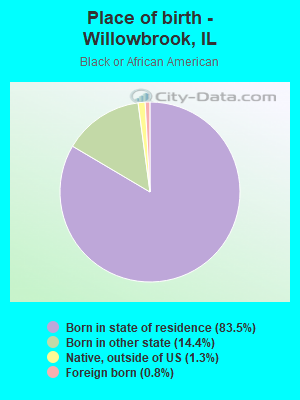
Place of birth - Born in state of residence (%) - Black or African American
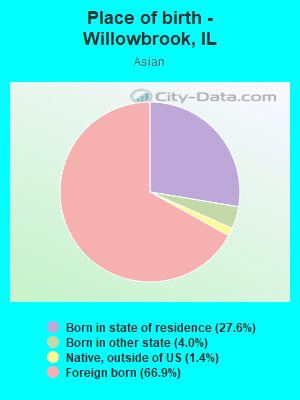
Place of birth - Born in state of residence (%) - Asian
Place of birth - Born in state of residence (%) - Hispanic or Latino
Place of birth - Born in state of residence (%) - American Indian and Alaska Native
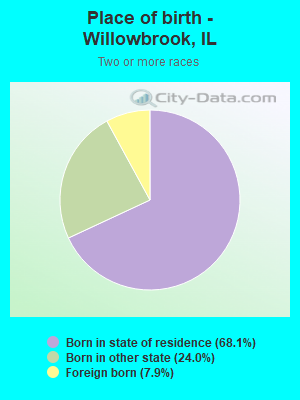
Place of birth - Born in state of residence (%) - Multirace
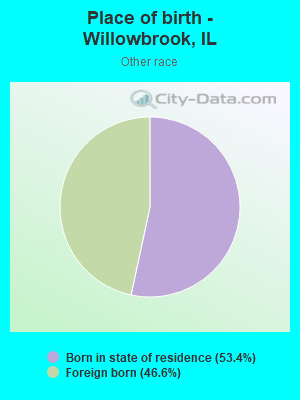
Place of birth - Born in state of residence (%) - Other Race
Place of birth - Born in other state (%)
Place of birth - Born in other state (%) - White
Place of birth - Born in other state (%) - Black or African American
Place of birth - Born in other state (%) - Asian
Place of birth - Born in other state (%) - Hispanic or Latino
Place of birth - Born in other state (%) - American Indian and Alaska Native
Place of birth - Born in other state (%) - Multirace
Place of birth - Born in other state (%) - Other Race
Place of birth - Native, outside of US (%)
Place of birth - Native, outside of US (%) - White
Place of birth - Native, outside of US (%) - Black or African American
Place of birth - Native, outside of US (%) - Asian
Place of birth - Native, outside of US (%) - Hispanic or Latino
Place of birth - Native, outside of US (%) - American Indian and Alaska Native
Place of birth - Native, outside of US (%) - Multirace
Place of birth - Native, outside of US (%) - Other Race
Place of birth - Foreign born (%)
Place of birth - Foreign born (%) - White
Place of birth - Foreign born (%) - Black or African American
Place of birth - Foreign born (%) - Asian
Place of birth - Foreign born (%) - Hispanic or Latino
Place of birth - Foreign born (%) - American Indian and Alaska Native
Place of birth - Foreign born (%) - Multirace
Place of birth - Foreign born (%) - Other Race
Residents speaking English at home (%)
Residents speaking English at home - Born in the United States (%)
Residents speaking English at home - Native, born elsewhere (%)
Residents speaking English at home - Foreign born (%)
Residents speaking Spanish at home (%)
Residents speaking Spanish at home - Born in the United States (%)
Residents speaking Spanish at home - Native, born elsewhere (%)
Residents speaking Spanish at home - Foreign born (%)
Residents speaking other language at home (%)
Residents speaking other language at home - Born in the United States (%)
Residents speaking other language at home - Native, born elsewhere (%)
Residents speaking other language at home - Foreign born (%)
Marital status - Never married (%)
Marital status - Now married (%)
Marital status - Separated (%)
Marital status - Widowed (%)
Marital status - Divorced (%)
Ancestries Reported - Arab (%)
Ancestries Reported - Czech (%)
Ancestries Reported - Danish (%)
Ancestries Reported - Dutch (%)
Ancestries Reported - English (%)
Ancestries Reported - French (%)
Ancestries Reported - French Canadian (%)
Ancestries Reported - German (%)
Ancestries Reported - Greek (%)
Ancestries Reported - Hungarian (%)
Ancestries Reported - Irish (%)
Ancestries Reported - Italian (%)
Ancestries Reported - Lithuanian (%)
Ancestries Reported - Norwegian (%)
Ancestries Reported - Polish (%)
Ancestries Reported - Portuguese (%)
Ancestries Reported - Russian (%)
Ancestries Reported - Scotch-Irish (%)
Ancestries Reported - Scottish (%)
Ancestries Reported - Slovak (%)
Ancestries Reported - Subsaharan African (%)
Ancestries Reported - Swedish (%)
Ancestries Reported - Swiss (%)
Ancestries Reported - Ukrainian (%)
Ancestries Reported - United States (%)
Ancestries Reported - Welsh (%)
Ancestries Reported - West Indian (%)
Ancestries Reported - Other (%)
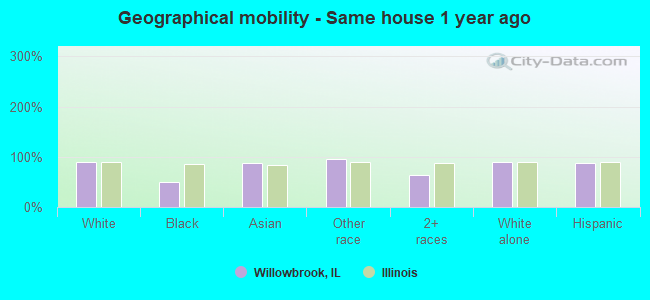
Geographical mobility - Same house 1 year ago (%)
Geographical mobility - Same house 1 year ago (%) - White
Geographical mobility - Same house 1 year ago (%) - Black or African American
Geographical mobility - Same house 1 year ago (%) - Asian
Geographical mobility - Same house 1 year ago (%) - Hispanic or Latino
Geographical mobility - Same house 1 year ago (%) - American Indian and Alaska Native
Geographical mobility - Same house 1 year ago (%) - Multirace
Geographical mobility - Same house 1 year ago (%) - Other Race
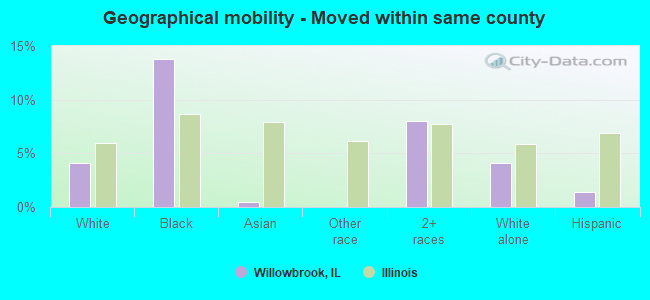
Geographical mobility - Moved within same county (%)
Geographical mobility - Moved within same county (%) - White
Geographical mobility - Moved within same county (%) - Black or African American
Geographical mobility - Moved within same county (%) - Asian
Geographical mobility - Moved within same county (%) - Hispanic or Latino
Geographical mobility - Moved within same county (%) - American Indian and Alaska Native
Geographical mobility - Moved within same county (%) - Multirace
Geographical mobility - Moved within same county (%) - Other Race
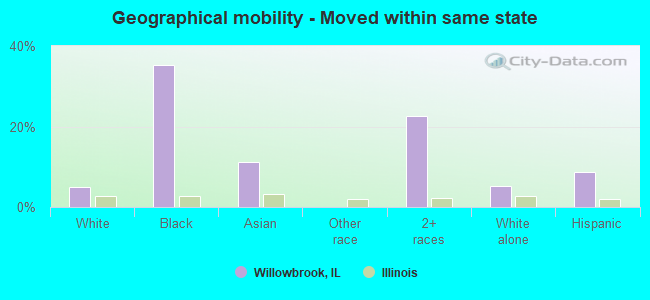
Geographical mobility - Moved from different county within same state (%)
Geographical mobility - Moved from different county within same state (%) - White
Geographical mobility - Moved from different county within same state (%) - Black or African American
Geographical mobility - Moved from different county within same state (%) - Asian
Geographical mobility - Moved from different county within same state (%) - Hispanic or Latino
Geographical mobility - Moved from different county within same state (%) - American Indian and Alaska Native
Geographical mobility - Moved from different county within same state (%) - Multirace
Geographical mobility - Moved from different county within same state (%) - Other Race
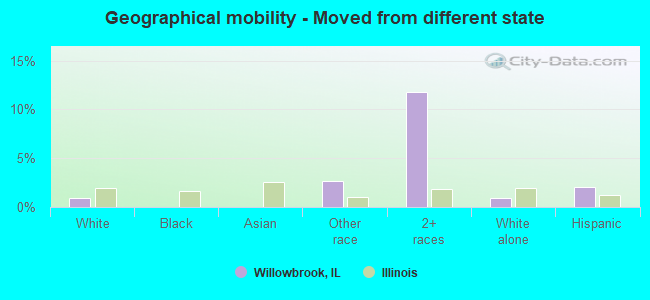
Geographical mobility - Moved from different state (%)
Geographical mobility - Moved from different state (%) - White
Geographical mobility - Moved from different state (%) - Black or African American
Geographical mobility - Moved from different state (%) - Asian
Geographical mobility - Moved from different state (%) - Hispanic or Latino
Geographical mobility - Moved from different state (%) - American Indian and Alaska Native
Geographical mobility - Moved from different state (%) - Multirace
Geographical mobility - Moved from different state (%) - Other Race
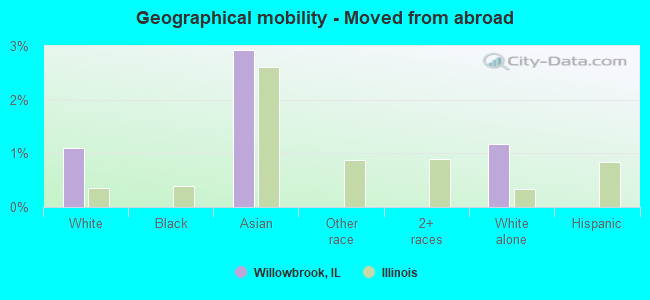
Geographical mobility - Moved from abroad (%)
Geographical mobility - Moved from abroad (%) - White
Geographical mobility - Moved from abroad (%) - Black or African American
Geographical mobility - Moved from abroad (%) - Asian
Geographical mobility - Moved from abroad (%) - Hispanic or Latino
Geographical mobility - Moved from abroad (%) - American Indian and Alaska Native
Geographical mobility - Moved from abroad (%) - Multirace
Geographical mobility - Moved from abroad (%) - Other Race
Place of birth for the foreign-born population - Ireland (%)
Place of birth for the foreign-born population - Denmark (%)
Place of birth for the foreign-born population - Norway (%)
Place of birth for the foreign-born population - Sweden (%)
Place of birth for the foreign-born population - United Kingdom (%)
Place of birth for the foreign-born population - England (%)
Place of birth for the foreign-born population - Scotland (%)
Place of birth for the foreign-born population - Other Northern Europe (%)
Place of birth for the foreign-born population - Austria (%)
Place of birth for the foreign-born population - Belgium (%)
Place of birth for the foreign-born population - France (%)
Place of birth for the foreign-born population - Germany (%)
Place of birth for the foreign-born population - Netherlands (%)
Place of birth for the foreign-born population - Switzerland (%)
Place of birth for the foreign-born population - Other Western Europe (%)
Place of birth for the foreign-born population - Greece (%)
Place of birth for the foreign-born population - Italy (%)
Place of birth for the foreign-born population - Portugal (%)
Place of birth for the foreign-born population - Spain (%)
Place of birth for the foreign-born population - Other Southern Europe (%)
Place of birth for the foreign-born population - Albania (%)
Place of birth for the foreign-born population - Belarus (%)
Place of birth for the foreign-born population - Bosnia and Herzegovina (%)
Place of birth for the foreign-born population - Bulgaria (%)
Place of birth for the foreign-born population - Croatia (%)
Place of birth for the foreign-born population - Czechoslovakia (%)
Place of birth for the foreign-born population - Hungary (%)
Place of birth for the foreign-born population - Latvia (%)
Place of birth for the foreign-born population - Lithuania (%)
Place of birth for the foreign-born population - North Macedonia (Macedonia) (%)
Place of birth for the foreign-born population - Moldova (%)
Place of birth for the foreign-born population - Poland (%)
Place of birth for the foreign-born population - Romania (%)
Place of birth for the foreign-born population - Russia (%)
Place of birth for the foreign-born population - Serbia (%)
Place of birth for the foreign-born population - Ukraine (%)
Place of birth for the foreign-born population - Other Eastern Europe (%)
Place of birth for the foreign-born population - China (%)
Place of birth for the foreign-born population - Hong Kong (%)
Place of birth for the foreign-born population - Taiwan (%)
Place of birth for the foreign-born population - Japan (%)
Place of birth for the foreign-born population - Korea (%)
Place of birth for the foreign-born population - Other Eastern Asia (%)
Place of birth for the foreign-born population - Afghanistan (%)
Place of birth for the foreign-born population - Bangladesh (%)
Place of birth for the foreign-born population - India (%)
Place of birth for the foreign-born population - Iran (%)
Place of birth for the foreign-born population - Kazakhstan (%)
Place of birth for the foreign-born population - Nepal (%)
Place of birth for the foreign-born population - Pakistan (%)
Place of birth for the foreign-born population - Sri Lanka (%)
Place of birth for the foreign-born population - Uzbekistan (%)
Place of birth for the foreign-born population - Other South Central Asia (%)
Place of birth for the foreign-born population - Burma (%)
Place of birth for the foreign-born population - Cambodia (%)
Place of birth for the foreign-born population - Indonesia (%)
Place of birth for the foreign-born population - Laos (%)
Place of birth for the foreign-born population - Malaysia (%)
Place of birth for the foreign-born population - Philippines (%)
Place of birth for the foreign-born population - Singapore (%)
Place of birth for the foreign-born population - Thailand (%)
Place of birth for the foreign-born population - Vietnam (%)
Place of birth for the foreign-born population - Other South Eastern Asia (%)
Place of birth for the foreign-born population - Armenia (%)
Place of birth for the foreign-born population - Iraq (%)
Place of birth for the foreign-born population - Israel (%)
Place of birth for the foreign-born population - Jordan (%)
Place of birth for the foreign-born population - Kuwait (%)
Place of birth for the foreign-born population - Lebanon (%)
Place of birth for the foreign-born population - Saudi Arabia (%)
Place of birth for the foreign-born population - Syria (%)
Place of birth for the foreign-born population - Turkey (%)
Place of birth for the foreign-born population - Yemen (%)
Place of birth for the foreign-born population - Other Western Asia (%)
Place of birth for the foreign-born population - Eritrea (%)
Place of birth for the foreign-born population - Ethiopia (%)
Place of birth for the foreign-born population - Kenya (%)
Place of birth for the foreign-born population - Somalia (%)
Place of birth for the foreign-born population - Uganda (%)
Place of birth for the foreign-born population - Zimbabwe (%)
Place of birth for the foreign-born population - Other Eastern Africa (%)
Place of birth for the foreign-born population - Cameroon (%)
Place of birth for the foreign-born population - Congo (%)
Place of birth for the foreign-born population - Democratic Republic of Congo (Zaire) (%)
Place of birth for the foreign-born population - Other Middle Africa (%)
Place of birth for the foreign-born population - Egypt (%)
Place of birth for the foreign-born population - Morocco (%)
Place of birth for the foreign-born population - Sudan (%)
Place of birth for the foreign-born population - Other Northern Africa (%)
Place of birth for the foreign-born population - South Africa (%)
Place of birth for the foreign-born population - Other Southern Africa (%)
Place of birth for the foreign-born population - Cabo Verde (%)
Place of birth for the foreign-born population - Ghana (%)
Place of birth for the foreign-born population - Liberia (%)
Place of birth for the foreign-born population - Nigeria (%)
Place of birth for the foreign-born population - Senegal (%)
Place of birth for the foreign-born population - Sierra Leone (%)
Place of birth for the foreign-born population - Other Western Africa (%)
Place of birth for the foreign-born population - Australia (%)
Place of birth for the foreign-born population - New Zealand (%)
Place of birth for the foreign-born population - Fiji (%)
Place of birth for the foreign-born population - Micronesia (%)
Place of birth for the foreign-born population - Bahamas (%)
Place of birth for the foreign-born population - Barbados (%)
Place of birth for the foreign-born population - Cuba (%)
Place of birth for the foreign-born population - Dominica (%)
Place of birth for the foreign-born population - Dominican Republic (%)
Place of birth for the foreign-born population - Grenada (%)
Place of birth for the foreign-born population - Haiti (%)
Place of birth for the foreign-born population - Jamaica (%)
Place of birth for the foreign-born population - St. Vincent and the Grenadines (%)
Place of birth for the foreign-born population - Trinidad and Tobago (%)
Place of birth for the foreign-born population - West Indies (%)
Place of birth for the foreign-born population - Other Caribbean (%)
Place of birth for the foreign-born population - Belize (%)
Place of birth for the foreign-born population - Costa Rica (%)
Place of birth for the foreign-born population - El Salvador (%)
Place of birth for the foreign-born population - Guatemala (%)
Place of birth for the foreign-born population - Honduras (%)
Place of birth for the foreign-born population - Mexico (%)
Place of birth for the foreign-born population - Nicaragua (%)
Place of birth for the foreign-born population - Panama (%)
Place of birth for the foreign-born population - Other Central America (%)
Place of birth for the foreign-born population - Argentina (%)
Place of birth for the foreign-born population - Bolivia (%)
Place of birth for the foreign-born population - Brazil (%)
Place of birth for the foreign-born population - Chile (%)
Place of birth for the foreign-born population - Colombia (%)
Place of birth for the foreign-born population - Ecuador (%)
Place of birth for the foreign-born population - Guyana (%)
Place of birth for the foreign-born population - Peru (%)
Place of birth for the foreign-born population - Uruguay (%)
Place of birth for the foreign-born population - Venezuela (%)
Place of birth for the foreign-born population - Other South America (%)
Place of birth for the foreign-born population - Canada (%)
Place of birth for the foreign-born population - Other Northern America (%)
Place of birth for the foreign-born population - Other (%)
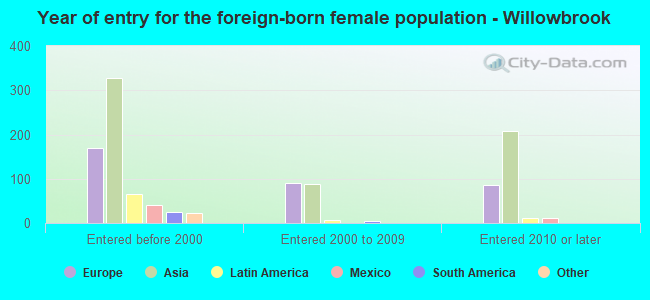
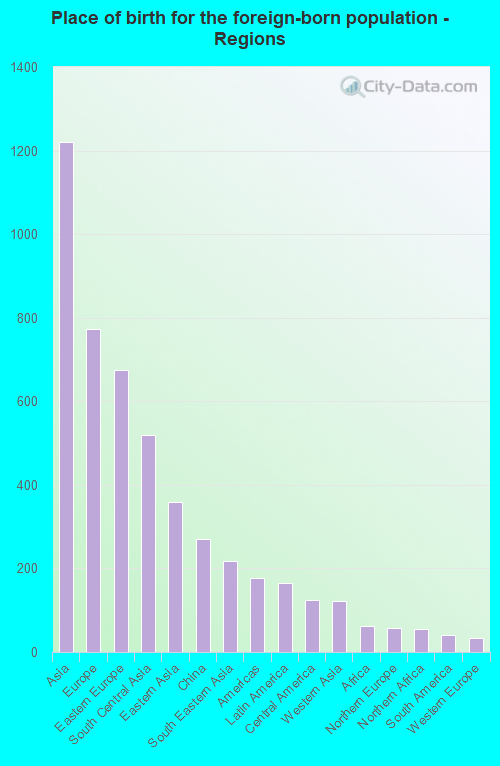
According to 2022 data, the most numerous races in Willowbrook, IL are White alone (6,164 residents), Hispanic (679 residents), and Black alone (268 residents). 69.4% of Willowbrook residents speak English at home. 24.6% of Willowbrook, IL residents are foreign-born (13.3% born in Asia, 8.4% born in Europe), which is 43.0% greater than the foreign-born rate of 14.0% across the entire state of Illinois.
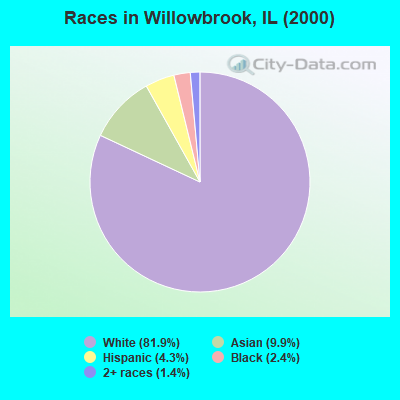
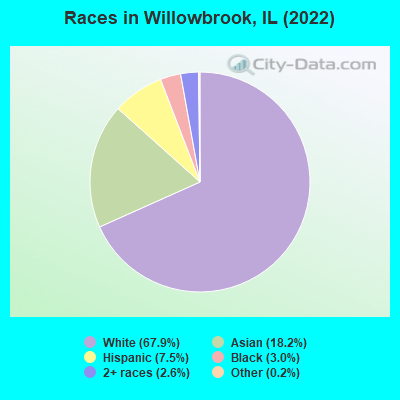
Race distribution in Willowbrook
2000 2022
8,424,140 67.8% White alone 1,856,152 14.9% Black alone 1,530,262 12.3% Hispanic 419,916 3.4% Asian alone 153,996 1.2% Two or more races 13,479 0.1% Other race alone 18,232 0.1% American Indian alone 3,116 0.03% Native Hawaiian and Other
7,356,301 58.5% White alone 2,299,726 18.3% Hispanic 1,660,423 13.2% Black alone 747,296 5.9% Asian alone 458,599 3.6% Two or more races 45,386 0.4% Other race alone 10,405 0.08% American Indian alone 3,896 0.03% Native Hawaiian and Other
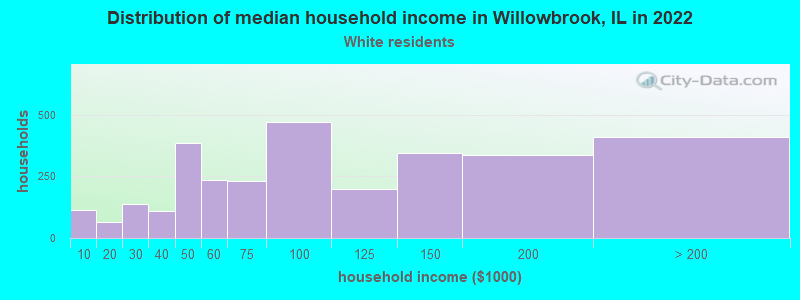
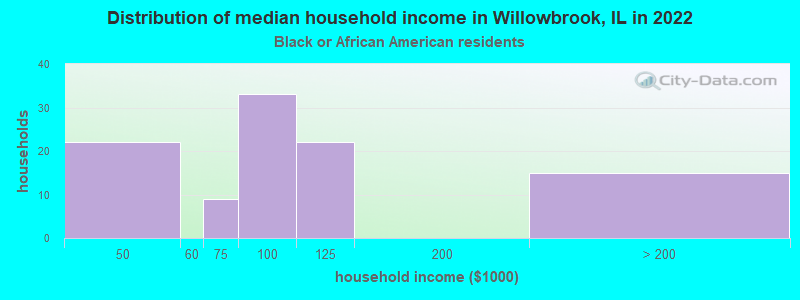
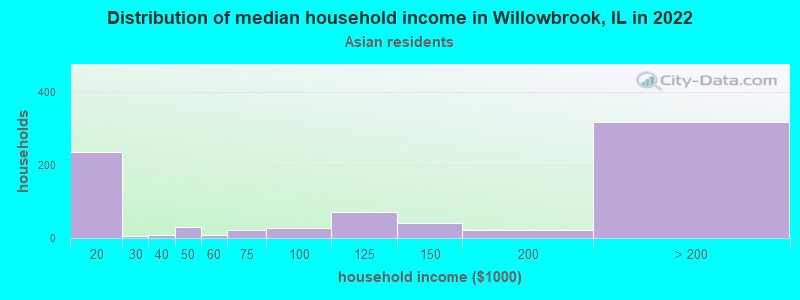
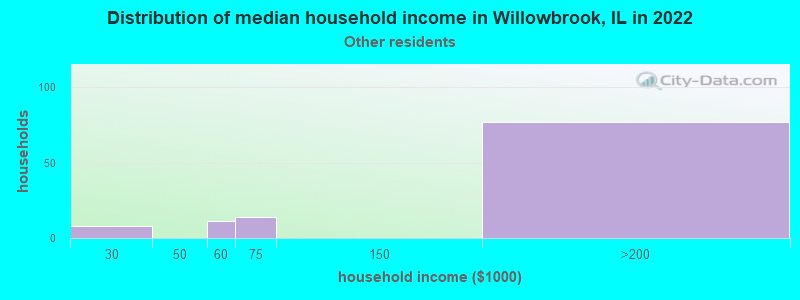
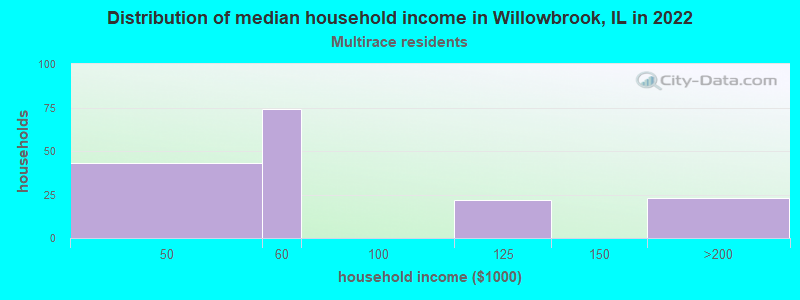
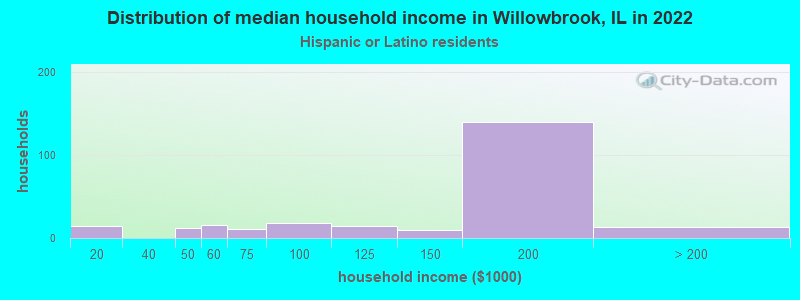
Income and house value in Willowbrook Median household income in 2022 $85,446 White non-Hispanic householders$80,336 Black householders$143,357 Asian householders$57,120 Two or more races householders$148,058 Hispanic or Latino race householdersMedian 2022 house value $504,699 White Non-Hispanic householders$396,058 Black or African American householders $617,502 Asian householders$135,280 Some other race householders$936,555 Two or more races householders$396,058 Hispanic or Latino householders
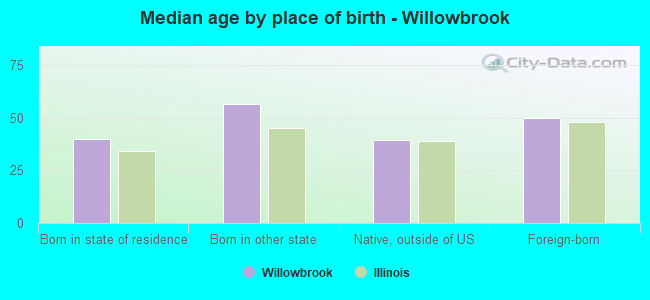
Median age by race in Willowbrook
53.2 Median age for White residents49.5 57.3 26.1 Median age for Black or African American residents35.8 13.5 -699,421,964.6 Median age for American Indian / Alaska Native residents-721,943,047.9 -545,253,862.6 40.8 Median age for Asian residents39.1 46.3 -593,236,714.4 Median age for Native Hawaiian / Pacific Islander residents-658,536,584.7 -576,015,108.0 30.7 Median age for Other race residents29.7 34.8 33.3 Median age for Two or more races residents34.7 32.9 52.1 Median age for White alone residents49.0 56.9 32.9 Median age for Hispanic or Latino residents32.8 33.1
Owner/renter occupied households by race in Willowbrook
House owners and renters - White residents 2,429 80.6% Owner occupied585 19.4% Renter occupiedHouse owners and renters - Black or African American residents 61 61.9% Owner occupied38 38.1% Renter occupiedHouse owners and renters - Asian residents 512 78.1% Owner occupied143 21.9% Renter occupiedHouse owners and renters - Other race residents 14 14.3% Owner occupied83 85.7% Renter occupiedHouse owners and renters - Two or more races residents 30 22.5% Owner occupied104 77.5% Renter occupiedHouse owners and renters - White alone residents 2,422 81.0% Owner occupied568 19.0% Renter occupiedHouse owners and renters - Hispanic or Latino residents 87 37.4% Owner occupied145 62.6% Renter occupied
Language usage in Willowbrook
English speakers - Total 69.4% of residents of Willowbrook speak English at home.
2.9% of residents speak Spanish at home 197 77.6% Speak English very well57 22.4% Speak English less than very well26.9% of residents speak other language at home 1,821 78.4% Speak English very well502 21.6% Speak English less than very well
English speakers - Born in the United States 95.6% of residents of Willowbrook speak English at home.
0.7% of residents speak Spanish at home 9 100.0% Speak English very well4.0% of residents speak other language at home 44 84.6% Speak English very well8 15.4% Speak English less than very well
English speakers - Native, born elsewhere 28.3% of residents of Willowbrook speak English at home.
9.2% of residents speak Spanish at home 14 100.0% Speak English less than very well46.7% of residents speak other language at home 54 76.1% Speak English very well17 23.9% Speak English less than very well
English speakers - Foreign-born 14.0% of residents of Willowbrook speak English at home.
5.9% of residents speak Spanish at home 89 67.9% Speak English very well42 32.1% Speak English less than very well78.1% of residents speak other language at home 1,274 73.4% Speak English very well462 26.6% Speak English less than very well
White (Caucasian) - Speak only English Native:
92.9% (4,766)Foreign-born:
24.1% (196)
White (Caucasian) - Speak another language Native:
6.7% (344)Foreign-born:
76.8% (626)
Black or African American - Speak only English Native:
98.9% (248)Foreign-born:
100.0% (2)
Asian - Speak only English Native:
54.3% (231)Foreign-born:
7.4% (82)
Asian - Speak another language Native:
44.5% (189)Foreign-born:
92.9% (1,031)
Other race - Speak only English Native:
69.4% (91)Foreign-born:
14.6% (24)
Other race - Speak another language Native:
39.2% (52)Foreign-born:
83.4% (134)
Two or more races - Speak only English Native:
90.7% (278)Foreign-born:
32.4% (9)
Two or more races - Speak another language Native:
4.6% (14)Foreign-born:
63.3% (19)
White alone - Speak only English Native:
91.3% (4,567)Foreign-born:
22.7% (217)
White alone - Speak another language Native:
8.4% (419)Foreign-born:
77.5% (739)
Hispanic or Latino - Speak only English Native:
80.4% (355)Foreign-born:
11.5% (19)
Hispanic or Latino - Speak another language Native:
17.7% (78)Foreign-born:
87.9% (142)
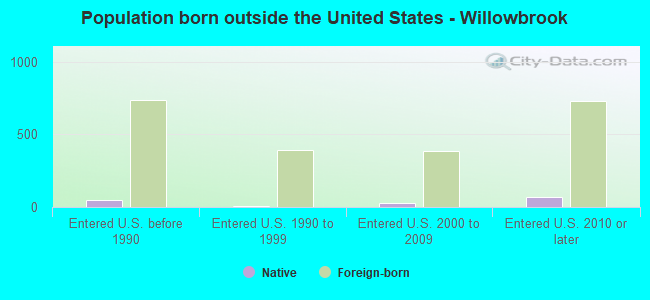
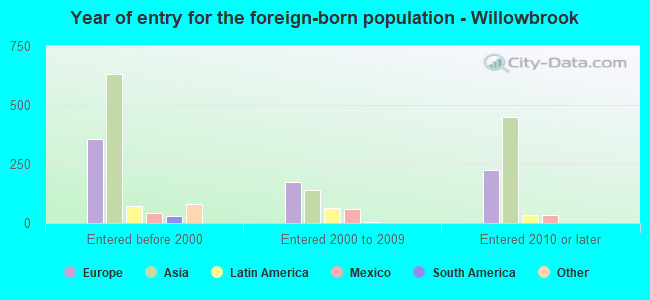
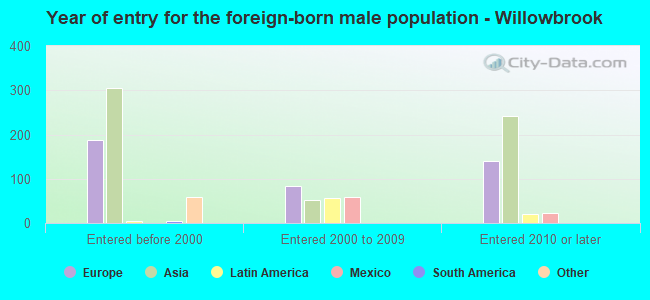
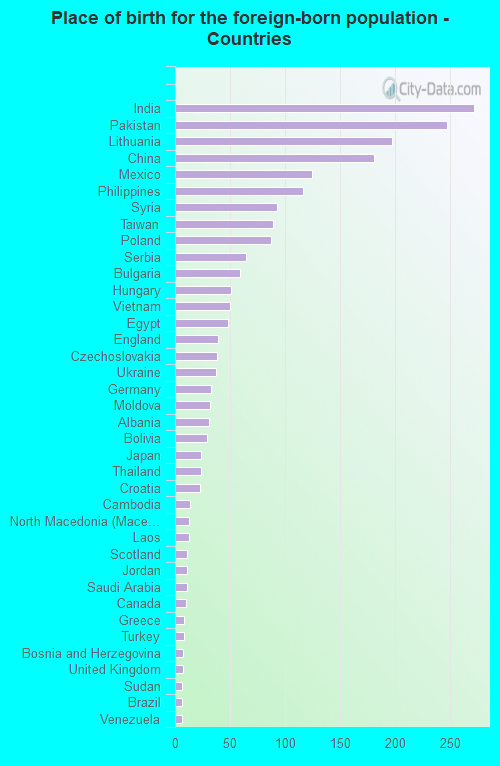
Foreign-born residents in Willowbrook 2,231 residents are foreign born (13.3% Asia , 8.4% Europe ).
This city:
24.6%Illinois:
14.1%
Marital status for residents in Willowbrook Marital status - White (Caucasian) population 15 years and over
Males 29.4% Never married61.3% Now married0.3% Separated1.9% Widowed7.1% DivorcedFemales 24.8% Never married48.7% Now married0.6% Separated13.1% Widowed12.9% DivorcedWomen who gave birth in the past 12 months Now married:
100.0% (32)Unmarried:
0.0% (0)
Women who did not give birth in the past 12 months Now married:
39.6% (472)Unmarried:
60.4% (719)
Marital status - Black or African American population 15 years and over
Males 46.5% Never married36.0% Now married0.0% Separated0.0% Widowed17.4% DivorcedFemales 61.6% Never married9.3% Now married0.0% Separated19.8% Widowed9.3% DivorcedWomen who gave birth in the past 12 months Now married:
0.0% (0)Unmarried:
100.0% (26)
Women who did not give birth in the past 12 months Now married:
32.0% (8)Unmarried:
68.0% (17)
Marital status - Asian population 15 years and over
Males 28.8% Never married62.1% Now married0.0% Separated2.7% Widowed6.4% DivorcedFemales 16.6% Never married67.2% Now married0.0% Separated7.9% Widowed8.2% DivorcedWomen who gave birth in the past 12 months Now married:
72.7% (24)Unmarried:
27.3% (9)
Women who did not give birth in the past 12 months Now married:
70.3% (203)Unmarried:
29.7% (86)
Marital status - Other race population 15 years and over
Males 0.0% Never married100.0% Now married0.0% Separated0.0% Widowed0.0% DivorcedFemales 14.1% Never married85.9% Now married0.0% Separated0.0% Widowed0.0% DivorcedWomen who did not give birth in the past 12 months Now married:
100.0% (170)Unmarried:
0.0% (0)
Marital status - Two or more races population 15 years and over
Males 55.3% Never married44.7% Now married0.0% Separated0.0% Widowed0.0% DivorcedFemales 74.5% Never married17.3% Now married0.0% Separated8.2% Widowed0.0% DivorcedWomen who did not give birth in the past 12 months Now married:
18.9% (24)Unmarried:
81.1% (104)
Marital status - White alone, not Hispanic / Latino population 15 years and over
Males 30.0% Never married61.4% Now married0.4% Separated1.6% Widowed6.6% DivorcedFemales 25.0% Never married47.5% Now married0.6% Separated13.6% Widowed13.3% DivorcedWomen who gave birth in the past 12 months Now married:
100.0% (34)Unmarried:
0.0% (0)
Women who did not give birth in the past 12 months Now married:
40.3% (504)Unmarried:
59.7% (748)
Marital status - Hispanic or Latino population 15 years and over
Males 13.4% Never married73.7% Now married0.0% Separated3.8% Widowed9.2% DivorcedFemales 21.5% Never married78.5% Now married0.0% Separated0.0% Widowed0.0% DivorcedWomen who did not give birth in the past 12 months Now married:
75.3% (123)Unmarried:
24.7% (40)
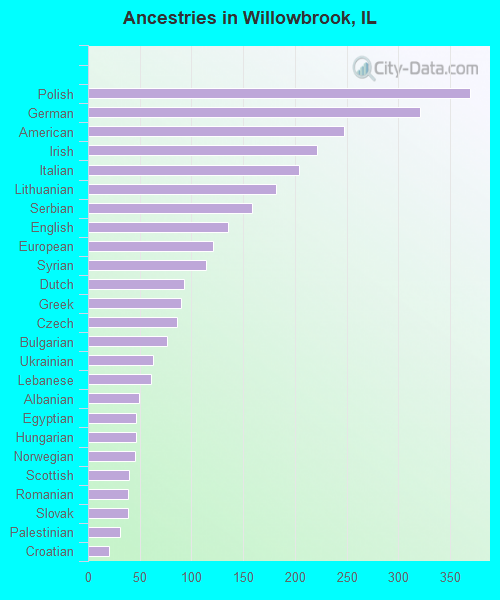
Ancestries in Willowbrook
369 7.8% Polish321 6.8% German247 5.2% American221 4.7% Irish204 4.3% Italian182 3.8% Lithuanian158 3.3% Serbian135 2.9% English121 2.6% European114 2.4% Syrian93 2.0% Dutch90 1.9% Greek86 1.8% Czech76 1.6% Bulgarian63 1.3% Ukrainian61 1.3% Lebanese49 1.0% Albanian46 1.0% Egyptian46 1.0% Hungarian45 1.0% Norwegian40 0.8% Scottish39 0.8% Romanian39 0.8% Slovak31 0.7% Palestinian20 0.4% Croatian19 0.4% Eastern European18 0.4% Macedonian16 0.3% Iranian15 0.3% Slovene14 0.3% Turkish11 0.2% Jordanian10 0.2% Scandinavian10 0.2% Sudanese7 0.1% Russian7 0.1% Scotch-Irish7 0.1% Yugoslavian6 0.1% Armenian6 0.1% Welsh5 0.1% Arab4 0.08% Danish4 0.08% French Canadian4 0.08% African
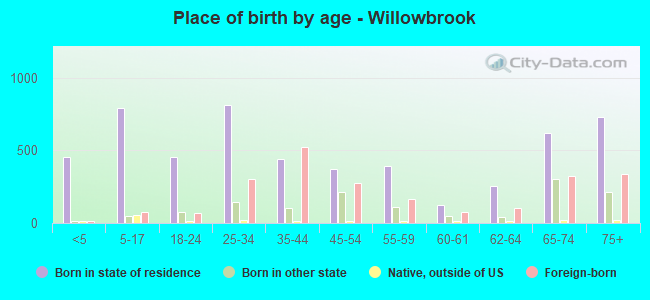
Children Nativity (place of birth) in Willowbrook
Children under 6 years - Living with two parents Both parents native 114 100.0% NativeBoth parents foreign-born 140 100.0% NativeOne native, one foreign-born parent 143 100.0% NativeChildren under 6 years - Living with one parent Native parent 104 100.0% NativeForeign-born parent 6 100.0% NativeChildren 6 to 17 years - Living with two parents Both parents native 145 100.0% NativeBoth parents foreign-born 149 84.1% Native28 15.9% Foreign-bornOne native, one foreign-born parent 159 87.0% Native24 13.0% Foreign-bornChildren 6 to 17 years - Living with one parent Native parent 262 100.0% NativeForeign-born parent 88 54.4% Native73 45.6% Foreign-born
Grandparents responsible for own grandchildren in Willowbrook
Grandparents (30 to 59 years) White / Caucasian 43 100.0% Not responsible for grandchildrenWhite alone, not Hispanic / Latino 48 100.0% Not responsible for grandchildrenGrandparents (60 years and over) White / Caucasian 14 14.0% Responsible for grandchildren83 86.0% Not responsible for grandchildrenWhite alone, not Hispanic / Latino 15 16.6% Responsible for grandchildren75 83.4% Not responsible for grandchildren