Races in Windsor Locks, Connecticut (CT) Detailed Stats
Data:
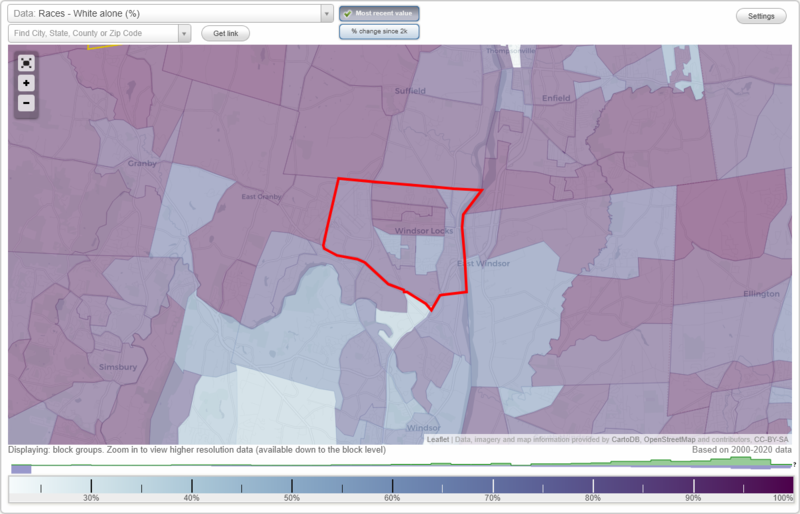
Races - White alone (%)
Races - White alone (% change since 2000)
Races - Black alone (%)
Races - Black alone (% change since 2000)
Races - American Indian alone (%)
Races - American Indian alone (% change since 2000)
Races - Asian alone (%)
Races - Asian alone (% change since 2000)
Races - Hispanic (%)
Races - Hispanic (% change since 2000)
Races - Native Hawaiian and Other Pacific Islander alone (%)
Races - Native Hawaiian and Other Pacific Islander alone (% change since 2000)
Races - Two or more races(%)
Races - Two or more races(% change since 2000)
Races - Other race alone (%)
Races - Other race alone (% change since 2000)
Racial diversity
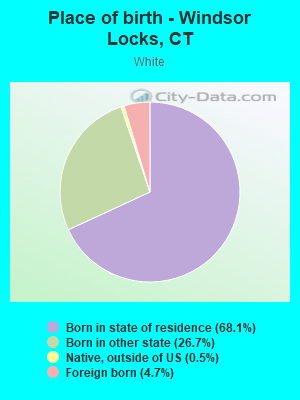
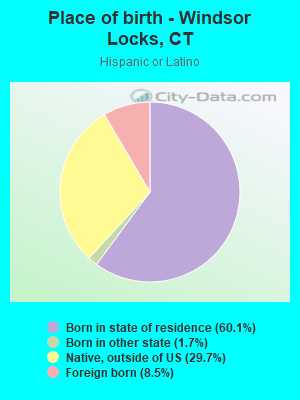
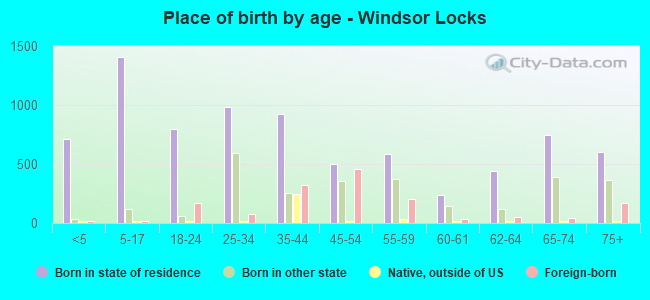
Place of birth - Born in state of residence (%)
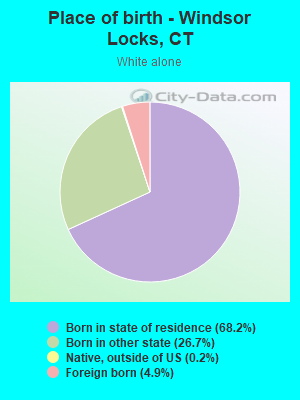
Place of birth - Born in state of residence (%) - White
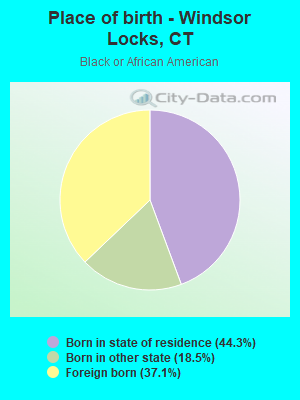
Place of birth - Born in state of residence (%) - Black or African American
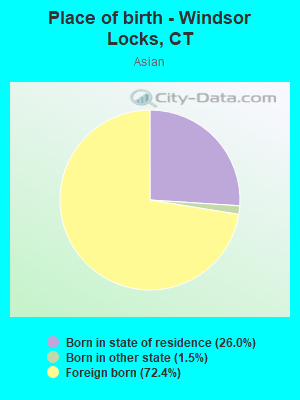
Place of birth - Born in state of residence (%) - Asian
Place of birth - Born in state of residence (%) - Hispanic or Latino
Place of birth - Born in state of residence (%) - American Indian and Alaska Native
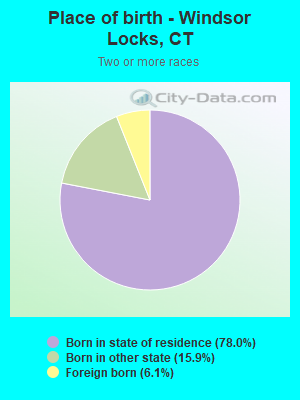
Place of birth - Born in state of residence (%) - Multirace
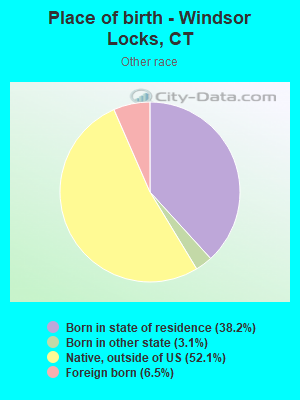
Place of birth - Born in state of residence (%) - Other Race
Place of birth - Born in other state (%)
Place of birth - Born in other state (%) - White
Place of birth - Born in other state (%) - Black or African American
Place of birth - Born in other state (%) - Asian
Place of birth - Born in other state (%) - Hispanic or Latino
Place of birth - Born in other state (%) - American Indian and Alaska Native
Place of birth - Born in other state (%) - Multirace
Place of birth - Born in other state (%) - Other Race
Place of birth - Native, outside of US (%)
Place of birth - Native, outside of US (%) - White
Place of birth - Native, outside of US (%) - Black or African American
Place of birth - Native, outside of US (%) - Asian
Place of birth - Native, outside of US (%) - Hispanic or Latino
Place of birth - Native, outside of US (%) - American Indian and Alaska Native
Place of birth - Native, outside of US (%) - Multirace
Place of birth - Native, outside of US (%) - Other Race
Place of birth - Foreign born (%)
Place of birth - Foreign born (%) - White
Place of birth - Foreign born (%) - Black or African American
Place of birth - Foreign born (%) - Asian
Place of birth - Foreign born (%) - Hispanic or Latino
Place of birth - Foreign born (%) - American Indian and Alaska Native
Place of birth - Foreign born (%) - Multirace
Place of birth - Foreign born (%) - Other Race
Residents speaking English at home (%)
Residents speaking English at home - Born in the United States (%)
Residents speaking English at home - Native, born elsewhere (%)
Residents speaking English at home - Foreign born (%)
Residents speaking Spanish at home (%)
Residents speaking Spanish at home - Born in the United States (%)
Residents speaking Spanish at home - Native, born elsewhere (%)
Residents speaking Spanish at home - Foreign born (%)
Residents speaking other language at home (%)
Residents speaking other language at home - Born in the United States (%)
Residents speaking other language at home - Native, born elsewhere (%)
Residents speaking other language at home - Foreign born (%)
Marital status - Never married (%)
Marital status - Now married (%)
Marital status - Separated (%)
Marital status - Widowed (%)
Marital status - Divorced (%)
Ancestries Reported - Arab (%)
Ancestries Reported - Czech (%)
Ancestries Reported - Danish (%)
Ancestries Reported - Dutch (%)
Ancestries Reported - English (%)
Ancestries Reported - French (%)
Ancestries Reported - French Canadian (%)
Ancestries Reported - German (%)
Ancestries Reported - Greek (%)
Ancestries Reported - Hungarian (%)
Ancestries Reported - Irish (%)
Ancestries Reported - Italian (%)
Ancestries Reported - Lithuanian (%)
Ancestries Reported - Norwegian (%)
Ancestries Reported - Polish (%)
Ancestries Reported - Portuguese (%)
Ancestries Reported - Russian (%)
Ancestries Reported - Scotch-Irish (%)
Ancestries Reported - Scottish (%)
Ancestries Reported - Slovak (%)
Ancestries Reported - Subsaharan African (%)
Ancestries Reported - Swedish (%)
Ancestries Reported - Swiss (%)
Ancestries Reported - Ukrainian (%)
Ancestries Reported - United States (%)
Ancestries Reported - Welsh (%)
Ancestries Reported - West Indian (%)
Ancestries Reported - Other (%)
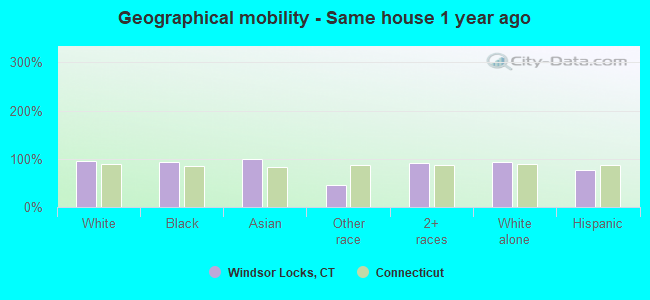
Geographical mobility - Same house 1 year ago (%)
Geographical mobility - Same house 1 year ago (%) - White
Geographical mobility - Same house 1 year ago (%) - Black or African American
Geographical mobility - Same house 1 year ago (%) - Asian
Geographical mobility - Same house 1 year ago (%) - Hispanic or Latino
Geographical mobility - Same house 1 year ago (%) - American Indian and Alaska Native
Geographical mobility - Same house 1 year ago (%) - Multirace
Geographical mobility - Same house 1 year ago (%) - Other Race
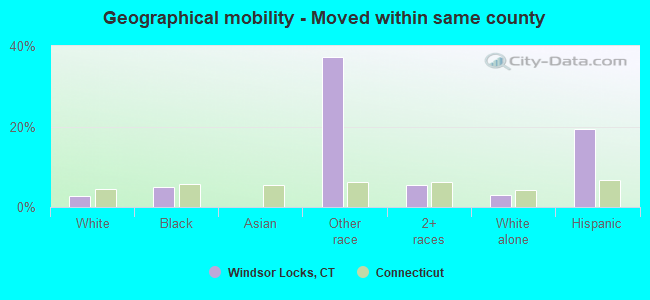
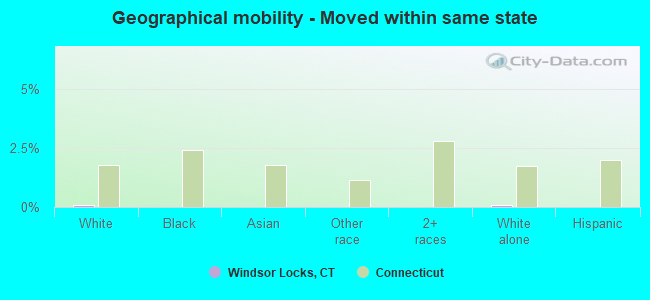
Geographical mobility - Moved within same county (%)
Geographical mobility - Moved within same county (%) - White
Geographical mobility - Moved within same county (%) - Black or African American
Geographical mobility - Moved within same county (%) - Asian
Geographical mobility - Moved within same county (%) - Hispanic or Latino
Geographical mobility - Moved within same county (%) - American Indian and Alaska Native
Geographical mobility - Moved within same county (%) - Multirace
Geographical mobility - Moved within same county (%) - Other Race
Geographical mobility - Moved from different county within same state (%)
Geographical mobility - Moved from different county within same state (%) - White
Geographical mobility - Moved from different county within same state (%) - Black or African American
Geographical mobility - Moved from different county within same state (%) - Asian
Geographical mobility - Moved from different county within same state (%) - Hispanic or Latino
Geographical mobility - Moved from different county within same state (%) - American Indian and Alaska Native
Geographical mobility - Moved from different county within same state (%) - Multirace
Geographical mobility - Moved from different county within same state (%) - Other Race
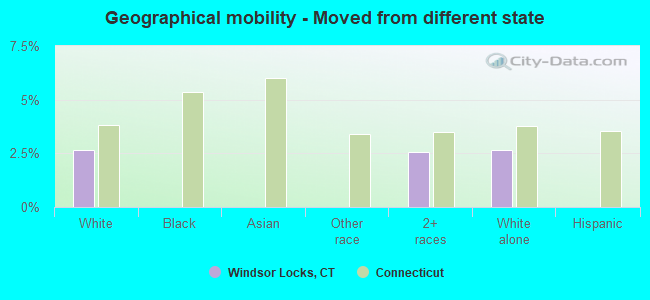
Geographical mobility - Moved from different state (%)
Geographical mobility - Moved from different state (%) - White
Geographical mobility - Moved from different state (%) - Black or African American
Geographical mobility - Moved from different state (%) - Asian
Geographical mobility - Moved from different state (%) - Hispanic or Latino
Geographical mobility - Moved from different state (%) - American Indian and Alaska Native
Geographical mobility - Moved from different state (%) - Multirace
Geographical mobility - Moved from different state (%) - Other Race
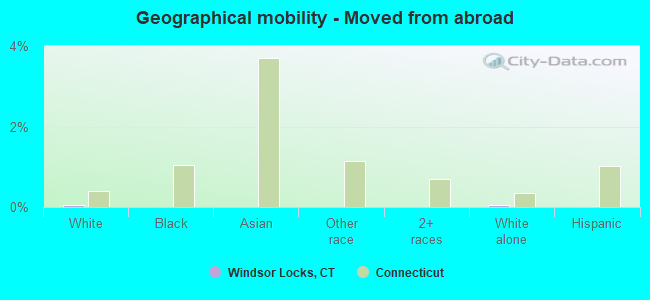
Geographical mobility - Moved from abroad (%)
Geographical mobility - Moved from abroad (%) - White
Geographical mobility - Moved from abroad (%) - Black or African American
Geographical mobility - Moved from abroad (%) - Asian
Geographical mobility - Moved from abroad (%) - Hispanic or Latino
Geographical mobility - Moved from abroad (%) - American Indian and Alaska Native
Geographical mobility - Moved from abroad (%) - Multirace
Geographical mobility - Moved from abroad (%) - Other Race
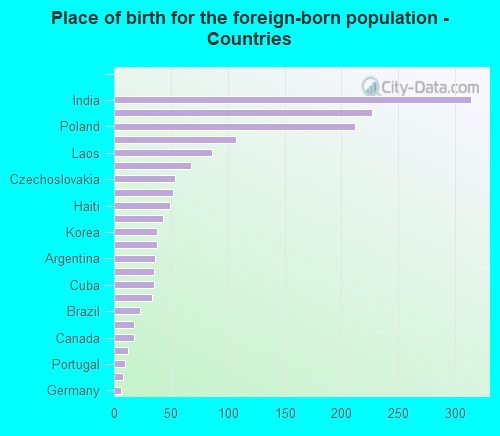
Place of birth for the foreign-born population - Ireland (%)
Place of birth for the foreign-born population - Denmark (%)
Place of birth for the foreign-born population - Norway (%)
Place of birth for the foreign-born population - Sweden (%)
Place of birth for the foreign-born population - United Kingdom (%)
Place of birth for the foreign-born population - England (%)
Place of birth for the foreign-born population - Scotland (%)
Place of birth for the foreign-born population - Other Northern Europe (%)
Place of birth for the foreign-born population - Austria (%)
Place of birth for the foreign-born population - Belgium (%)
Place of birth for the foreign-born population - France (%)
Place of birth for the foreign-born population - Germany (%)
Place of birth for the foreign-born population - Netherlands (%)
Place of birth for the foreign-born population - Switzerland (%)
Place of birth for the foreign-born population - Other Western Europe (%)
Place of birth for the foreign-born population - Greece (%)
Place of birth for the foreign-born population - Italy (%)
Place of birth for the foreign-born population - Portugal (%)
Place of birth for the foreign-born population - Spain (%)
Place of birth for the foreign-born population - Other Southern Europe (%)
Place of birth for the foreign-born population - Albania (%)
Place of birth for the foreign-born population - Belarus (%)
Place of birth for the foreign-born population - Bosnia and Herzegovina (%)
Place of birth for the foreign-born population - Bulgaria (%)
Place of birth for the foreign-born population - Croatia (%)
Place of birth for the foreign-born population - Czechoslovakia (%)
Place of birth for the foreign-born population - Hungary (%)
Place of birth for the foreign-born population - Latvia (%)
Place of birth for the foreign-born population - Lithuania (%)
Place of birth for the foreign-born population - North Macedonia (Macedonia) (%)
Place of birth for the foreign-born population - Moldova (%)
Place of birth for the foreign-born population - Poland (%)
Place of birth for the foreign-born population - Romania (%)
Place of birth for the foreign-born population - Russia (%)
Place of birth for the foreign-born population - Serbia (%)
Place of birth for the foreign-born population - Ukraine (%)
Place of birth for the foreign-born population - Other Eastern Europe (%)
Place of birth for the foreign-born population - China (%)
Place of birth for the foreign-born population - Hong Kong (%)
Place of birth for the foreign-born population - Taiwan (%)
Place of birth for the foreign-born population - Japan (%)
Place of birth for the foreign-born population - Korea (%)
Place of birth for the foreign-born population - Other Eastern Asia (%)
Place of birth for the foreign-born population - Afghanistan (%)
Place of birth for the foreign-born population - Bangladesh (%)
Place of birth for the foreign-born population - India (%)
Place of birth for the foreign-born population - Iran (%)
Place of birth for the foreign-born population - Kazakhstan (%)
Place of birth for the foreign-born population - Nepal (%)
Place of birth for the foreign-born population - Pakistan (%)
Place of birth for the foreign-born population - Sri Lanka (%)
Place of birth for the foreign-born population - Uzbekistan (%)
Place of birth for the foreign-born population - Other South Central Asia (%)
Place of birth for the foreign-born population - Burma (%)
Place of birth for the foreign-born population - Cambodia (%)
Place of birth for the foreign-born population - Indonesia (%)
Place of birth for the foreign-born population - Laos (%)
Place of birth for the foreign-born population - Malaysia (%)
Place of birth for the foreign-born population - Philippines (%)
Place of birth for the foreign-born population - Singapore (%)
Place of birth for the foreign-born population - Thailand (%)
Place of birth for the foreign-born population - Vietnam (%)
Place of birth for the foreign-born population - Other South Eastern Asia (%)
Place of birth for the foreign-born population - Armenia (%)
Place of birth for the foreign-born population - Iraq (%)
Place of birth for the foreign-born population - Israel (%)
Place of birth for the foreign-born population - Jordan (%)
Place of birth for the foreign-born population - Kuwait (%)
Place of birth for the foreign-born population - Lebanon (%)
Place of birth for the foreign-born population - Saudi Arabia (%)
Place of birth for the foreign-born population - Syria (%)
Place of birth for the foreign-born population - Turkey (%)
Place of birth for the foreign-born population - Yemen (%)
Place of birth for the foreign-born population - Other Western Asia (%)
Place of birth for the foreign-born population - Eritrea (%)
Place of birth for the foreign-born population - Ethiopia (%)
Place of birth for the foreign-born population - Kenya (%)
Place of birth for the foreign-born population - Somalia (%)
Place of birth for the foreign-born population - Uganda (%)
Place of birth for the foreign-born population - Zimbabwe (%)
Place of birth for the foreign-born population - Other Eastern Africa (%)
Place of birth for the foreign-born population - Cameroon (%)
Place of birth for the foreign-born population - Congo (%)
Place of birth for the foreign-born population - Democratic Republic of Congo (Zaire) (%)
Place of birth for the foreign-born population - Other Middle Africa (%)
Place of birth for the foreign-born population - Egypt (%)
Place of birth for the foreign-born population - Morocco (%)
Place of birth for the foreign-born population - Sudan (%)
Place of birth for the foreign-born population - Other Northern Africa (%)
Place of birth for the foreign-born population - South Africa (%)
Place of birth for the foreign-born population - Other Southern Africa (%)
Place of birth for the foreign-born population - Cabo Verde (%)
Place of birth for the foreign-born population - Ghana (%)
Place of birth for the foreign-born population - Liberia (%)
Place of birth for the foreign-born population - Nigeria (%)
Place of birth for the foreign-born population - Senegal (%)
Place of birth for the foreign-born population - Sierra Leone (%)
Place of birth for the foreign-born population - Other Western Africa (%)
Place of birth for the foreign-born population - Australia (%)
Place of birth for the foreign-born population - New Zealand (%)
Place of birth for the foreign-born population - Fiji (%)
Place of birth for the foreign-born population - Micronesia (%)
Place of birth for the foreign-born population - Bahamas (%)
Place of birth for the foreign-born population - Barbados (%)
Place of birth for the foreign-born population - Cuba (%)
Place of birth for the foreign-born population - Dominica (%)
Place of birth for the foreign-born population - Dominican Republic (%)
Place of birth for the foreign-born population - Grenada (%)
Place of birth for the foreign-born population - Haiti (%)
Place of birth for the foreign-born population - Jamaica (%)
Place of birth for the foreign-born population - St. Vincent and the Grenadines (%)
Place of birth for the foreign-born population - Trinidad and Tobago (%)
Place of birth for the foreign-born population - West Indies (%)
Place of birth for the foreign-born population - Other Caribbean (%)
Place of birth for the foreign-born population - Belize (%)
Place of birth for the foreign-born population - Costa Rica (%)
Place of birth for the foreign-born population - El Salvador (%)
Place of birth for the foreign-born population - Guatemala (%)
Place of birth for the foreign-born population - Honduras (%)
Place of birth for the foreign-born population - Mexico (%)
Place of birth for the foreign-born population - Nicaragua (%)
Place of birth for the foreign-born population - Panama (%)
Place of birth for the foreign-born population - Other Central America (%)
Place of birth for the foreign-born population - Argentina (%)
Place of birth for the foreign-born population - Bolivia (%)
Place of birth for the foreign-born population - Brazil (%)
Place of birth for the foreign-born population - Chile (%)
Place of birth for the foreign-born population - Colombia (%)
Place of birth for the foreign-born population - Ecuador (%)
Place of birth for the foreign-born population - Guyana (%)
Place of birth for the foreign-born population - Peru (%)
Place of birth for the foreign-born population - Uruguay (%)
Place of birth for the foreign-born population - Venezuela (%)
Place of birth for the foreign-born population - Other South America (%)
Place of birth for the foreign-born population - Canada (%)
Place of birth for the foreign-born population - Other Northern America (%)
Place of birth for the foreign-born population - Other (%)
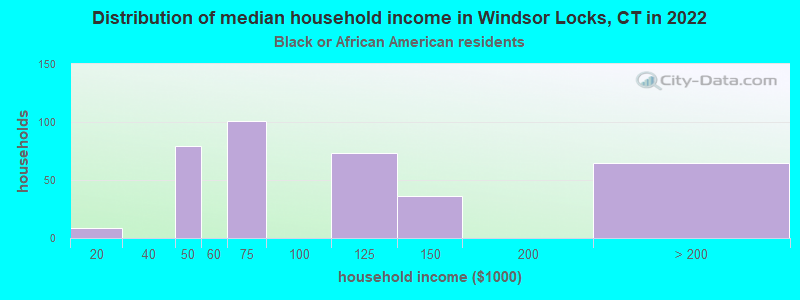
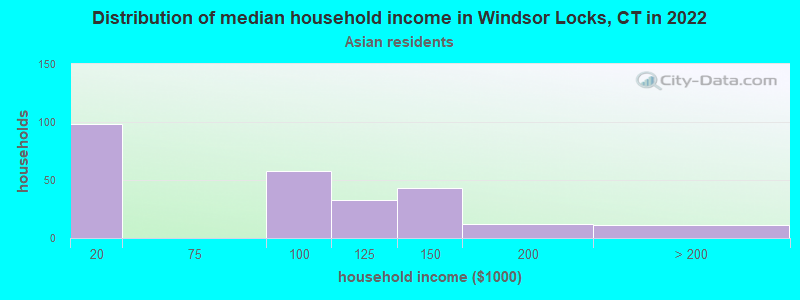
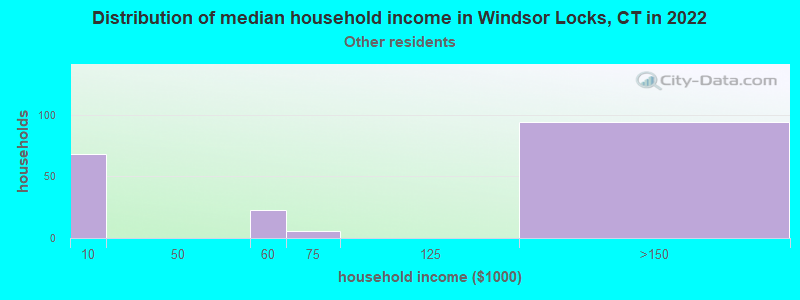
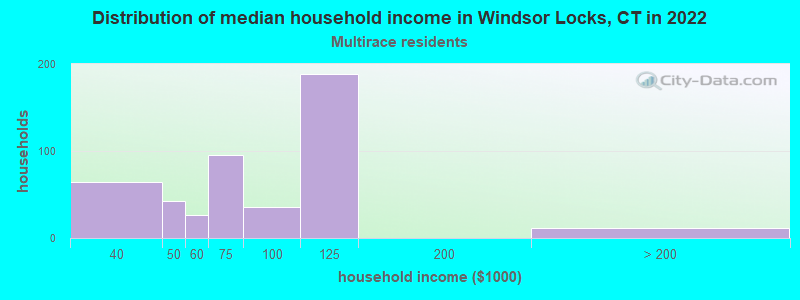
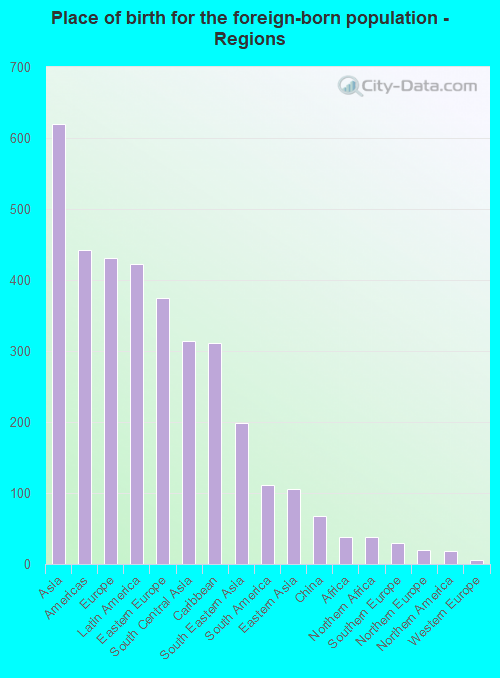
According to 2022 data, the most numerous races in Windsor Locks, CT are White alone (9,094 residents), Hispanic (905 residents), and Black alone (785 residents). 85.0% of Windsor Locks residents speak English at home. 12.2% of Windsor Locks, CT residents are foreign-born (4.7% born in Asia, 3.3% born in Europe, 3.2% born in Latin America), which is 23.4% less than the foreign-born rate of 15.0% across the entire state of Connecticut.
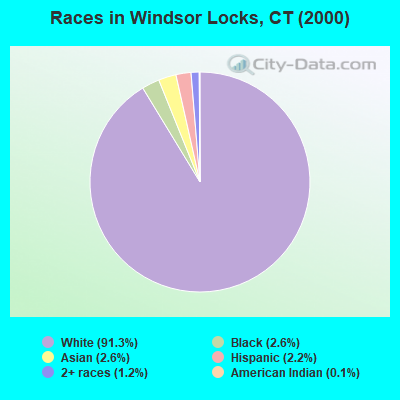
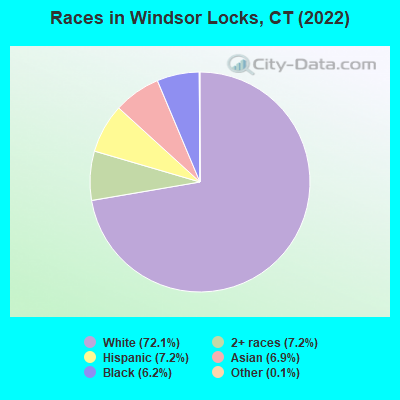
Race distribution in Windsor Locks
2000 2022
2,638,845 77.5% White alone 320,323 9.4% Hispanic 295,571 8.7% Black alone 81,564 2.4% Asian alone 52,896 1.6% Two or more races 8,141 0.2% Other race alone 7,267 0.2% American Indian alone 958 0.03% Native Hawaiian and Other
2,246,913 62.0% White alone 658,978 18.2% Hispanic 353,973 9.8% Black alone 172,929 4.8% Asian alone 159,631 4.4% Two or more races 29,761 0.8% Other race alone 3,428 0.09% American Indian alone 592 0.02% Native Hawaiian and Other
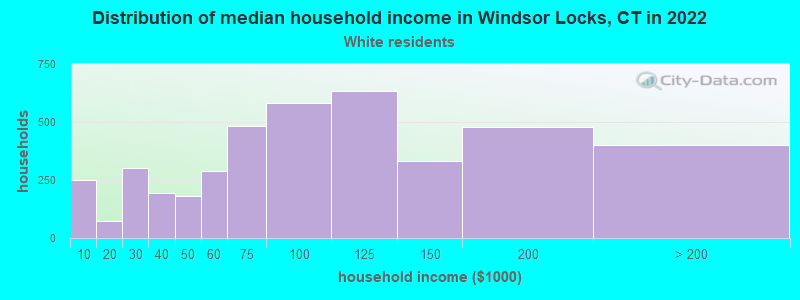
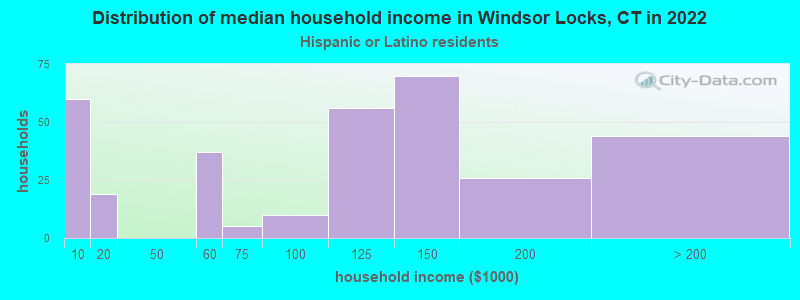
Income and house value in Windsor Locks Median household income in 2022 $86,726 White non-Hispanic householders$73,254 Black householders$77,997 Two or more races householders$112,776 Hispanic or Latino race householdersMedian 2022 house value $255,662 White Non-Hispanic householders$263,027 Black or African American householders $289,329 Asian householders$230,411 Two or more races householders$115,731 Hispanic or Latino householders
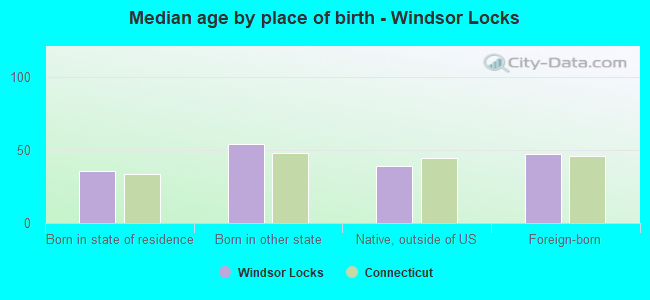
Median age by race in Windsor Locks
46.7 Median age for White residents43.8 48.7 35.1 Median age for Black or African American residents42.0 30.8 -742,173,111.6 Median age for American Indian / Alaska Native residents-701,030,927.1 -704,477,611.2 47.7 Median age for Asian residents46.9 48.3 -641,269,840.6 Median age for Native Hawaiian / Pacific Islander residents-414,239,481.8 -691,588,784.4 38.4 Median age for Other race residents37.9 38.3 32.0 Median age for Two or more races residents34.7 24.3 47.4 Median age for White alone residents44.2 48.3 23.8 Median age for Hispanic or Latino residents24.4 19.3
Owner/renter occupied households by race in Windsor Locks
House owners and renters - White residents 3,464 82.9% Owner occupied712 17.1% Renter occupiedHouse owners and renters - Black or African American residents 258 67.1% Owner occupied127 32.9% Renter occupiedHouse owners and renters - Asian residents 266 90.4% Owner occupied28 9.6% Renter occupiedHouse owners and renters - Other race residents 7 4.6% Owner occupied147 95.4% Renter occupiedHouse owners and renters - Two or more races residents 405 85.6% Owner occupied68 14.4% Renter occupiedHouse owners and renters - White alone residents 3,423 82.1% Owner occupied748 17.9% Renter occupiedHouse owners and renters - Hispanic or Latino residents 172 53.5% Owner occupied149 46.5% Renter occupied
Language usage in Windsor Locks
English speakers - Total 85.0% of residents of Windsor Locks speak English at home.
5.1% of residents speak Spanish at home 413 67.7% Speak English very well197 32.3% Speak English less than very well9.4% of residents speak other language at home 581 52.2% Speak English very well531 47.8% Speak English less than very well
English speakers - Born in the United States 94.3% of residents of Windsor Locks speak English at home.
0.5% of residents speak Spanish at home 14 100.0% Speak English very well4.2% of residents speak other language at home 110 93.2% Speak English very well8 6.8% Speak English less than very well
English speakers - Native, born elsewhere 6.3% of residents of Windsor Locks speak English at home.
89.9% of residents speak Spanish at home 174 67.4% Speak English very well84 32.6% Speak English less than very well
English speakers - Foreign-born 38.3% of residents of Windsor Locks speak English at home.
8.2% of residents speak Spanish at home 79 63.2% Speak English very well46 36.8% Speak English less than very well52.0% of residents speak other language at home 276 34.7% Speak English very well520 65.3% Speak English less than very well
White (Caucasian) - Speak only English Native:
98.7% (7,982)Foreign-born:
52.6% (221)
White (Caucasian) - Speak another language Native:
2.4% (196)Foreign-born:
51.3% (215)
Black or African American - Speak only English Native:
99.1% (476)Foreign-born:
91.4% (267)
Asian - Speak only English Native:
44.5% (116)Foreign-born:
7.2% (45)
Asian - Speak another language Native:
55.1% (144)Foreign-born:
93.3% (584)
Other race - Speak another language Native:
80.6% (355)Foreign-born:
100.0% (29)
Two or more races - Speak only English Native:
87.3% (876)Foreign-born:
65.2% (53)
White alone - Speak only English Native:
98.1% (8,006)Foreign-born:
51.0% (228)
White alone - Speak another language Native:
1.9% (155)Foreign-born:
49.6% (222)
Hispanic or Latino - Speak another language Native:
66.3% (474)Foreign-born:
100.0% (74)
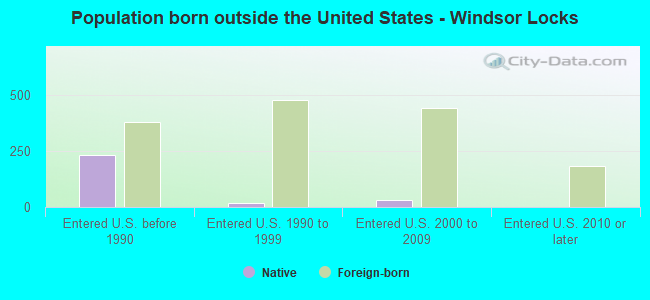
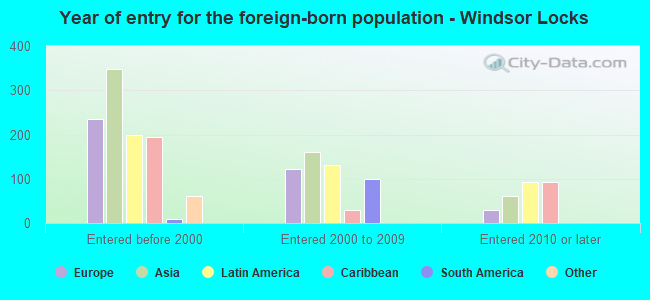
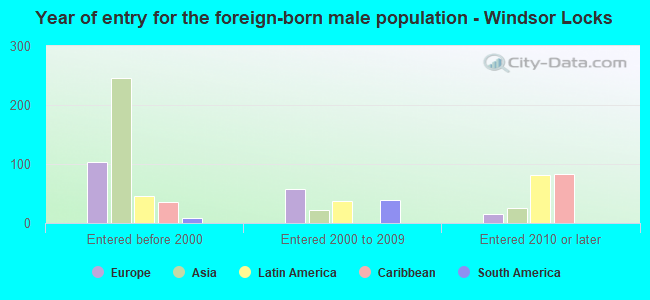
Foreign-born residents in Windsor Locks 1,533 residents are foreign born (4.7% Asia , 3.3% Europe , 3.2% Latin America ).
This city:
12.2%Connecticut:
15.0%
Marital status for residents in Windsor Locks Marital status - White (Caucasian) population 15 years and over
Males 32.7% Never married51.4% Now married0.0% Separated2.5% Widowed13.4% DivorcedFemales 25.4% Never married47.2% Now married2.0% Separated9.4% Widowed16.0% DivorcedWomen who gave birth in the past 12 months Now married:
25.3% (34)Unmarried:
74.7% (100)
Women who did not give birth in the past 12 months Now married:
48.8% (859)Unmarried:
51.2% (901)
Marital status - Black or African American population 15 years and over
Males 26.4% Never married43.8% Now married0.0% Separated0.0% Widowed29.8% DivorcedFemales 52.8% Never married29.4% Now married0.0% Separated5.5% Widowed12.4% DivorcedWomen who gave birth in the past 12 months Now married:
0.0% (0)Unmarried:
100.0% (21)
Women who did not give birth in the past 12 months Now married:
20.9% (62)Unmarried:
79.1% (234)
Marital status - Asian population 15 years and over
Males 39.9% Never married58.8% Now married0.0% Separated1.4% Widowed0.0% DivorcedFemales 10.6% Never married89.4% Now married0.0% Separated0.0% Widowed0.0% DivorcedWomen who gave birth in the past 12 months Now married:
100.0% (9)Unmarried:
0.0% (0)
Women who did not give birth in the past 12 months Now married:
87.3% (223)Unmarried:
12.7% (32)
Marital status - Other race population 15 years and over
Males 96.8% Never married3.2% Now married0.0% Separated0.0% Widowed0.0% DivorcedFemales 70.6% Never married2.8% Now married0.0% Separated0.0% Widowed26.6% DivorcedWomen who did not give birth in the past 12 months Now married:
0.0% (0)Unmarried:
100.0% (211)
Marital status - Two or more races population 15 years and over
Males 10.8% Never married61.9% Now married0.0% Separated0.0% Widowed27.3% DivorcedFemales 41.8% Never married32.4% Now married0.0% Separated0.0% Widowed25.8% DivorcedWomen who gave birth in the past 12 months Now married:
0.0% (0)Unmarried:
100.0% (34)
Women who did not give birth in the past 12 months Now married:
8.3% (17)Unmarried:
91.7% (185)
Marital status - White alone, not Hispanic / Latino population 15 years and over
Males 31.6% Never married52.4% Now married0.0% Separated2.6% Widowed13.4% DivorcedFemales 25.9% Never married46.6% Now married2.0% Separated9.6% Widowed15.8% DivorcedWomen who gave birth in the past 12 months Now married:
25.3% (36)Unmarried:
74.7% (105)
Women who did not give birth in the past 12 months Now married:
47.0% (842)Unmarried:
53.0% (950)
Marital status - Hispanic or Latino population 15 years and over
Males 73.6% Never married6.7% Now married0.0% Separated0.0% Widowed19.7% DivorcedFemales 47.0% Never married26.7% Now married0.0% Separated0.0% Widowed26.3% DivorcedWomen who did not give birth in the past 12 months Now married:
27.7% (69)Unmarried:
72.3% (181)
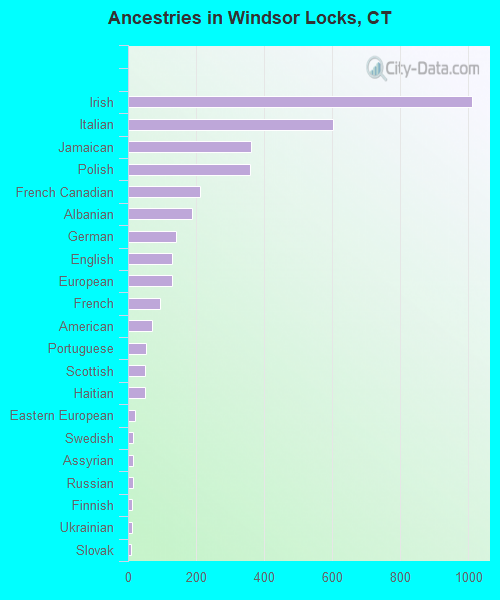
Ancestries in Windsor Locks
1,011 19.5% Irish603 11.6% Italian362 7.0% Jamaican360 6.9% Polish213 4.1% French Canadian187 3.6% Albanian141 2.7% German130 2.5% English129 2.5% European94 1.8% French70 1.4% American52 1.0% Portuguese50 1.0% Scottish50 1.0% Haitian20 0.4% Eastern European16 0.3% Swedish15 0.3% Assyrian14 0.3% Russian12 0.2% Finnish12 0.2% Ukrainian10 0.2% Slovak4 0.08% British4 0.08% Scotch-Irish3 0.06% Canadian
Children Nativity (place of birth) in Windsor Locks
Children under 6 years - Living with two parents Both parents native 338 100.0% NativeBoth parents foreign-born 80 100.0% NativeOne native, one foreign-born parent 12 100.0% NativeChildren under 6 years - Living with one parent Native parent 309 100.0% NativeForeign-born parent 71 100.0% Native
Children 6 to 17 years - Living with two parents Both parents native 668 100.0% NativeBoth parents foreign-born 251 100.0% NativeOne native, one foreign-born parent 56 100.0% NativeChildren 6 to 17 years - Living with one parent Native parent 498 100.0% Native
Grandparents responsible for own grandchildren in Windsor Locks
Grandparents (30 to 59 years) Black or African American 14 100.0% Not responsible for grandchildren
Grandparents (60 years and over)