Races in Woodland Park, New Jersey (NJ) Detailed Stats
Data:
Races - White alone (%)
Races - White alone (% change since 2000)
Races - Black alone (%)
Races - Black alone (% change since 2000)
Races - American Indian alone (%)
Races - American Indian alone (% change since 2000)
Races - Asian alone (%)
Races - Asian alone (% change since 2000)
Races - Hispanic (%)
Races - Hispanic (% change since 2000)
Races - Native Hawaiian and Other Pacific Islander alone (%)
Races - Native Hawaiian and Other Pacific Islander alone (% change since 2000)
Races - Two or more races(%)
Races - Two or more races(% change since 2000)
Races - Other race alone (%)
Races - Other race alone (% change since 2000)
Racial diversity
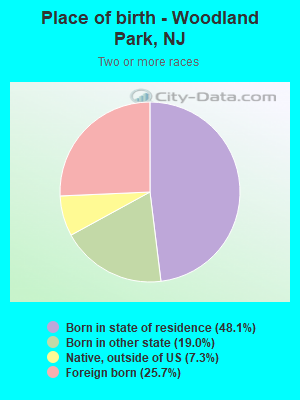
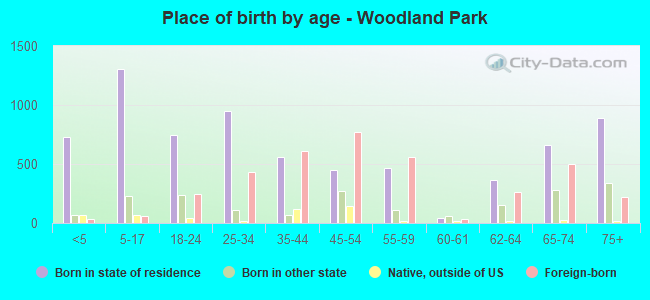
Place of birth - Born in state of residence (%)
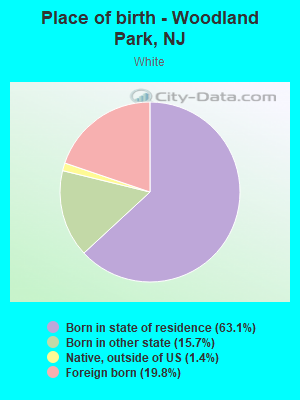
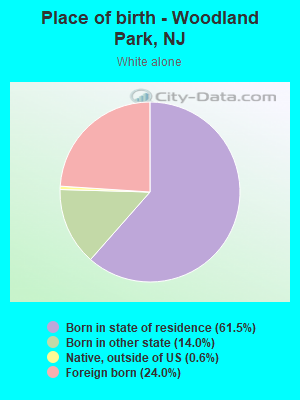
Place of birth - Born in state of residence (%) - White
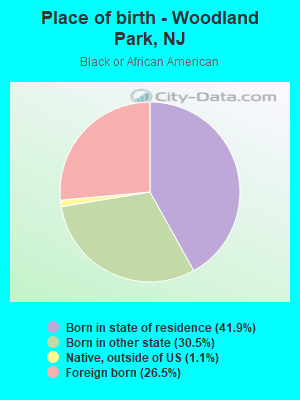
Place of birth - Born in state of residence (%) - Black or African American
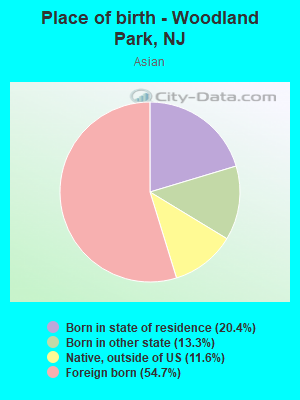
Place of birth - Born in state of residence (%) - Asian
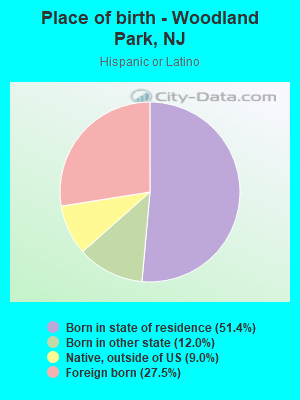
Place of birth - Born in state of residence (%) - Hispanic or Latino
Place of birth - Born in state of residence (%) - American Indian and Alaska Native
Place of birth - Born in state of residence (%) - Multirace
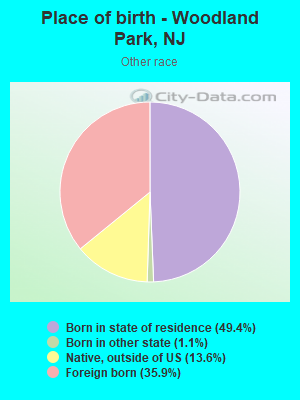
Place of birth - Born in state of residence (%) - Other Race
Place of birth - Born in other state (%)
Place of birth - Born in other state (%) - White
Place of birth - Born in other state (%) - Black or African American
Place of birth - Born in other state (%) - Asian
Place of birth - Born in other state (%) - Hispanic or Latino
Place of birth - Born in other state (%) - American Indian and Alaska Native
Place of birth - Born in other state (%) - Multirace
Place of birth - Born in other state (%) - Other Race
Place of birth - Native, outside of US (%)
Place of birth - Native, outside of US (%) - White
Place of birth - Native, outside of US (%) - Black or African American
Place of birth - Native, outside of US (%) - Asian
Place of birth - Native, outside of US (%) - Hispanic or Latino
Place of birth - Native, outside of US (%) - American Indian and Alaska Native
Place of birth - Native, outside of US (%) - Multirace
Place of birth - Native, outside of US (%) - Other Race
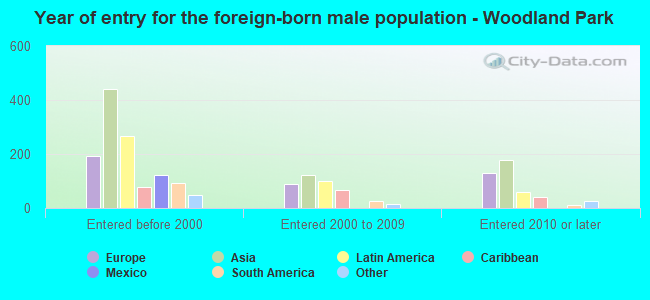
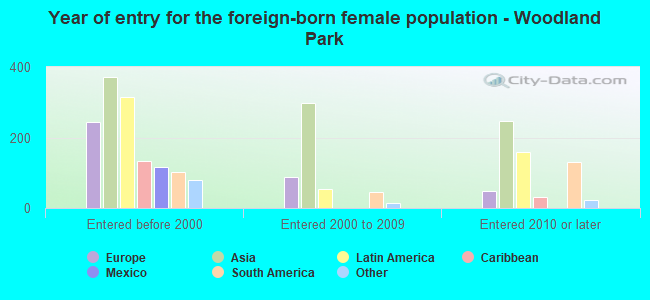
Place of birth - Foreign born (%)
Place of birth - Foreign born (%) - White
Place of birth - Foreign born (%) - Black or African American
Place of birth - Foreign born (%) - Asian
Place of birth - Foreign born (%) - Hispanic or Latino
Place of birth - Foreign born (%) - American Indian and Alaska Native
Place of birth - Foreign born (%) - Multirace
Place of birth - Foreign born (%) - Other Race
Residents speaking English at home (%)
Residents speaking English at home - Born in the United States (%)
Residents speaking English at home - Native, born elsewhere (%)
Residents speaking English at home - Foreign born (%)
Residents speaking Spanish at home (%)
Residents speaking Spanish at home - Born in the United States (%)
Residents speaking Spanish at home - Native, born elsewhere (%)
Residents speaking Spanish at home - Foreign born (%)
Residents speaking other language at home (%)
Residents speaking other language at home - Born in the United States (%)
Residents speaking other language at home - Native, born elsewhere (%)
Residents speaking other language at home - Foreign born (%)
Marital status - Never married (%)
Marital status - Now married (%)
Marital status - Separated (%)
Marital status - Widowed (%)
Marital status - Divorced (%)
Ancestries Reported - Arab (%)
Ancestries Reported - Czech (%)
Ancestries Reported - Danish (%)
Ancestries Reported - Dutch (%)
Ancestries Reported - English (%)
Ancestries Reported - French (%)
Ancestries Reported - French Canadian (%)
Ancestries Reported - German (%)
Ancestries Reported - Greek (%)
Ancestries Reported - Hungarian (%)
Ancestries Reported - Irish (%)
Ancestries Reported - Italian (%)
Ancestries Reported - Lithuanian (%)
Ancestries Reported - Norwegian (%)
Ancestries Reported - Polish (%)
Ancestries Reported - Portuguese (%)
Ancestries Reported - Russian (%)
Ancestries Reported - Scotch-Irish (%)
Ancestries Reported - Scottish (%)
Ancestries Reported - Slovak (%)
Ancestries Reported - Subsaharan African (%)
Ancestries Reported - Swedish (%)
Ancestries Reported - Swiss (%)
Ancestries Reported - Ukrainian (%)
Ancestries Reported - United States (%)
Ancestries Reported - Welsh (%)
Ancestries Reported - West Indian (%)
Ancestries Reported - Other (%)
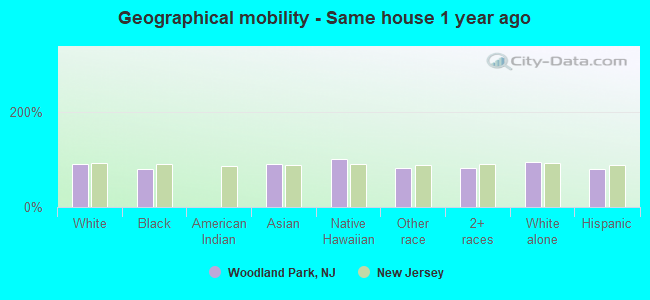
Geographical mobility - Same house 1 year ago (%)
Geographical mobility - Same house 1 year ago (%) - White
Geographical mobility - Same house 1 year ago (%) - Black or African American
Geographical mobility - Same house 1 year ago (%) - Asian
Geographical mobility - Same house 1 year ago (%) - Hispanic or Latino
Geographical mobility - Same house 1 year ago (%) - American Indian and Alaska Native
Geographical mobility - Same house 1 year ago (%) - Multirace
Geographical mobility - Same house 1 year ago (%) - Other Race
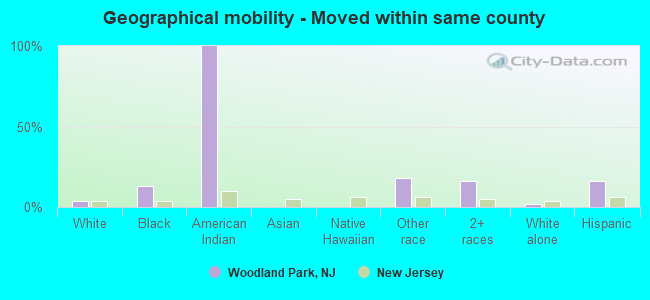
Geographical mobility - Moved within same county (%)
Geographical mobility - Moved within same county (%) - White
Geographical mobility - Moved within same county (%) - Black or African American
Geographical mobility - Moved within same county (%) - Asian
Geographical mobility - Moved within same county (%) - Hispanic or Latino
Geographical mobility - Moved within same county (%) - American Indian and Alaska Native
Geographical mobility - Moved within same county (%) - Multirace
Geographical mobility - Moved within same county (%) - Other Race
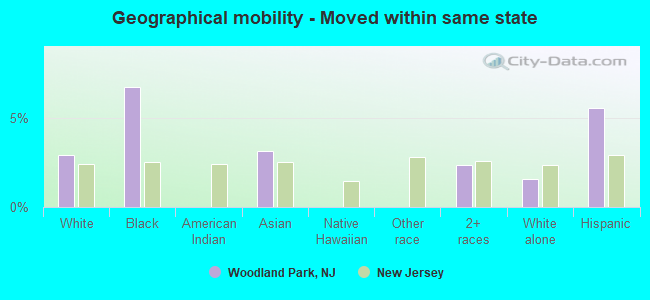
Geographical mobility - Moved from different county within same state (%)
Geographical mobility - Moved from different county within same state (%) - White
Geographical mobility - Moved from different county within same state (%) - Black or African American
Geographical mobility - Moved from different county within same state (%) - Asian
Geographical mobility - Moved from different county within same state (%) - Hispanic or Latino
Geographical mobility - Moved from different county within same state (%) - American Indian and Alaska Native
Geographical mobility - Moved from different county within same state (%) - Multirace
Geographical mobility - Moved from different county within same state (%) - Other Race
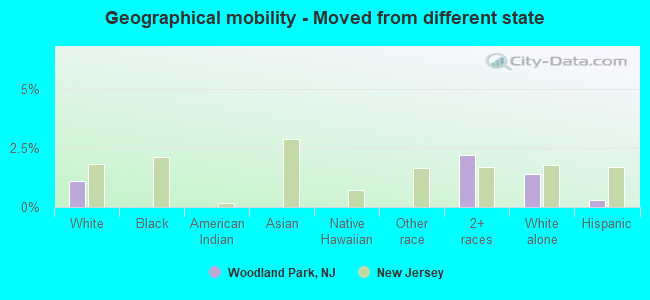
Geographical mobility - Moved from different state (%)
Geographical mobility - Moved from different state (%) - White
Geographical mobility - Moved from different state (%) - Black or African American
Geographical mobility - Moved from different state (%) - Asian
Geographical mobility - Moved from different state (%) - Hispanic or Latino
Geographical mobility - Moved from different state (%) - American Indian and Alaska Native
Geographical mobility - Moved from different state (%) - Multirace
Geographical mobility - Moved from different state (%) - Other Race
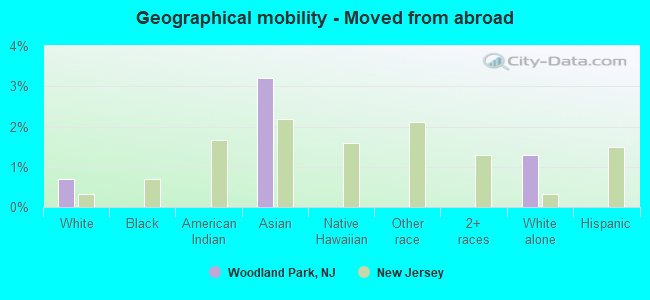
Geographical mobility - Moved from abroad (%)
Geographical mobility - Moved from abroad (%) - White
Geographical mobility - Moved from abroad (%) - Black or African American
Geographical mobility - Moved from abroad (%) - Asian
Geographical mobility - Moved from abroad (%) - Hispanic or Latino
Geographical mobility - Moved from abroad (%) - American Indian and Alaska Native
Geographical mobility - Moved from abroad (%) - Multirace
Geographical mobility - Moved from abroad (%) - Other Race
Place of birth for the foreign-born population - Ireland (%)
Place of birth for the foreign-born population - Denmark (%)
Place of birth for the foreign-born population - Norway (%)
Place of birth for the foreign-born population - Sweden (%)
Place of birth for the foreign-born population - United Kingdom (%)
Place of birth for the foreign-born population - England (%)
Place of birth for the foreign-born population - Scotland (%)
Place of birth for the foreign-born population - Other Northern Europe (%)
Place of birth for the foreign-born population - Austria (%)
Place of birth for the foreign-born population - Belgium (%)
Place of birth for the foreign-born population - France (%)
Place of birth for the foreign-born population - Germany (%)
Place of birth for the foreign-born population - Netherlands (%)
Place of birth for the foreign-born population - Switzerland (%)
Place of birth for the foreign-born population - Other Western Europe (%)
Place of birth for the foreign-born population - Greece (%)
Place of birth for the foreign-born population - Italy (%)
Place of birth for the foreign-born population - Portugal (%)
Place of birth for the foreign-born population - Spain (%)
Place of birth for the foreign-born population - Other Southern Europe (%)
Place of birth for the foreign-born population - Albania (%)
Place of birth for the foreign-born population - Belarus (%)
Place of birth for the foreign-born population - Bosnia and Herzegovina (%)
Place of birth for the foreign-born population - Bulgaria (%)
Place of birth for the foreign-born population - Croatia (%)
Place of birth for the foreign-born population - Czechoslovakia (%)
Place of birth for the foreign-born population - Hungary (%)
Place of birth for the foreign-born population - Latvia (%)
Place of birth for the foreign-born population - Lithuania (%)
Place of birth for the foreign-born population - North Macedonia (Macedonia) (%)
Place of birth for the foreign-born population - Moldova (%)
Place of birth for the foreign-born population - Poland (%)
Place of birth for the foreign-born population - Romania (%)
Place of birth for the foreign-born population - Russia (%)
Place of birth for the foreign-born population - Serbia (%)
Place of birth for the foreign-born population - Ukraine (%)
Place of birth for the foreign-born population - Other Eastern Europe (%)
Place of birth for the foreign-born population - China (%)
Place of birth for the foreign-born population - Hong Kong (%)
Place of birth for the foreign-born population - Taiwan (%)
Place of birth for the foreign-born population - Japan (%)
Place of birth for the foreign-born population - Korea (%)
Place of birth for the foreign-born population - Other Eastern Asia (%)
Place of birth for the foreign-born population - Afghanistan (%)
Place of birth for the foreign-born population - Bangladesh (%)
Place of birth for the foreign-born population - India (%)
Place of birth for the foreign-born population - Iran (%)
Place of birth for the foreign-born population - Kazakhstan (%)
Place of birth for the foreign-born population - Nepal (%)
Place of birth for the foreign-born population - Pakistan (%)
Place of birth for the foreign-born population - Sri Lanka (%)
Place of birth for the foreign-born population - Uzbekistan (%)
Place of birth for the foreign-born population - Other South Central Asia (%)
Place of birth for the foreign-born population - Burma (%)
Place of birth for the foreign-born population - Cambodia (%)
Place of birth for the foreign-born population - Indonesia (%)
Place of birth for the foreign-born population - Laos (%)
Place of birth for the foreign-born population - Malaysia (%)
Place of birth for the foreign-born population - Philippines (%)
Place of birth for the foreign-born population - Singapore (%)
Place of birth for the foreign-born population - Thailand (%)
Place of birth for the foreign-born population - Vietnam (%)
Place of birth for the foreign-born population - Other South Eastern Asia (%)
Place of birth for the foreign-born population - Armenia (%)
Place of birth for the foreign-born population - Iraq (%)
Place of birth for the foreign-born population - Israel (%)
Place of birth for the foreign-born population - Jordan (%)
Place of birth for the foreign-born population - Kuwait (%)
Place of birth for the foreign-born population - Lebanon (%)
Place of birth for the foreign-born population - Saudi Arabia (%)
Place of birth for the foreign-born population - Syria (%)
Place of birth for the foreign-born population - Turkey (%)
Place of birth for the foreign-born population - Yemen (%)
Place of birth for the foreign-born population - Other Western Asia (%)
Place of birth for the foreign-born population - Eritrea (%)
Place of birth for the foreign-born population - Ethiopia (%)
Place of birth for the foreign-born population - Kenya (%)
Place of birth for the foreign-born population - Somalia (%)
Place of birth for the foreign-born population - Uganda (%)
Place of birth for the foreign-born population - Zimbabwe (%)
Place of birth for the foreign-born population - Other Eastern Africa (%)
Place of birth for the foreign-born population - Cameroon (%)
Place of birth for the foreign-born population - Congo (%)
Place of birth for the foreign-born population - Democratic Republic of Congo (Zaire) (%)
Place of birth for the foreign-born population - Other Middle Africa (%)
Place of birth for the foreign-born population - Egypt (%)
Place of birth for the foreign-born population - Morocco (%)
Place of birth for the foreign-born population - Sudan (%)
Place of birth for the foreign-born population - Other Northern Africa (%)
Place of birth for the foreign-born population - South Africa (%)
Place of birth for the foreign-born population - Other Southern Africa (%)
Place of birth for the foreign-born population - Cabo Verde (%)
Place of birth for the foreign-born population - Ghana (%)
Place of birth for the foreign-born population - Liberia (%)
Place of birth for the foreign-born population - Nigeria (%)
Place of birth for the foreign-born population - Senegal (%)
Place of birth for the foreign-born population - Sierra Leone (%)
Place of birth for the foreign-born population - Other Western Africa (%)
Place of birth for the foreign-born population - Australia (%)
Place of birth for the foreign-born population - New Zealand (%)
Place of birth for the foreign-born population - Fiji (%)
Place of birth for the foreign-born population - Micronesia (%)
Place of birth for the foreign-born population - Bahamas (%)
Place of birth for the foreign-born population - Barbados (%)
Place of birth for the foreign-born population - Cuba (%)
Place of birth for the foreign-born population - Dominica (%)
Place of birth for the foreign-born population - Dominican Republic (%)
Place of birth for the foreign-born population - Grenada (%)
Place of birth for the foreign-born population - Haiti (%)
Place of birth for the foreign-born population - Jamaica (%)
Place of birth for the foreign-born population - St. Vincent and the Grenadines (%)
Place of birth for the foreign-born population - Trinidad and Tobago (%)
Place of birth for the foreign-born population - West Indies (%)
Place of birth for the foreign-born population - Other Caribbean (%)
Place of birth for the foreign-born population - Belize (%)
Place of birth for the foreign-born population - Costa Rica (%)
Place of birth for the foreign-born population - El Salvador (%)
Place of birth for the foreign-born population - Guatemala (%)
Place of birth for the foreign-born population - Honduras (%)
Place of birth for the foreign-born population - Mexico (%)
Place of birth for the foreign-born population - Nicaragua (%)
Place of birth for the foreign-born population - Panama (%)
Place of birth for the foreign-born population - Other Central America (%)
Place of birth for the foreign-born population - Argentina (%)
Place of birth for the foreign-born population - Bolivia (%)
Place of birth for the foreign-born population - Brazil (%)
Place of birth for the foreign-born population - Chile (%)
Place of birth for the foreign-born population - Colombia (%)
Place of birth for the foreign-born population - Ecuador (%)
Place of birth for the foreign-born population - Guyana (%)
Place of birth for the foreign-born population - Peru (%)
Place of birth for the foreign-born population - Uruguay (%)
Place of birth for the foreign-born population - Venezuela (%)
Place of birth for the foreign-born population - Other South America (%)
Place of birth for the foreign-born population - Canada (%)
Place of birth for the foreign-born population - Other Northern America (%)
Place of birth for the foreign-born population - Other (%)
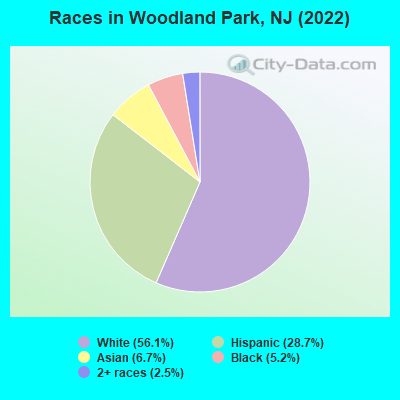
According to 2022 data, the most numerous races in Woodland Park, NJ are White alone (7,427 residents), Hispanic (3,795 residents), and Black alone (689 residents). 50.7% of Woodland Park residents speak English at home.
Race distribution in Woodland Park 7,427 56.1% White alone 3,795 28.7% Hispanic 881 6.7% Asian alone 689 5.2% Black alone 332 2.5% Two or more races 8 0.06% Native Hawaiian and Other
2000 2022
5,557,209 66.0% White alone 1,117,191 13.3% Hispanic 1,096,171 13.0% Black alone 477,012 5.7% Asian alone 133,689 1.6% Two or more races 19,565 0.2% Other race alone 11,338 0.1% American Indian alone 2,175 0.03% Native Hawaiian and Other
4,766,476 51.5% White alone 2,028,470 21.9% Hispanic 1,111,632 12.0% Black alone 923,546 10.0% Asian alone 332,237 3.6% Two or more races 89,847 1.0% Other race alone 8,557 0.09% American Indian alone 934 0.01% Native Hawaiian and Other
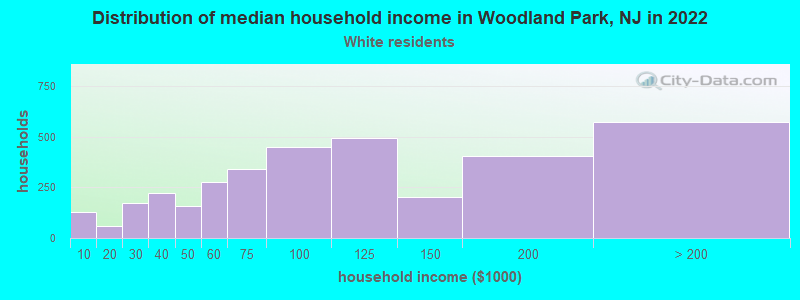
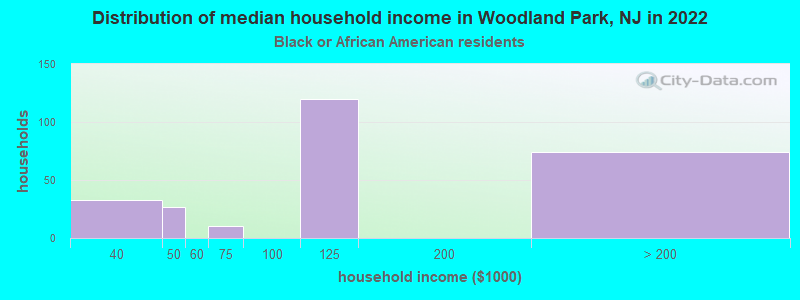
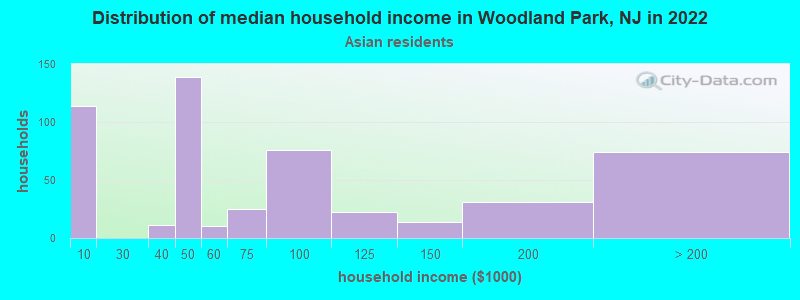
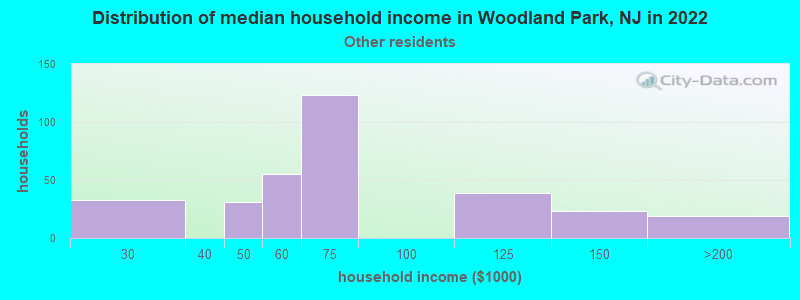
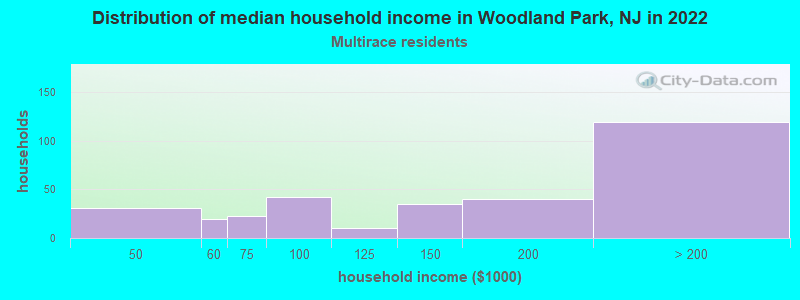
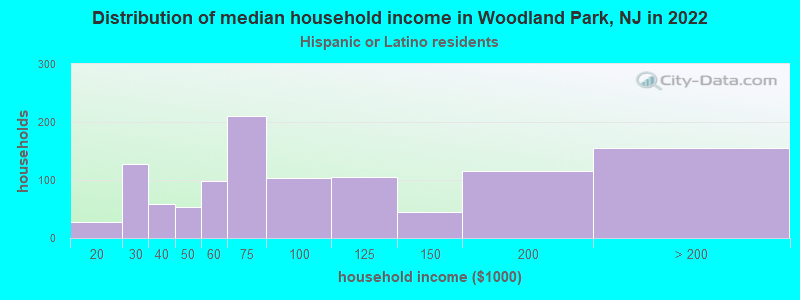
Income and house value in Woodland Park Median household income in 2022 $96,276 White non-Hispanic householders$126,227 Black householders$65,048 Some other race householders$138,490 Two or more races householders$76,980 Hispanic or Latino race householders
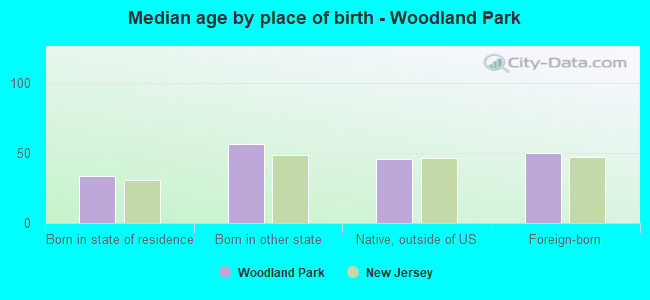
Median age by race in Woodland Park
49.8 Median age for White residents47.8 51.2 23.0 Median age for Black or African American residents22.6 31.3 -656,626,505.4 Median age for American Indian / Alaska Native residents-749,529,189.5 -612,668,742.9 45.4 Median age for Asian residents40.7 46.9 -1,010,045,661.1 Median age for Native Hawaiian / Pacific Islander residents-860,335,194.7 -713,070,378.3 37.8 Median age for Other race residents33.3 44.3 28.6 Median age for Two or more races residents25.7 33.5 54.9 Median age for White alone residents51.1 57.4 30.4 Median age for Hispanic or Latino residents28.1 31.8
Owner/renter occupied households by race in Woodland Park
House owners and renters - White residents 2,458 67.9% Owner occupied1,161 32.1% Renter occupiedHouse owners and renters - Black or African American residents 32 14.3% Owner occupied191 85.7% Renter occupiedHouse owners and renters - American Indian / Alaska Native residents 23 100.0% Renter occupiedHouse owners and renters - Asian residents 484 87.5% Owner occupied69 12.5% Renter occupiedHouse owners and renters - Other race residents 54 16.7% Owner occupied271 83.3% Renter occupiedHouse owners and renters - Two or more races residents 185 64.3% Owner occupied102 35.7% Renter occupiedHouse owners and renters - White alone residents 2,388 70.2% Owner occupied1,013 29.8% Renter occupiedHouse owners and renters - Hispanic or Latino residents 399 37.1% Owner occupied676 62.9% Renter occupied
Language usage in Woodland Park
English speakers - Total 50.7% of residents of Woodland Park speak English at home.
18.3% of residents speak Spanish at home 1,729 76.7% Speak English very well524 23.3% Speak English less than very well30.7% of residents speak other language at home 2,436 64.4% Speak English very well1,347 35.6% Speak English less than very well
English speakers - Born in the United States 68.1% of residents of Woodland Park speak English at home.
14.7% of residents speak Spanish at home 264 100.0% Speak English very well19.1% of residents speak other language at home 344 100.0% Speak English very well
English speakers - Native, born elsewhere 22.4% of residents of Woodland Park speak English at home.
53.0% of residents speak Spanish at home 95 42.8% Speak English very well127 57.2% Speak English less than very well22.9% of residents speak other language at home 30 31.2% Speak English very well66 68.8% Speak English less than very well
English speakers - Foreign-born 9.7% of residents of Woodland Park speak English at home.
23.7% of residents speak Spanish at home 550 61.9% Speak English very well338 38.1% Speak English less than very well65.2% of residents speak other language at home 1,200 49.2% Speak English very well1,241 50.8% Speak English less than very well
White (Caucasian) - Speak only English Native:
76.8% (4,770)Foreign-born:
12.6% (203)
White (Caucasian) - Speak another language Native:
20.0% (1,244)Foreign-born:
87.3% (1,404)
Black or African American - Speak another language Native:
34.6% (152)Foreign-born:
100.0% (201)
Asian - Speak only English Native:
48.8% (174)Foreign-born:
10.5% (54)
Asian - Speak another language Native:
44.9% (160)Foreign-born:
89.1% (454)
Other race - Speak another language Native:
76.8% (538)Foreign-born:
98.5% (435)
Two or more races - Speak only English Native:
72.9% (532)Foreign-born:
23.8% (65)
Two or more races - Speak another language Native:
21.4% (156)Foreign-born:
77.6% (213)
White alone - Speak only English Native:
81.7% (4,377)Foreign-born:
12.4% (216)
White alone - Speak another language Native:
18.0% (961)Foreign-born:
88.2% (1,537)
Hispanic or Latino - Speak only English Native:
40.9% (946)Foreign-born:
4.0% (41)
Hispanic or Latino - Speak another language Native:
59.3% (1,371)Foreign-born:
96.1% (975)
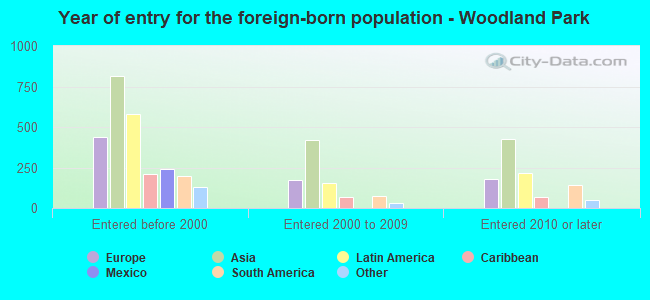
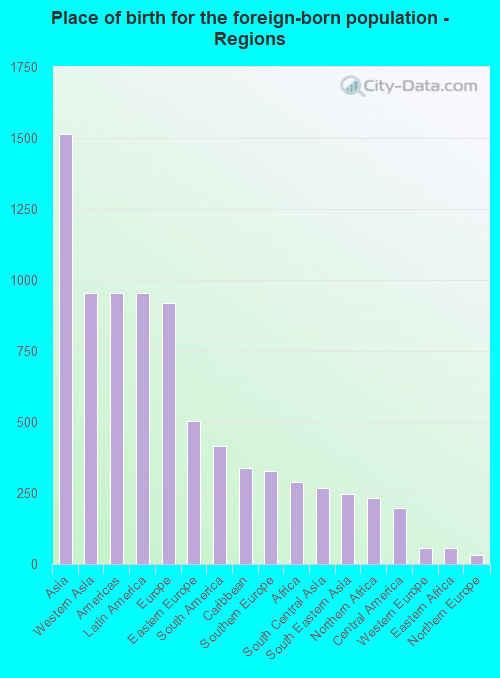
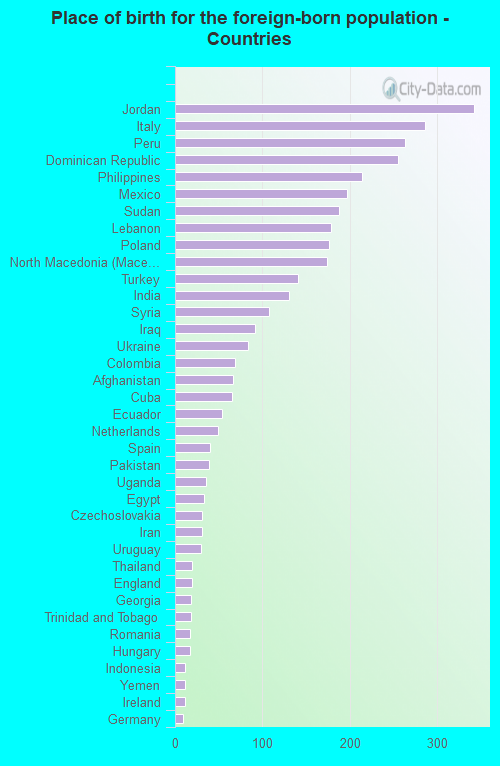
Foreign-born residents in Woodland Park
Marital status for residents in Woodland Park Marital status - White (Caucasian) population 15 years and over
Males 36.4% Never married51.5% Now married0.9% Separated4.0% Widowed7.1% DivorcedFemales 27.9% Never married44.5% Now married2.4% Separated10.2% Widowed15.0% DivorcedWomen who gave birth in the past 12 months Now married:
34.3% (33)Unmarried:
65.7% (63)
Women who did not give birth in the past 12 months Now married:
35.3% (584)Unmarried:
64.7% (1,071)
Marital status - Black or African American population 15 years and over
Males 39.2% Never married54.6% Now married0.0% Separated0.0% Widowed6.2% DivorcedFemales 14.1% Never married78.8% Now married0.0% Separated0.0% Widowed7.1% DivorcedWomen who did not give birth in the past 12 months Now married:
82.6% (107)Unmarried:
17.4% (23)
Marital status - Asian population 15 years and over
Males 56.9% Never married40.6% Now married0.0% Separated0.0% Widowed2.5% DivorcedFemales 40.0% Never married23.0% Now married0.0% Separated28.4% Widowed8.5% DivorcedWomen who gave birth in the past 12 months Now married:
0.0% (0)Unmarried:
100.0% (9)
Women who did not give birth in the past 12 months Now married:
21.7% (35)Unmarried:
78.3% (127)
Marital status - Other race population 15 years and over
Males 29.8% Never married61.6% Now married3.0% Separated0.0% Widowed5.6% DivorcedFemales 27.7% Never married52.7% Now married0.0% Separated3.7% Widowed15.9% DivorcedWomen who gave birth in the past 12 months Now married:
100.0% (36)Unmarried:
0.0% (0)
Women who did not give birth in the past 12 months Now married:
34.3% (62)Unmarried:
65.7% (120)
Marital status - Two or more races population 15 years and over
Males 65.9% Never married30.9% Now married3.2% Separated0.0% Widowed0.0% DivorcedFemales 41.6% Never married51.4% Now married2.4% Separated0.0% Widowed4.6% DivorcedWomen who did not give birth in the past 12 months Now married:
42.2% (146)Unmarried:
57.8% (200)
Marital status - White alone, not Hispanic / Latino population 15 years and over
Males 36.3% Never married51.6% Now married1.0% Separated4.6% Widowed6.5% DivorcedFemales 22.1% Never married49.2% Now married1.8% Separated12.0% Widowed15.0% DivorcedWomen who gave birth in the past 12 months Now married:
30.8% (16)Unmarried:
69.2% (35)
Women who did not give birth in the past 12 months Now married:
36.8% (437)Unmarried:
63.2% (749)
Marital status - Hispanic or Latino population 15 years and over
Males 39.6% Never married52.2% Now married2.0% Separated0.0% Widowed6.2% DivorcedFemales 45.3% Never married33.5% Now married4.4% Separated2.9% Widowed13.9% DivorcedWomen who gave birth in the past 12 months Now married:
61.5% (56)Unmarried:
38.5% (35)
Women who did not give birth in the past 12 months Now married:
32.6% (336)Unmarried:
67.4% (697)
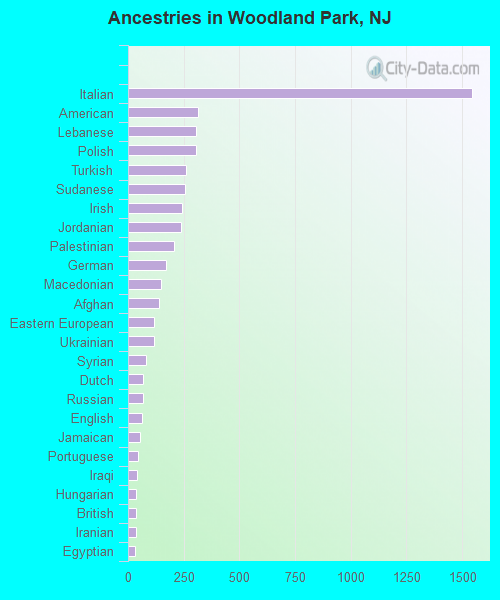
Ancestries in Woodland Park
1,544 18.9% Italian314 3.8% American307 3.8% Lebanese306 3.7% Polish260 3.2% Turkish258 3.2% Sudanese241 2.9% Irish237 2.9% Jordanian206 2.5% Palestinian169 2.1% German148 1.8% Macedonian139 1.7% Afghan117 1.4% Eastern European117 1.4% Ukrainian83 1.0% Syrian69 0.8% Dutch66 0.8% Russian62 0.8% English55 0.7% Jamaican44 0.5% Portuguese40 0.5% Iraqi38 0.5% Hungarian37 0.5% British35 0.4% Iranian33 0.4% Egyptian23 0.3% Trinidadian and Tobagonian22 0.3% Slavic18 0.2% Romanian17 0.2% Armenian16 0.2% Czech16 0.2% Czechoslovakian15 0.2% Scotch-Irish15 0.2% Slovak12 0.1% Swiss1 0.01% Lithuanian
Children Nativity (place of birth) in Woodland Park
Children under 6 years - Living with two parents Both parents native 121 100.0% NativeBoth parents foreign-born 212 100.0% NativeOne native, one foreign-born parent 178 100.0% NativeChildren under 6 years - Living with one parent Native parent 302 100.0% NativeForeign-born parent 178 100.0% NativeChildren 6 to 17 years - Living with two parents Both parents native 578 100.0% NativeBoth parents foreign-born 353 88.1% Native48 11.9% Foreign-bornOne native, one foreign-born parent 99 100.0% NativeChildren 6 to 17 years - Living with one parent Native parent 236 100.0% NativeForeign-born parent 217 52.1% Native200 47.9% Foreign-born
Grandparents responsible for own grandchildren in Woodland Park
Grandparents (30 to 59 years) White / Caucasian 35 100.0% Not responsible for grandchildrenOther race 23 100.0% Responsible for grandchildrenWhite alone, not Hispanic / Latino 46 100.0% Not responsible for grandchildrenHispanic or Latino 8 100.0% Responsible for grandchildren
Grandparents (60 years and over) White / Caucasian 116 100.0% Not responsible for grandchildrenWhite alone, not Hispanic / Latino 80 100.0% Not responsible for grandchildrenHispanic or Latino 51 100.0% Not responsible for grandchildren