Races in Woodmoor, Colorado (CO) Detailed Stats
Data:
Races - White alone (%)
Races - White alone (% change since 2000)
Races - Black alone (%)
Races - Black alone (% change since 2000)
Races - American Indian alone (%)
Races - American Indian alone (% change since 2000)
Races - Asian alone (%)
Races - Asian alone (% change since 2000)
Races - Hispanic (%)
Races - Hispanic (% change since 2000)
Races - Native Hawaiian and Other Pacific Islander alone (%)
Races - Native Hawaiian and Other Pacific Islander alone (% change since 2000)
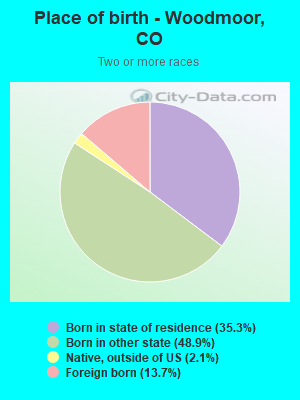
Races - Two or more races(%)
Races - Two or more races(% change since 2000)
Races - Other race alone (%)
Races - Other race alone (% change since 2000)
Racial diversity
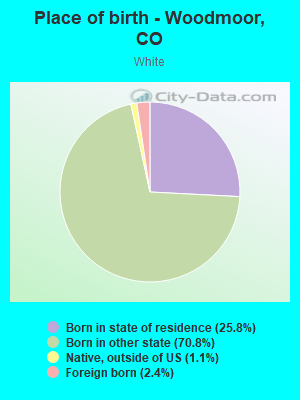
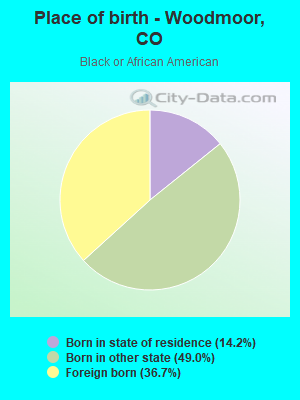
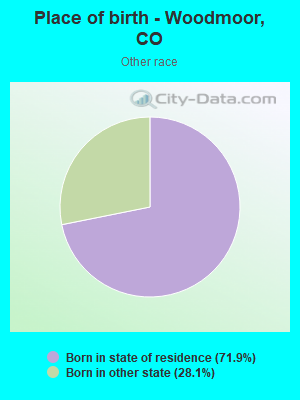
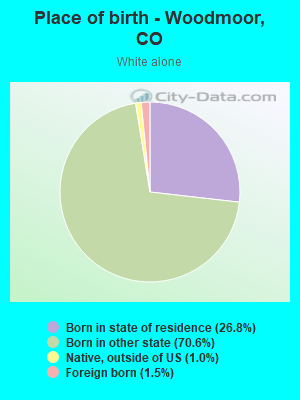
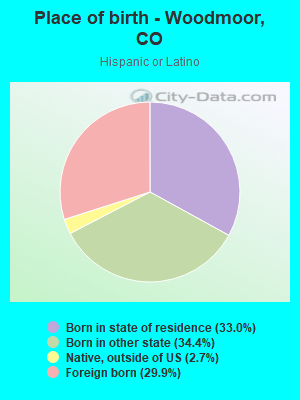
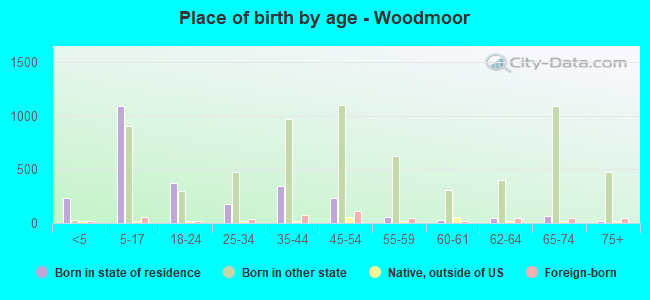
Place of birth - Born in state of residence (%)
Place of birth - Born in state of residence (%) - White
Place of birth - Born in state of residence (%) - Black or African American
Place of birth - Born in state of residence (%) - Asian
Place of birth - Born in state of residence (%) - Hispanic or Latino
Place of birth - Born in state of residence (%) - American Indian and Alaska Native
Place of birth - Born in state of residence (%) - Multirace
Place of birth - Born in state of residence (%) - Other Race
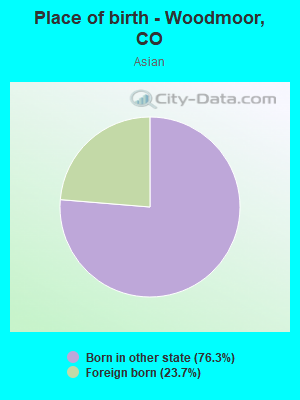
Place of birth - Born in other state (%)
Place of birth - Born in other state (%) - White
Place of birth - Born in other state (%) - Black or African American
Place of birth - Born in other state (%) - Asian
Place of birth - Born in other state (%) - Hispanic or Latino
Place of birth - Born in other state (%) - American Indian and Alaska Native
Place of birth - Born in other state (%) - Multirace
Place of birth - Born in other state (%) - Other Race
Place of birth - Native, outside of US (%)
Place of birth - Native, outside of US (%) - White
Place of birth - Native, outside of US (%) - Black or African American
Place of birth - Native, outside of US (%) - Asian
Place of birth - Native, outside of US (%) - Hispanic or Latino
Place of birth - Native, outside of US (%) - American Indian and Alaska Native
Place of birth - Native, outside of US (%) - Multirace
Place of birth - Native, outside of US (%) - Other Race
Place of birth - Foreign born (%)
Place of birth - Foreign born (%) - White
Place of birth - Foreign born (%) - Black or African American
Place of birth - Foreign born (%) - Asian
Place of birth - Foreign born (%) - Hispanic or Latino
Place of birth - Foreign born (%) - American Indian and Alaska Native
Place of birth - Foreign born (%) - Multirace
Place of birth - Foreign born (%) - Other Race
Residents speaking English at home (%)
Residents speaking English at home - Born in the United States (%)
Residents speaking English at home - Native, born elsewhere (%)
Residents speaking English at home - Foreign born (%)
Residents speaking Spanish at home (%)
Residents speaking Spanish at home - Born in the United States (%)
Residents speaking Spanish at home - Native, born elsewhere (%)
Residents speaking Spanish at home - Foreign born (%)
Residents speaking other language at home (%)
Residents speaking other language at home - Born in the United States (%)
Residents speaking other language at home - Native, born elsewhere (%)
Residents speaking other language at home - Foreign born (%)
Marital status - Never married (%)
Marital status - Now married (%)
Marital status - Separated (%)
Marital status - Widowed (%)
Marital status - Divorced (%)
Ancestries Reported - Arab (%)
Ancestries Reported - Czech (%)
Ancestries Reported - Danish (%)
Ancestries Reported - Dutch (%)
Ancestries Reported - English (%)
Ancestries Reported - French (%)
Ancestries Reported - French Canadian (%)
Ancestries Reported - German (%)
Ancestries Reported - Greek (%)
Ancestries Reported - Hungarian (%)
Ancestries Reported - Irish (%)
Ancestries Reported - Italian (%)
Ancestries Reported - Lithuanian (%)
Ancestries Reported - Norwegian (%)
Ancestries Reported - Polish (%)
Ancestries Reported - Portuguese (%)
Ancestries Reported - Russian (%)
Ancestries Reported - Scotch-Irish (%)
Ancestries Reported - Scottish (%)
Ancestries Reported - Slovak (%)
Ancestries Reported - Subsaharan African (%)
Ancestries Reported - Swedish (%)
Ancestries Reported - Swiss (%)
Ancestries Reported - Ukrainian (%)
Ancestries Reported - United States (%)
Ancestries Reported - Welsh (%)
Ancestries Reported - West Indian (%)
Ancestries Reported - Other (%)
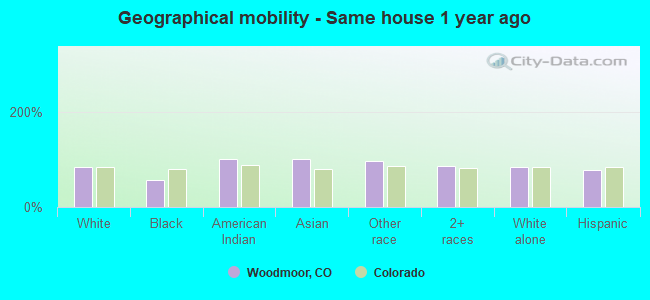
Geographical mobility - Same house 1 year ago (%)
Geographical mobility - Same house 1 year ago (%) - White
Geographical mobility - Same house 1 year ago (%) - Black or African American
Geographical mobility - Same house 1 year ago (%) - Asian
Geographical mobility - Same house 1 year ago (%) - Hispanic or Latino
Geographical mobility - Same house 1 year ago (%) - American Indian and Alaska Native
Geographical mobility - Same house 1 year ago (%) - Multirace
Geographical mobility - Same house 1 year ago (%) - Other Race
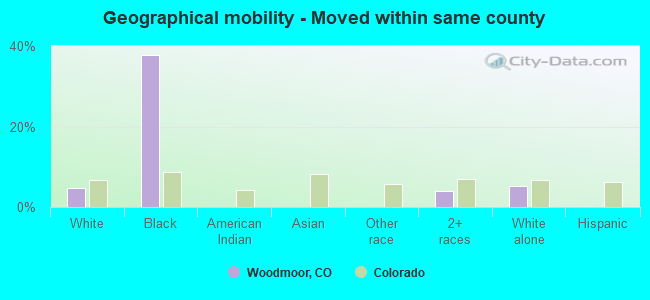
Geographical mobility - Moved within same county (%)
Geographical mobility - Moved within same county (%) - White
Geographical mobility - Moved within same county (%) - Black or African American
Geographical mobility - Moved within same county (%) - Asian
Geographical mobility - Moved within same county (%) - Hispanic or Latino
Geographical mobility - Moved within same county (%) - American Indian and Alaska Native
Geographical mobility - Moved within same county (%) - Multirace
Geographical mobility - Moved within same county (%) - Other Race
Geographical mobility - Moved from different county within same state (%)
Geographical mobility - Moved from different county within same state (%) - White
Geographical mobility - Moved from different county within same state (%) - Black or African American
Geographical mobility - Moved from different county within same state (%) - Asian
Geographical mobility - Moved from different county within same state (%) - Hispanic or Latino
Geographical mobility - Moved from different county within same state (%) - American Indian and Alaska Native
Geographical mobility - Moved from different county within same state (%) - Multirace
Geographical mobility - Moved from different county within same state (%) - Other Race
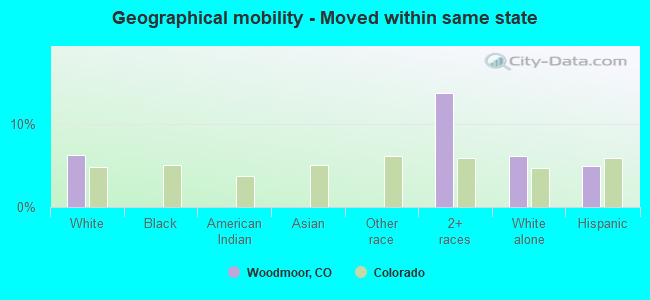
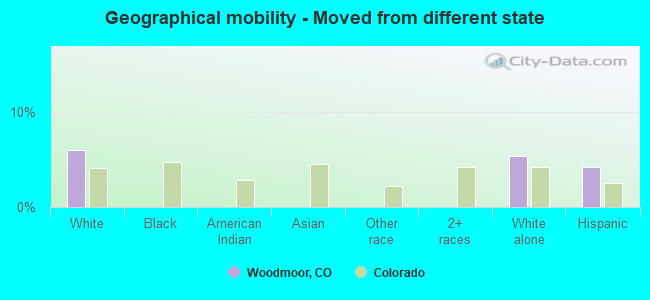
Geographical mobility - Moved from different state (%)
Geographical mobility - Moved from different state (%) - White
Geographical mobility - Moved from different state (%) - Black or African American
Geographical mobility - Moved from different state (%) - Asian
Geographical mobility - Moved from different state (%) - Hispanic or Latino
Geographical mobility - Moved from different state (%) - American Indian and Alaska Native
Geographical mobility - Moved from different state (%) - Multirace
Geographical mobility - Moved from different state (%) - Other Race
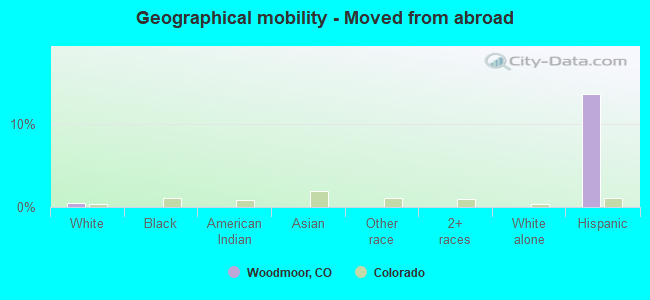
Geographical mobility - Moved from abroad (%)
Geographical mobility - Moved from abroad (%) - White
Geographical mobility - Moved from abroad (%) - Black or African American
Geographical mobility - Moved from abroad (%) - Asian
Geographical mobility - Moved from abroad (%) - Hispanic or Latino
Geographical mobility - Moved from abroad (%) - American Indian and Alaska Native
Geographical mobility - Moved from abroad (%) - Multirace
Geographical mobility - Moved from abroad (%) - Other Race
Place of birth for the foreign-born population - Ireland (%)
Place of birth for the foreign-born population - Denmark (%)
Place of birth for the foreign-born population - Norway (%)
Place of birth for the foreign-born population - Sweden (%)
Place of birth for the foreign-born population - United Kingdom (%)
Place of birth for the foreign-born population - England (%)
Place of birth for the foreign-born population - Scotland (%)
Place of birth for the foreign-born population - Other Northern Europe (%)
Place of birth for the foreign-born population - Austria (%)
Place of birth for the foreign-born population - Belgium (%)
Place of birth for the foreign-born population - France (%)
Place of birth for the foreign-born population - Germany (%)
Place of birth for the foreign-born population - Netherlands (%)
Place of birth for the foreign-born population - Switzerland (%)
Place of birth for the foreign-born population - Other Western Europe (%)
Place of birth for the foreign-born population - Greece (%)
Place of birth for the foreign-born population - Italy (%)
Place of birth for the foreign-born population - Portugal (%)
Place of birth for the foreign-born population - Spain (%)
Place of birth for the foreign-born population - Other Southern Europe (%)
Place of birth for the foreign-born population - Albania (%)
Place of birth for the foreign-born population - Belarus (%)
Place of birth for the foreign-born population - Bosnia and Herzegovina (%)
Place of birth for the foreign-born population - Bulgaria (%)
Place of birth for the foreign-born population - Croatia (%)
Place of birth for the foreign-born population - Czechoslovakia (%)
Place of birth for the foreign-born population - Hungary (%)
Place of birth for the foreign-born population - Latvia (%)
Place of birth for the foreign-born population - Lithuania (%)
Place of birth for the foreign-born population - North Macedonia (Macedonia) (%)
Place of birth for the foreign-born population - Moldova (%)
Place of birth for the foreign-born population - Poland (%)
Place of birth for the foreign-born population - Romania (%)
Place of birth for the foreign-born population - Russia (%)
Place of birth for the foreign-born population - Serbia (%)
Place of birth for the foreign-born population - Ukraine (%)
Place of birth for the foreign-born population - Other Eastern Europe (%)
Place of birth for the foreign-born population - China (%)
Place of birth for the foreign-born population - Hong Kong (%)
Place of birth for the foreign-born population - Taiwan (%)
Place of birth for the foreign-born population - Japan (%)
Place of birth for the foreign-born population - Korea (%)
Place of birth for the foreign-born population - Other Eastern Asia (%)
Place of birth for the foreign-born population - Afghanistan (%)
Place of birth for the foreign-born population - Bangladesh (%)
Place of birth for the foreign-born population - India (%)
Place of birth for the foreign-born population - Iran (%)
Place of birth for the foreign-born population - Kazakhstan (%)
Place of birth for the foreign-born population - Nepal (%)
Place of birth for the foreign-born population - Pakistan (%)
Place of birth for the foreign-born population - Sri Lanka (%)
Place of birth for the foreign-born population - Uzbekistan (%)
Place of birth for the foreign-born population - Other South Central Asia (%)
Place of birth for the foreign-born population - Burma (%)
Place of birth for the foreign-born population - Cambodia (%)
Place of birth for the foreign-born population - Indonesia (%)
Place of birth for the foreign-born population - Laos (%)
Place of birth for the foreign-born population - Malaysia (%)
Place of birth for the foreign-born population - Philippines (%)
Place of birth for the foreign-born population - Singapore (%)
Place of birth for the foreign-born population - Thailand (%)
Place of birth for the foreign-born population - Vietnam (%)
Place of birth for the foreign-born population - Other South Eastern Asia (%)
Place of birth for the foreign-born population - Armenia (%)
Place of birth for the foreign-born population - Iraq (%)
Place of birth for the foreign-born population - Israel (%)
Place of birth for the foreign-born population - Jordan (%)
Place of birth for the foreign-born population - Kuwait (%)
Place of birth for the foreign-born population - Lebanon (%)
Place of birth for the foreign-born population - Saudi Arabia (%)
Place of birth for the foreign-born population - Syria (%)
Place of birth for the foreign-born population - Turkey (%)
Place of birth for the foreign-born population - Yemen (%)
Place of birth for the foreign-born population - Other Western Asia (%)
Place of birth for the foreign-born population - Eritrea (%)
Place of birth for the foreign-born population - Ethiopia (%)
Place of birth for the foreign-born population - Kenya (%)
Place of birth for the foreign-born population - Somalia (%)
Place of birth for the foreign-born population - Uganda (%)
Place of birth for the foreign-born population - Zimbabwe (%)
Place of birth for the foreign-born population - Other Eastern Africa (%)
Place of birth for the foreign-born population - Cameroon (%)
Place of birth for the foreign-born population - Congo (%)
Place of birth for the foreign-born population - Democratic Republic of Congo (Zaire) (%)
Place of birth for the foreign-born population - Other Middle Africa (%)
Place of birth for the foreign-born population - Egypt (%)
Place of birth for the foreign-born population - Morocco (%)
Place of birth for the foreign-born population - Sudan (%)
Place of birth for the foreign-born population - Other Northern Africa (%)
Place of birth for the foreign-born population - South Africa (%)
Place of birth for the foreign-born population - Other Southern Africa (%)
Place of birth for the foreign-born population - Cabo Verde (%)
Place of birth for the foreign-born population - Ghana (%)
Place of birth for the foreign-born population - Liberia (%)
Place of birth for the foreign-born population - Nigeria (%)
Place of birth for the foreign-born population - Senegal (%)
Place of birth for the foreign-born population - Sierra Leone (%)
Place of birth for the foreign-born population - Other Western Africa (%)
Place of birth for the foreign-born population - Australia (%)
Place of birth for the foreign-born population - New Zealand (%)
Place of birth for the foreign-born population - Fiji (%)
Place of birth for the foreign-born population - Micronesia (%)
Place of birth for the foreign-born population - Bahamas (%)
Place of birth for the foreign-born population - Barbados (%)
Place of birth for the foreign-born population - Cuba (%)
Place of birth for the foreign-born population - Dominica (%)
Place of birth for the foreign-born population - Dominican Republic (%)
Place of birth for the foreign-born population - Grenada (%)
Place of birth for the foreign-born population - Haiti (%)
Place of birth for the foreign-born population - Jamaica (%)
Place of birth for the foreign-born population - St. Vincent and the Grenadines (%)
Place of birth for the foreign-born population - Trinidad and Tobago (%)
Place of birth for the foreign-born population - West Indies (%)
Place of birth for the foreign-born population - Other Caribbean (%)
Place of birth for the foreign-born population - Belize (%)
Place of birth for the foreign-born population - Costa Rica (%)
Place of birth for the foreign-born population - El Salvador (%)
Place of birth for the foreign-born population - Guatemala (%)
Place of birth for the foreign-born population - Honduras (%)
Place of birth for the foreign-born population - Mexico (%)
Place of birth for the foreign-born population - Nicaragua (%)
Place of birth for the foreign-born population - Panama (%)
Place of birth for the foreign-born population - Other Central America (%)
Place of birth for the foreign-born population - Argentina (%)
Place of birth for the foreign-born population - Bolivia (%)
Place of birth for the foreign-born population - Brazil (%)
Place of birth for the foreign-born population - Chile (%)
Place of birth for the foreign-born population - Colombia (%)
Place of birth for the foreign-born population - Ecuador (%)
Place of birth for the foreign-born population - Guyana (%)
Place of birth for the foreign-born population - Peru (%)
Place of birth for the foreign-born population - Uruguay (%)
Place of birth for the foreign-born population - Venezuela (%)
Place of birth for the foreign-born population - Other South America (%)
Place of birth for the foreign-born population - Canada (%)
Place of birth for the foreign-born population - Other Northern America (%)
Place of birth for the foreign-born population - Other (%)
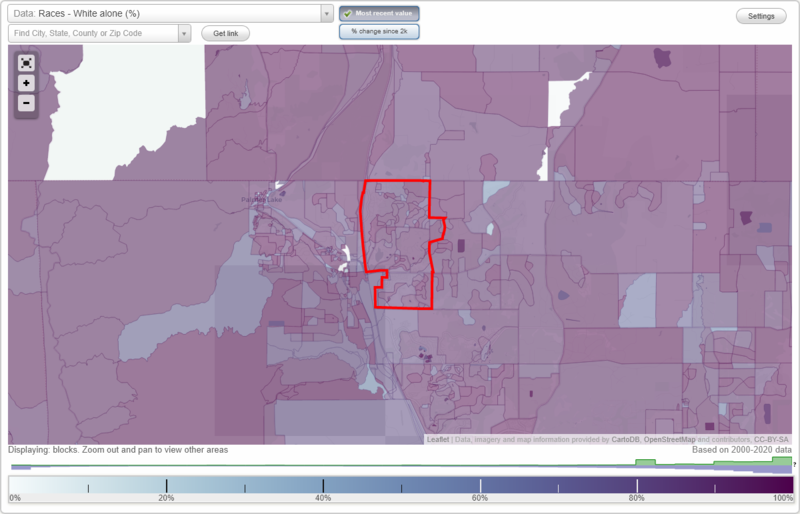
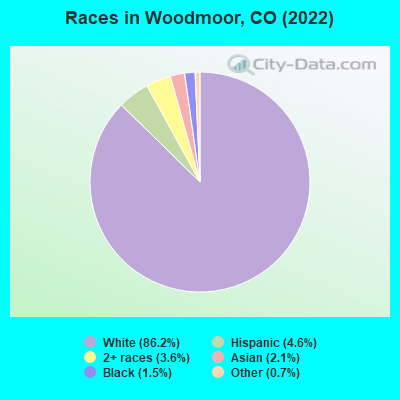
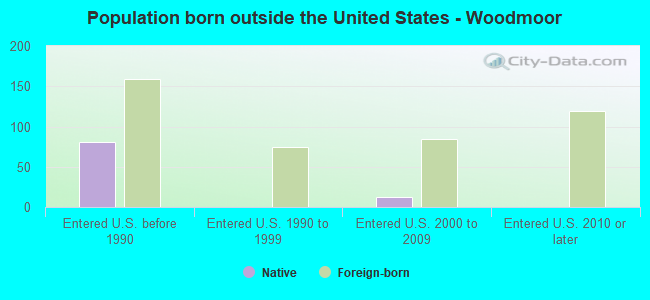
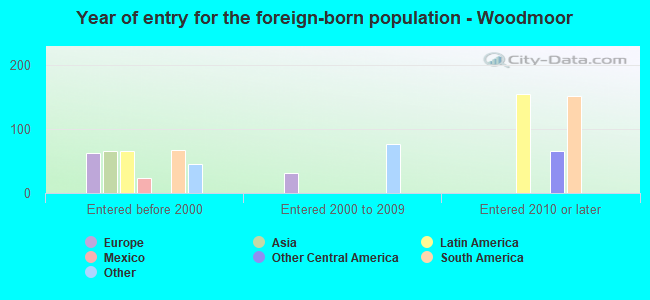
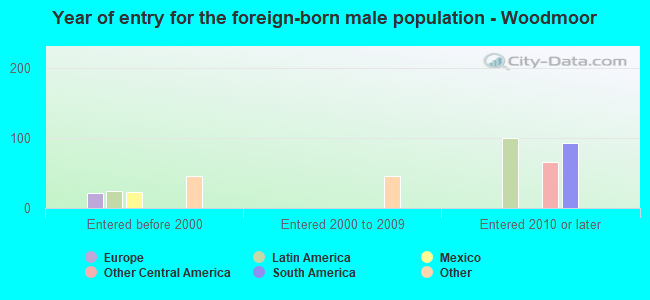
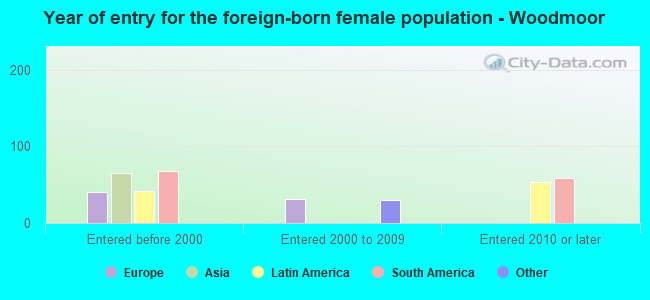
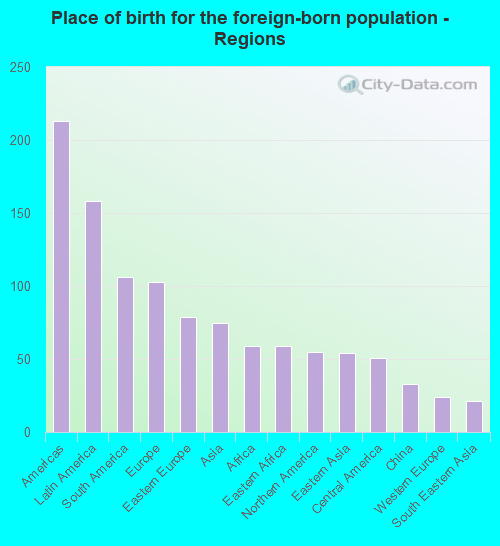
According to 2022 data, the most numerous races in Woodmoor, CO are White alone (8,061 residents), Hispanic (663 residents), and Two or more races (713 residents). 94.6% of Woodmoor residents speak English at home. 4.6% of Woodmoor, CO residents are foreign-born (1.6% born in Latin America, 1.1% born in Europe, 0.8% born in Asia, 0.6% born in Africa, 0.6% born in North America), which is 97.3% less than the foreign-born rate of 9.0% across the entire state of Colorado.
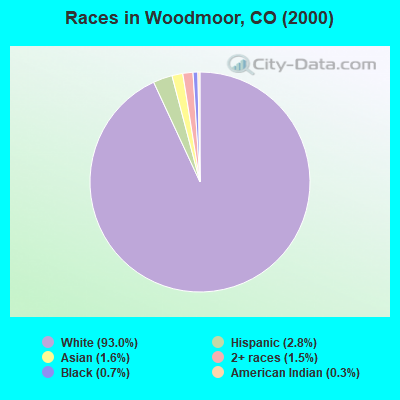
Race distribution in Woodmoor
2000 2022
3,202,880 74.5% White alone 735,601 17.1% Hispanic 158,443 3.7% Black alone 93,277 2.2% Asian alone 72,721 1.7% Two or more races 28,982 0.7% American Indian alone 5,512 0.1% Other race alone 3,845 0.09% Native Hawaiian and Other
3,793,270 65.0% White alone 1,314,962 22.5% Hispanic 268,754 4.6% Two or more races 220,756 3.8% Black alone 182,658 3.1% Asian alone 29,798 0.5% Other race alone 23,389 0.4% American Indian alone 6,339 0.1% Native Hawaiian and Other
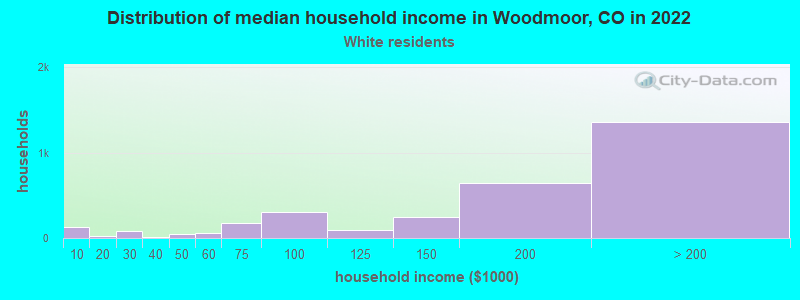
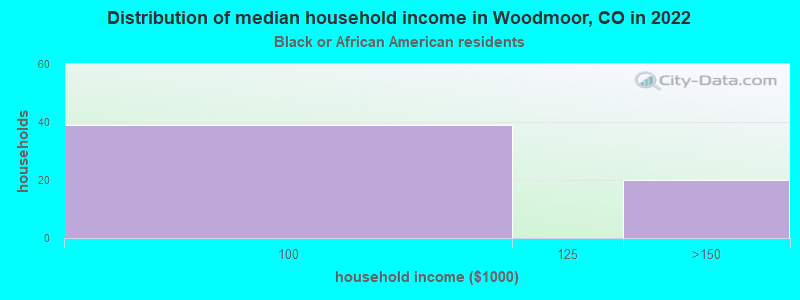
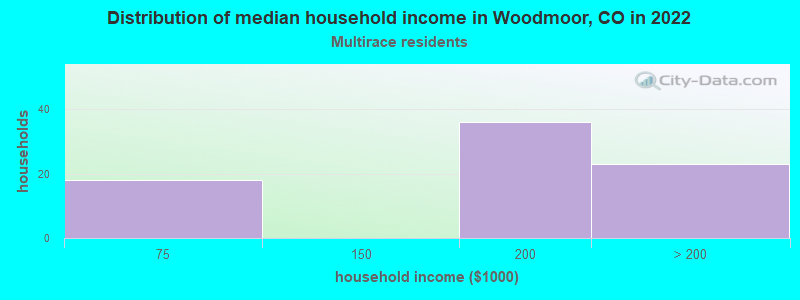
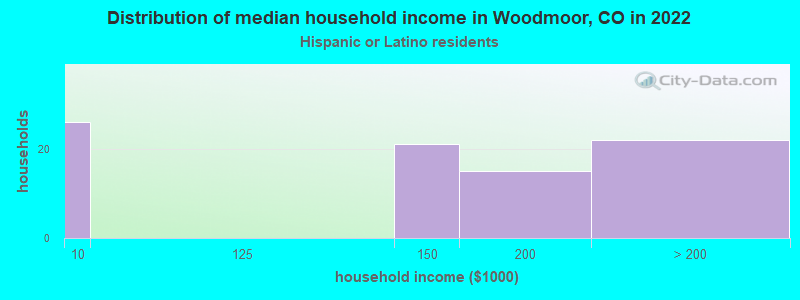
Income and house value in Woodmoor Median household income in 2022 $190,588 White non-Hispanic householders$132,093 Black householdersover $200,000 Asian householders$5,093 Some other race householders$97,142 Two or more races householdersover $200,000 Hispanic or Latino race householdersMedian 2022 house value $922,209 White Non-Hispanic householders$736,109 Black or African American householders $884,724 Asian householdersover $1,000,000 Some other race householders$933,156 Two or more races householders$881,075 Hispanic or Latino householders
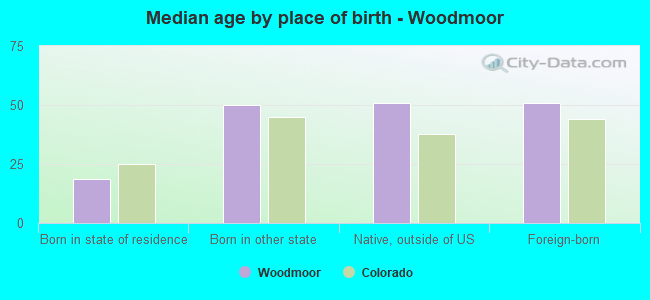
Median age by race in Woodmoor
47.0 Median age for White residents47.4 46.6 46.0 Median age for Black or African American residents49.8 45.2 70.5 Median age for American Indian / Alaska Native residents50.0 Median age for Asian residents25.6 Median age for Other race residents32.1 Median age for Two or more races residents48.7 20.9 47.0 Median age for White alone residents47.5 46.3 33.3 Median age for Hispanic or Latino residents34.5 32.9
Owner/renter occupied households by race in Woodmoor
House owners and renters - White residents 2,771 93.2% Owner occupied202 6.8% Renter occupiedHouse owners and renters - Black or African American residents 37 36.1% Owner occupied66 63.9% Renter occupiedHouse owners and renters - Asian residents 18 100.0% Owner occupiedHouse owners and renters - Two or more races residents 432 100.0% Owner occupiedHouse owners and renters - White alone residents 2,723 92.6% Owner occupied218 7.4% Renter occupiedHouse owners and renters - Hispanic or Latino residents 141 100.0% Owner occupied
Language usage in Woodmoor
English speakers - Total 94.6% of residents of Woodmoor speak English at home.
3.5% of residents speak Spanish at home 258 79.6% Speak English very well66 20.4% Speak English less than very well2.5% of residents speak other language at home 235 100.0% Speak English very well
English speakers - Born in the United States 97.5% of residents of Woodmoor speak English at home.
1.9% of residents speak Spanish at home 122 100.0% Speak English very well0.7% of residents speak other language at home 47 100.0% Speak English very well
English speakers - Native, born elsewhere 52.7% of residents of Woodmoor speak English at home.
32.7% of residents speak Spanish at home 36 100.0% Speak English very well14.5% of residents speak other language at home 16 100.0% Speak English very well
English speakers - Foreign-born 32.2% of residents of Woodmoor speak English at home.
35.1% of residents speak Spanish at home 93 58.9% Speak English very well65 41.1% Speak English less than very well35.1% of residents speak other language at home 158 100.0% Speak English very well
White (Caucasian) - Speak only English Native:
99.8% (7,748)Foreign-born:
43.4% (85)
White (Caucasian) - Speak another language Native:
1.9% (151)Foreign-born:
60.5% (119)
Black or African American - Speak only English Native:
99.6% (138)Foreign-born:
52.4% (44)
Two or more races - Speak only English Native:
85.4% (1,033)Foreign-born:
48.0% (76)
White alone - Speak only English Native:
98.4% (7,649)Foreign-born:
48.1% (62)
White alone - Speak another language Native:
1.7% (129)Foreign-born:
51.3% (66)
Hispanic or Latino - Speak only English Native:
80.5% (335)Foreign-born:
26.8% (44)
Hispanic or Latino - Speak another language Native:
21.5% (90)Foreign-born:
81.7% (135)
Foreign-born residents in Woodmoor 452 residents are foreign born (1.6% Latin America , 1.1% Europe , 0.8% Asia , 0.6% Africa , 0.6% North America ).
This city:
4.6%Colorado:
100.0%
Marital status for residents in Woodmoor Marital status - White (Caucasian) population 15 years and over
Males 26.8% Never married66.2% Now married0.5% Separated0.5% Widowed6.1% DivorcedFemales 18.4% Never married76.9% Now married0.0% Separated0.9% Widowed3.9% DivorcedWomen who gave birth in the past 12 months Now married:
69.1% (53)Unmarried:
30.9% (23)
Women who did not give birth in the past 12 months Now married:
61.3% (905)Unmarried:
38.7% (571)
Marital status - Black or African American population 15 years and over
Males 0.0% Never married100.0% Now married0.0% Separated0.0% Widowed0.0% DivorcedFemales 43.8% Never married56.2% Now married0.0% Separated0.0% Widowed0.0% DivorcedWomen who did not give birth in the past 12 months Now married:
30.0% (16)Unmarried:
70.0% (37)
Marital status - American Indian / Alaska Native population 15 years and over
Males 0.0% Never married100.0% Now married0.0% Separated0.0% Widowed0.0% DivorcedFemales 0.0% Never married100.0% Now married0.0% Separated0.0% Widowed0.0% DivorcedMarital status - Asian population 15 years and over
Males 38.3% Never married61.7% Now married0.0% Separated0.0% Widowed0.0% DivorcedFemales 12.7% Never married79.1% Now married0.0% Separated0.0% Widowed8.2% DivorcedWomen who did not give birth in the past 12 months Now married:
80.2% (75)Unmarried:
19.8% (18)
Marital status - Other race population 15 years and over
Males 0.0% Never married100.0% Now married0.0% Separated0.0% Widowed0.0% DivorcedFemales 53.1% Never married46.9% Now married0.0% Separated0.0% Widowed0.0% DivorcedWomen who did not give birth in the past 12 months Now married:
46.9% (20)Unmarried:
53.1% (23)
Marital status - Two or more races population 15 years and over
Males 37.2% Never married51.8% Now married0.0% Separated0.0% Widowed11.1% DivorcedFemales 43.9% Never married56.1% Now married0.0% Separated0.0% Widowed0.0% DivorcedWomen who did not give birth in the past 12 months Now married:
40.4% (159)Unmarried:
59.6% (235)
Marital status - White alone, not Hispanic / Latino population 15 years and over
Males 26.9% Never married65.6% Now married0.5% Separated0.5% Widowed6.5% DivorcedFemales 17.4% Never married77.4% Now married0.0% Separated0.9% Widowed4.2% DivorcedWomen who gave birth in the past 12 months Now married:
69.1% (56)Unmarried:
30.9% (25)
Women who did not give birth in the past 12 months Now married:
61.0% (849)Unmarried:
39.0% (542)
Marital status - Hispanic or Latino population 15 years and over
Males 21.6% Never married78.4% Now married0.0% Separated0.0% Widowed0.0% DivorcedFemales 33.0% Never married67.0% Now married0.0% Separated0.0% Widowed0.0% DivorcedWomen who did not give birth in the past 12 months Now married:
61.3% (154)Unmarried:
38.7% (97)
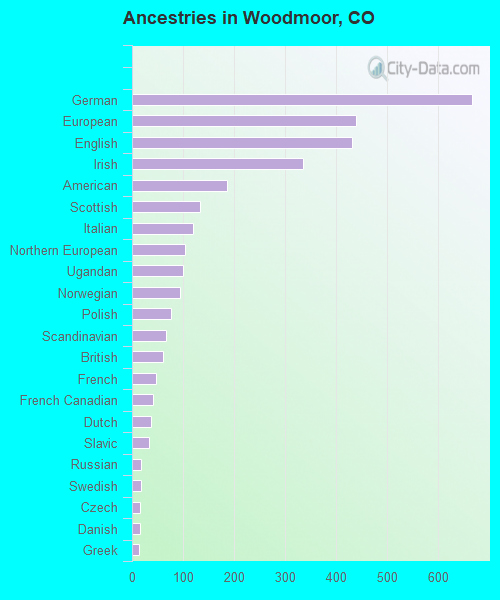
Ancestries in Woodmoor
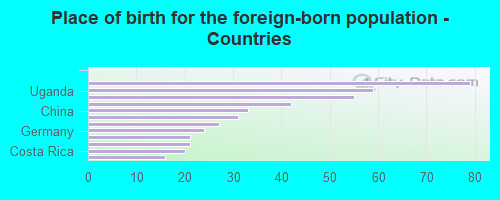
1,119 25.6% European489 11.2% German370 8.5% English290 6.6% Irish192 4.4% Northern European189 4.3% American144 3.3% Ugandan123 2.8% Scottish95 2.2% Polish49 1.1% Italian45 1.0% Ukrainian41 0.9% Norwegian36 0.8% Swedish32 0.7% Scotch-Irish30 0.7% Slavic28 0.6% French25 0.6% Serbian18 0.4% Hungarian18 0.4% Scandinavian17 0.4% Danish17 0.4% French Canadian16 0.4% Dutch15 0.3% Czech14 0.3% British11 0.3% Slovene
Children Nativity (place of birth) in Woodmoor
Children under 6 years - Living with two parents Both parents native 262 100.0% NativeOne native, one foreign-born parent 50 100.0% NativeChildren under 6 years - Living with one parent Native parent 37 100.0% NativeChildren 6 to 17 years - Living with two parents Both parents native 1,497 100.0% Native0 0.0% Foreign-bornBoth parents foreign-born 11 34.7% Native22 65.3% Foreign-bornOne native, one foreign-born parent 260 100.0% NativeChildren 6 to 17 years - Living with one parent Native parent 129 85.1% Native23 14.9% Foreign-bornForeign-born parent 20 100.0% Native