Races in Yellowstone National Park, Wyoming (WY) Detailed Stats
Ancestries, Foreign-born residents, place of birth
Race distribution in Yellowstone National Park

- 35198.0%White alone
- 41.1%Hispanic
- 30.8%Asian alone
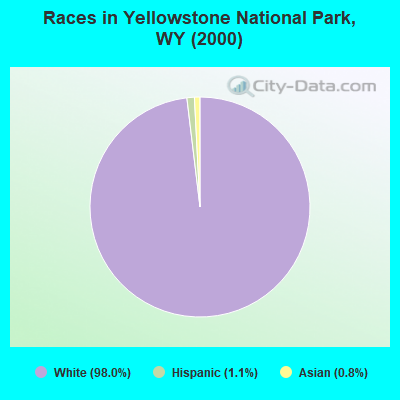
2000
2022
-
- 438,79988.9%White alone
- 31,6696.4%Hispanic
- 10,2382.1%American Indian alone
- 6,1641.2%Two or more races
- 3,5040.7%Black alone
- 2,6700.5%Asian alone
- 4740.10%Other race alone
- 2640.05%Native Hawaiian and Other
Pacific Islander alone

-
- 473,22081.4%White alone
- 62,80310.8%Hispanic
- 22,9113.9%Two or more races
- 9,5891.6%American Indian alone
- 4,9970.9%Other race alone
- 3,9900.7%Black alone
- 3,5770.6%Asian alone
- 2940.05%Native Hawaiian and Other
Pacific Islander alone

Income and house value in Yellowstone National Park
- Median household income in 2022
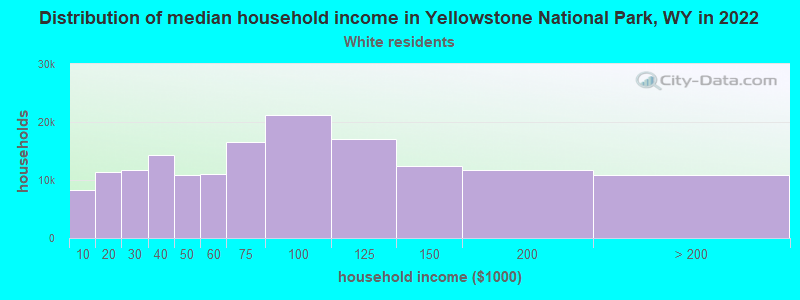
- $108,312White non-Hispanic householders
- $34,664Some other race householders
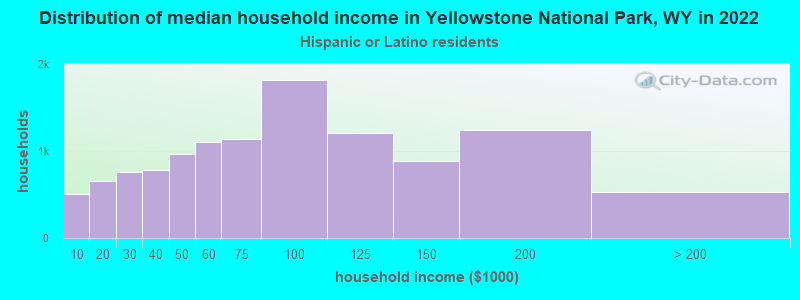
- $34,803Hispanic or Latino race householders
- Median 2022 house value
- $543,973White Non-Hispanic householders
Household income for White non-Hispanic householders
Household income for Hispanic or Latino race householders
Zip code: 82190