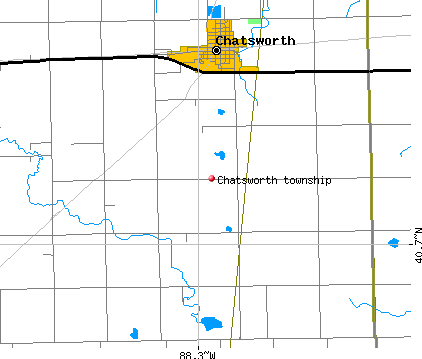
Chatsworth township, Livingston County, Illinois (IL) detailed profile
Number of foreign born residents: 1 (100% naturalized citizens)
| Chatsworth township: | 0.6% |
| Whole state: | 12.3% |
62% of Chatsworth township residents lived in the same house 5 years ago.
Out of people who lived in different houses, 43% lived in this county.
Out of people who lived in different counties, 86% lived in Illinois.
Place of birth for U.S.-born residents:
- This state: 1190
- Northeast: 21
- Midwest: 119
- South: 120
- West: 12
Median price asked for vacant for-sale houses in 2000: $60,000
Percentage of households with unmarried partners: 5.5%
Likely homosexual households (counted as self-reported same-sex unmarried-partner households)
- Lesbian couples: 0.0% of all households
- Gay men: 0.2% of all households
Housing units in structures:
- One, detached: 567
- One, attached: 3
- Two: 33
- 3 or 4: 42
- 5 to 9: 6
- Mobile homes: 9
Median worth of mobile homes: $23,800
Housing units in Chatsworth township with a mortgage: 202 (14 second mortgage, 12 home equity loan, 0 both second mortgage and home equity loan)
Houses without a mortgage: 194
- Metal and metal products (16%)
- Agriculture, forestry, fishing and hunting (12%)
- Construction (8%)
- Truck transportation (7%)
- Motor vehicle and parts dealers (6%)
- Accommodation and food services (6%)
- Printing and related support activities (3%)
- Health care (17%)
- Metal and metal products (12%)
- Food and beverage stores (9%)
- Educational services (8%)
- Finance and insurance (7%)
- Accommodation and food services (4%)
- Construction (4%)
- Driver/sales workers and truck drivers (14%)
- Other production occupations including supervisors (10%)
- Metal workers and plastic workers (9%)
- Farmers and farm managers (7%)
- Vehicle and mobile equipment mechanics, installers, and repairers (7%)
- Laborers and material movers, hand (5%)
- Agricultural workers including supervisors (4%)
- Bookkeeping, accounting, and auditing clerks (11%)
- Secretaries and administrative assistants (7%)
- Laborers and material movers, hand (5%)
- Material recording, scheduling, dispatching, and distributing workers (5%)
- Retail sales workers except cashiers (5%)
- Other production occupations including supervisors (5%)
- Health technologists and technicians (4%)
Most common first ancestries reported in Chatsworth township:
- German (39.9%)
- Irish (14.8%)
- United States or American (14.7%)
- Italian (6.9%)
- English (3.8%)
- Polish (3.1%)
- French (except Basque) (2.1%)
Most common places of birth for the foreign-born residents:
- Canada (44%)
- Italy (33%)
- United Kingdom (22%)
Means of transportation to work:
- Drove a car alone: 541 (81%)
- Carpooled: 74 (11%)
- Bicycle: 4 (1%)
- Walked: 14 (2%)
- Other means: 8 (1%)
- Worked at home: 24 (4%)
Most commonly used house heating fuel:
- Utility gas (82%)
- Bottled, tank, or LP gas (7%)
- Electricity (7%)
- Fuel oil, kerosene, etc. (2%)
- Wood (1%)
- No fuel used (1%)
99.0% of residents of Chatsworth township speak English at home.
0.2% of residents speak Spanish at home (33% speak English very well, 67% speak English not well).
0.6% of residents speak other Indo-European language at home (100% speak English very well).
0.1% of residents speak other language at home (100% speak English very well).
Household type by relationship:
Households: 1,471- In family households: 1,240 (303 male householders, 91 female householders)
313 spouses, 449 children (394 natural, 6 adopted, 49 stepchildren), 14 grandchildren, 21 brothers or sisters, 0 parents, 17 other relatives, 32 non-relatives
- In nonfamily households: 231 (89 male householders (84 living alone)), 119 female householders (111 living alone)), 23 nonrelatives
Size of family households: 173 2-persons, 92 3-persons, 53 4-persons, 42 5-persons, 23 6-persons, 11 7-or-more-persons,
Size of nonfamily households: 195 1-person, 11 2-persons, 2 5-persons,
272 married couples with children.
99 single-parent households (25 men, 74 women).
Private vs. public school enrollment:
Students in private schools in grades 1 to 8 (elementary and middle school): 2
| Here: | 0.9% |
| Illinois: | 13.4% |
Students in private schools in grades 9 to 12 (high school): 4
| Here: | 3.1% |
| Illinois: | 11.1% |
Students in private undergraduate colleges: 0
| Here: | 0.0% |
| Illinois: | 25.8% |