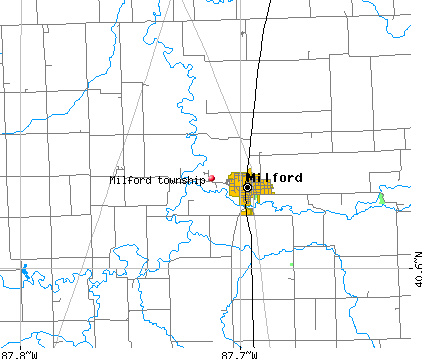
Milford township, Iroquois County, Illinois (IL) detailed profile
Number of foreign born residents: 1 (58% naturalized citizens)
| Milford township: | 1.4% |
| Whole state: | 12.3% |
63% of Milford township residents lived in the same house 5 years ago.
Out of people who lived in different houses, 68% lived in this county.
Out of people who lived in different counties, 78% lived in Illinois.
Place of birth for U.S.-born residents:
- This state: 1564
- Northeast: 9
- Midwest: 119
- South: 104
- West: 6
Median price asked for vacant for-sale houses in 2000: $34,200
Percentage of households with unmarried partners: 4.7%
Likely homosexual households (counted as self-reported same-sex unmarried-partner households)
- Lesbian couples: 0.1% of all households
- Gay men: 0.1% of all households
Housing units in structures:
- One, detached: 707
- One, attached: 8
- Two: 32
- 3 or 4: 18
- 5 to 9: 24
- 10 to 19: 36
- Mobile homes: 31
Median worth of mobile homes: $51,700
Housing units in Milford township with a mortgage: 269 (17 second mortgage, 11 home equity loan, 0 both second mortgage and home equity loan)
Houses without a mortgage: 240
- Agriculture, forestry, fishing and hunting (10%)
- Construction (9%)
- Metal and metal products (7%)
- Truck transportation (7%)
- Educational services (7%)
- Repair and maintenance (6%)
- Warehousing and storage (4%)
- Health care (18%)
- Educational services (15%)
- Accommodation and food services (7%)
- Social assistance (5%)
- Finance and insurance (4%)
- Agriculture, forestry, fishing and hunting (4%)
- Public administration (4%)
- Other production occupations including supervisors (8%)
- Driver/sales workers and truck drivers (8%)
- Farmers and farm managers (7%)
- Metal workers and plastic workers (7%)
- Vehicle and mobile equipment mechanics, installers, and repairers (5%)
- Laborers and material movers, hand (5%)
- Material recording, scheduling, dispatching, and distributing workers (4%)
- Assemblers and fabricators (8%)
- Secretaries and administrative assistants (7%)
- Bookkeeping, accounting, and auditing clerks (7%)
- Cooks and food preparation workers (7%)
- Preschool, kindergarten, elementary and middle school teachers (5%)
- Other office and administrative support workers including supervisors (5%)
- Building and grounds cleaning and maintenance occupations (5%)
Most common first ancestries reported in Milford township:
- German (39.6%)
- United States or American (14.4%)
- English (11.7%)
- Irish (6.6%)
- French (except Basque) (3.6%)
- Swedish (2.2%)
- Scotch-Irish (2.1%)
Most common places of birth for the foreign-born residents:
- Mexico (65%)
- United Kingdom (35%)
Means of transportation to work:
- Drove a car alone: 649 (76%)
- Carpooled: 122 (14%)
- Bus or trolley bus: 5 (1%)
- Bicycle: 5 (1%)
- Walked: 16 (2%)
- Other means: 7 (1%)
- Worked at home: 45 (5%)
Most commonly used house heating fuel:
- Utility gas (73%)
- Electricity (15%)
- Bottled, tank, or LP gas (6%)
- Fuel oil, kerosene, etc. (5%)
- Other fuel (1%)
95.8% of residents of Milford township speak English at home.
3.8% of residents speak Spanish at home (75% speak English very well, 10% speak English well, 10% speak English not well, 4% don't speak English at all).
0.3% of residents speak other Indo-European language at home (100% speak English very well).
Household type by relationship:
Households: 1,829- In family households: 1,542 (442 male householders, 92 female householders)
456 spouses, 482 children (408 natural, 18 adopted, 56 stepchildren), 18 grandchildren, 6 brothers or sisters, 16 parents, 7 other relatives, 23 non-relatives
- In nonfamily households: 287 (103 male householders (86 living alone)), 156 female householders (150 living alone)), 28 nonrelatives
Size of family households: 291 2-persons, 114 3-persons, 76 4-persons, 37 5-persons, 8 6-persons, 8 7-or-more-persons,
Size of nonfamily households: 236 1-person, 21 2-persons, 2 3-persons,
264 married couples with children.
78 single-parent households (16 men, 62 women).
Private vs. public school enrollment:
Students in private schools in grades 1 to 8 (elementary and middle school): 0
| Here: | 0.0% |
| Illinois: | 13.4% |
Students in private schools in grades 9 to 12 (high school): 0
| Here: | 0.0% |
| Illinois: | 11.1% |
Students in private undergraduate colleges: 3
| Here: | 8.8% |
| Illinois: | 25.8% |