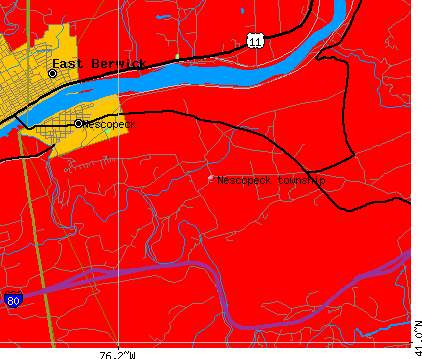
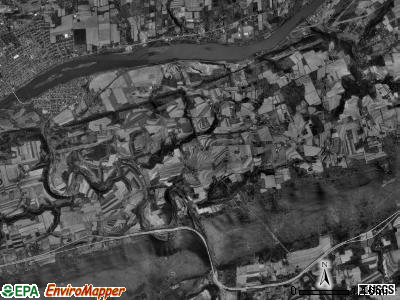
Nescopeck township, Luzerne County, Pennsylvania (PA) detailed profile
Number of foreign born residents: 0 (50% naturalized citizens)
| Nescopeck township: | 0.4% |
| Whole state: | 4.1% |
79% of Nescopeck township residents lived in the same house 5 years ago.
Out of people who lived in different houses, 55% lived in this county.
Out of people who lived in different counties, 90% lived in Pennsylvania.
Place of birth for U.S.-born residents:
- This state: 978
- Northeast: 48
- Midwest: 14
- South: 31
- West: 19
Median price asked for vacant for-sale houses in 2000: $91,000
Percentage of households with unmarried partners: 3.9%
Likely homosexual households (counted as self-reported same-sex unmarried-partner households)
- Lesbian couples: 0.5% of all households
- Gay men: 0.0% of all households
Housing units in structures:
- One, detached: 406
- Mobile homes: 50
- Boats, RVs, vans, etc.: 3
Median worth of mobile homes: $14,000
Housing units in Nescopeck township with a mortgage: 195 (10 second mortgage, 51 home equity loan, 0 both second mortgage and home equity loan)
Houses without a mortgage: 75
- Construction (15%)
- Food (8%)
- Utilities (8%)
- Textile mills and textile products (7%)
- Administrative and support and waste management services (6%)
- Metal and metal products (5%)
- Educational services (5%)
- Health care (19%)
- Educational services (8%)
- Apparel (7%)
- Personal and laundry services (6%)
- Textile mills and textile products (5%)
- Religious, grantmaking, civic, professional, and similar organizations (4%)
- Utilities (4%)
- Electrical equipment mechanics and other installation, maintenance, and repair occupations including supervisors (9%)
- Building and grounds cleaning and maintenance occupations (8%)
- Laborers and material movers, hand (7%)
- Other production occupations including supervisors (6%)
- Driver/sales workers and truck drivers (5%)
- Material recording, scheduling, dispatching, and distributing workers (5%)
- Carpenters (5%)
- Secretaries and administrative assistants (7%)
- Other office and administrative support workers including supervisors (7%)
- Textile, apparel, and furnishings workers (7%)
- Other production occupations including supervisors (5%)
- Personal appearance workers (5%)
- Other sales and related workers including supervisors (5%)
- Laborers and material movers, hand (4%)
Most common first ancestries reported in Nescopeck township:
- German (37.5%)
- Irish (10.3%)
- Italian (9.2%)
- Polish (8.7%)
- Dutch (8.4%)
- English (4.9%)
- Pennsylvania German (4.6%)
Most common places of birth for the foreign-born residents:
- Czechoslovakia (includes Czech Republic and Slovakia) (50%)
- Poland (50%)
Means of transportation to work:
- Drove a car alone: 449 (80%)
- Carpooled: 63 (11%)
- Bus or trolley bus: 4 (1%)
- Walked: 7 (1%)
- Other means: 4 (1%)
- Worked at home: 31 (6%)
Most commonly used house heating fuel:
- Fuel oil, kerosene, etc. (53%)
- Electricity (21%)
- Coal or coke (12%)
- Wood (8%)
- Bottled, tank, or LP gas (5%)
98.5% of residents of Nescopeck township speak English at home.
0.5% of residents speak Spanish at home (100% speak English very well).
1.0% of residents speak other Indo-European language at home (82% speak English very well, 18% speak English not well).
Household type by relationship:
Households: 1,096- In family households: 1,003 (299 male householders, 40 female householders)
308 spouses, 330 children (310 natural, 5 adopted, 15 stepchildren), 6 grandchildren, 2 brothers or sisters, 6 parents, 2 other relatives, 10 non-relatives
- In nonfamily households: 93 (41 male householders (34 living alone)), 34 female householders (29 living alone)), 18 nonrelatives
Size of family households: 152 2-persons, 78 3-persons, 78 4-persons, 19 5-persons, 12 6-persons,
Size of nonfamily households: 63 1-person, 9 2-persons, 3 4-persons,
222 married couples with children.
30 single-parent households (13 men, 17 women).
Private vs. public school enrollment:
Students in private schools in grades 1 to 8 (elementary and middle school): 8
| Here: | 6.3% |
| Pennsylvania: | 16.0% |
Students in private schools in grades 9 to 12 (high school): 2
| Here: | 2.1% |
| Pennsylvania: | 13.1% |
Students in private undergraduate colleges: 4
| Here: | 9.5% |
| Pennsylvania: | 37.3% |