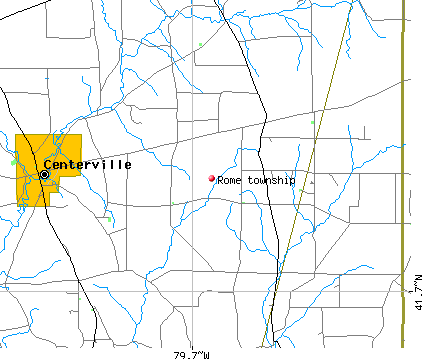
Rome township, Crawford County, Pennsylvania (PA) detailed profile
Number of foreign born residents: 0 (100% naturalized citizens)
| Rome township: | 0.1% |
| Whole state: | 4.1% |
75% of Rome township residents lived in the same house 5 years ago.
Out of people who lived in different houses, 66% lived in this county.
Out of people who lived in different counties, 62% lived in Pennsylvania.
Place of birth for U.S.-born residents:
- This state: 1429
- Northeast: 38
- Midwest: 205
- South: 34
- West: 8
Median price asked for vacant for-sale houses in 2000: $65,000
Percentage of households with unmarried partners: 3.0%
Likely homosexual households (counted as self-reported same-sex unmarried-partner households)
- Lesbian couples: 0.0% of all households
- Gay men: 0.4% of all households
Housing units in structures:
- One, detached: 444
- One, attached: 14
- Two: 3
- 5 to 9: 2
- Mobile homes: 144
- Boats, RVs, vans, etc.: 6
Median worth of mobile homes: $15,000
Housing units in Rome township with a mortgage: 109 (21 second mortgage, 16 home equity loan, 0 both second mortgage and home equity loan)
Houses without a mortgage: 64
- Wood products (23%)
- Agriculture, forestry, fishing and hunting (12%)
- Construction (8%)
- Metal and metal products (6%)
- Truck transportation (5%)
- Repair and maintenance (5%)
- Plastics and rubber products (4%)
- Health care (20%)
- Accommodation and food services (16%)
- Plastics and rubber products (10%)
- Food and beverage stores (9%)
- Agriculture, forestry, fishing and hunting (6%)
- Educational services (4%)
- Construction (3%)
- Woodworkers (9%)
- Metal workers and plastic workers (9%)
- Driver/sales workers and truck drivers (8%)
- Other production occupations including supervisors (8%)
- Fishing and hunting, and forest and logging workers (6%)
- Laborers and material movers, hand (5%)
- Material moving workers except supervisors and laborers and material movers, hand (4%)
- Cashiers (7%)
- Health technologists and technicians (6%)
- Assemblers and fabricators (6%)
- Metal workers and plastic workers (5%)
- Laborers and material movers, hand (5%)
- Cooks and food preparation workers (5%)
- Other food preparation and serving workers including supervisors (5%)
Most common first ancestries reported in Rome township:
- German (25.5%)
- United States or American (18.3%)
- Pennsylvania German (9.5%)
- English (8.4%)
- Irish (7.3%)
- Polish (5.8%)
- Swiss (4.2%)
Most common places of birth for the foreign-born residents:
- Canada (100%)
Means of transportation to work:
- Drove a car alone: 341 (60%)
- Carpooled: 105 (19%)
- Taxi: 10 (2%)
- Walked: 56 (10%)
- Other means: 15 (3%)
- Worked at home: 38 (7%)
Most commonly used house heating fuel:
- Wood (32%)
- Fuel oil, kerosene, etc. (24%)
- Bottled, tank, or LP gas (24%)
- Utility gas (10%)
- Coal or coke (4%)
- Other fuel (2%)
- Electricity (2%)
76.1% of residents of Rome township speak English at home.
0.3% of residents speak Spanish at home (25% speak English very well, 75% speak English not well).
23.7% of residents speak other Indo-European language at home (34% speak English very well, 45% speak English well, 17% speak English not well, 4% don't speak English at all).
Household type by relationship:
Households: 1,720- In family households: 1,587 (369 male householders, 44 female householders)
361 spouses, 737 children (722 natural, 6 adopted, 9 stepchildren), 24 grandchildren, 9 brothers or sisters, 10 parents, 12 other relatives, 21 non-relatives
- In nonfamily households: 133 (68 male householders (53 living alone)), 43 female householders (41 living alone)), 22 nonrelatives
Size of family households: 151 2-persons, 69 3-persons, 71 4-persons, 51 5-persons, 27 6-persons, 44 7-or-more-persons,
Size of nonfamily households: 94 1-person, 12 2-persons, 4 3-persons, 1 4-persons,
589 married couples with children.
58 single-parent households (14 men, 44 women).
Private vs. public school enrollment:
Students in private schools in grades 1 to 8 (elementary and middle school): 136
| Here: | 48.6% |
| Pennsylvania: | 16.0% |
Students in private schools in grades 9 to 12 (high school): 3
| Here: | 3.6% |
| Pennsylvania: | 13.1% |
Students in private undergraduate colleges: 0
| Here: | 0.0% |
| Pennsylvania: | 37.3% |