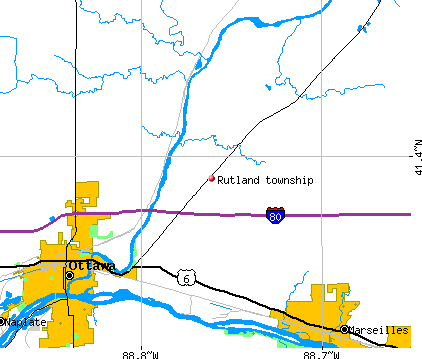
Rutland township, La Salle County, Illinois (IL) detailed profile
Number of foreign born residents: 1 (39% naturalized citizens)
| Rutland township: | 1.0% |
| Whole state: | 12.3% |
53% of Rutland township residents lived in the same house 5 years ago.
Out of people who lived in different houses, 71% lived in this county.
Out of people who lived in different counties, 79% lived in Illinois.
Place of birth for U.S.-born residents:
- This state: 7026
- Northeast: 53
- Midwest: 524
- South: 495
- West: 158
Median price asked for vacant for-sale houses in 2000: $56,000
Percentage of households with unmarried partners: 5.5%
Likely homosexual households (counted as self-reported same-sex unmarried-partner households)
- Lesbian couples: 0.1% of all households
- Gay men: 0.1% of all households
98 people in nursing homes
2 people in religious group quarters
Housing units in structures:
- One, detached: 2,649
- One, attached: 32
- Two: 201
- 3 or 4: 146
- 5 to 9: 138
- 10 to 19: 34
- 20 to 49: 74
- Mobile homes: 204
Median worth of mobile homes: $16,300
Housing units in Rutland township with a mortgage: 1,253 (164 second mortgage, 140 home equity loan, 0 both second mortgage and home equity loan)
Houses without a mortgage: 610
- Metal and metal products (10%)
- Transportation equipment (10%)
- Agriculture, forestry, fishing and hunting (6%)
- Motor vehicle and parts dealers (6%)
- Construction (5%)
- Public administration (4%)
- Truck transportation (4%)
- Health care (13%)
- Accommodation and food services (10%)
- Transportation equipment (10%)
- Finance and insurance (6%)
- Educational services (6%)
- Metal and metal products (5%)
- Social assistance (4%)
- Other production occupations including supervisors (11%)
- Metal workers and plastic workers (11%)
- Driver/sales workers and truck drivers (8%)
- Electrical equipment mechanics and other installation, maintenance, and repair occupations including supervisors (6%)
- Laborers and material movers, hand (6%)
- Material recording, scheduling, dispatching, and distributing workers (5%)
- Material moving workers except supervisors and laborers and material movers, hand (5%)
- Assemblers and fabricators (10%)
- Other production occupations including supervisors (8%)
- Information and record clerks except customer service representatives (4%)
- Cashiers (4%)
- Health technologists and technicians (4%)
- Nursing, psychiatric, and home health aides (4%)
- Retail sales workers except cashiers (3%)
Most common first ancestries reported in Rutland township:
- United States or American (35.9%)
- German (26.1%)
- English (13.8%)
- Irish (8.2%)
- Scotch-Irish (1.8%)
- French (except Basque) (1.1%)
- Scottish (0.8%)
Most common places of birth for the foreign-born residents:
- Japan (39%)
- Korea (25%)
- Italy (22%)
- Germany (14%)
Means of transportation to work:
- Drove a car alone: 2,958 (79%)
- Carpooled: 492 (13%)
- Bus or trolley bus: 27 (1%)
- Walked: 101 (3%)
- Other means: 27 (1%)
- Worked at home: 152 (4%)
Most commonly used house heating fuel:
- Utility gas (72%)
- Electricity (18%)
- Bottled, tank, or LP gas (6%)
- Fuel oil, kerosene, etc. (2%)
- Wood (1%)
98 people in nursing homes
2 people in religious group quarters
98.8% of residents of Rutland township speak English at home.
0.3% of residents speak Spanish at home (60% speak English very well, 40% speak English well).
0.6% of residents speak other Indo-European language at home (100% speak English very well).
0.3% of residents speak Asian or Pacific Island language at home (30% speak English well, 70% speak English not well).
Household type by relationship:
Households: 8,030- In family households: 6,823 (1,685 male householders, 580 female householders)
1,731 spouses, 2,343 children (2,024 natural, 45 adopted, 274 stepchildren), 124 grandchildren, 74 brothers or sisters, 31 parents, 70 other relatives, 185 non-relatives
- In nonfamily households: 1,207 (414 male householders (318 living alone)), 616 female householders (604 living alone)), 177 nonrelatives
- In group quarters: 282 (268 institutionalized population)
Size of family households: 1,008 2-persons, 500 3-persons, 439 4-persons, 195 5-persons, 115 6-persons, 8 7-or-more-persons,
Size of nonfamily households: 922 1-person, 71 2-persons, 16 3-persons, 21 4-persons,
661 married couples with children.
153 single-parent households (52 men, 101 women).
Private vs. public school enrollment:
Students in private schools in grades 1 to 8 (elementary and middle school): 41
| Here: | 4.4% |
| Illinois: | 13.4% |
Students in private schools in grades 9 to 12 (high school): 32
| Here: | 7.4% |
| Illinois: | 11.1% |
Students in private undergraduate colleges: 16
| Here: | 12.6% |
| Illinois: | 25.8% |