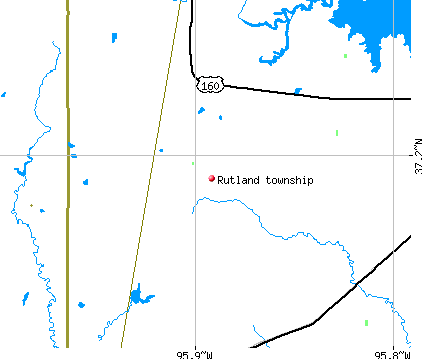
Rutland township, Montgomery County, Kansas (KS) detailed profile
Number of foreign born residents: 2 (100% naturalized citizens)
| Rutland township: | 2.0% |
| Whole state: | 5.0% |
54% of Rutland township residents lived in the same house 5 years ago.
Out of people who lived in different houses, 76% lived in this county.
Out of people who lived in different counties, 35% lived in Kansas.
Place of birth for U.S.-born residents:
- This state: 259
- Northeast: 0
- Midwest: 18
- South: 54
- West: 6
Median price asked for vacant for-sale houses in 2000: $9,999
Percentage of households with unmarried partners: 0.8%
Likely homosexual households (counted as self-reported same-sex unmarried-partner households)
- Lesbian couples: 0.0% of all households
- Gay men: 0.8% of all households

Housing units in structures:
- One, detached: 87
- Mobile homes: 33
Median worth of mobile homes: $21,100
Housing units in Rutland township with a mortgage: 13 (0 second mortgage, 0 home equity loan, 0 both second mortgage and home equity loan)
Houses without a mortgage: 0
- Machinery (16%)
- Agriculture, forestry, fishing and hunting (11%)
- Lumber and other construction materials merchant wholesalers (11%)
- Truck transportation (9%)
- Other transportation, and support activities, and couriers (9%)
- Transportation equipment (8%)
- Motor vehicle and parts dealers (8%)
- Educational services (21%)
- Transportation equipment (15%)
- Mining, quarrying, and oil and gas extraction (12%)
- Social assistance (11%)
- Motor vehicle and parts dealers (8%)
- Public administration (8%)
- Construction (7%)
- Other production occupations including supervisors (20%)
- Electrical equipment mechanics and other installation, maintenance, and repair occupations including supervisors (19%)
- Customer service representatives (12%)
- Farmers and farm managers (11%)
- Engineers (9%)
- Driver/sales workers and truck drivers (9%)
- Law enforcement workers including supervisors (7%)
- Other production occupations including supervisors (14%)
- Social scientists and related workers (12%)
- Secretaries and administrative assistants (12%)
- Child care workers (11%)
- Other management occupations except farmers and farm managers (9%)
- Other financial specialists (8%)
- Financial clerks except bookkeeping, accounting, and auditing clerks (8%)
Most common first ancestries reported in Rutland township:
- United States or American (33.7%)
- Irish (21.5%)
- Italian (8.7%)
- English (5.8%)
- Pennsylvania German (5.8%)
- German (5.2%)
- Scottish (4.1%)
Most common places of birth for the foreign-born residents:
- Other Australian and New Zealand Subregion (100%)
Means of transportation to work:
- Drove a car alone: 117 (69%)
- Carpooled: 44 (26%)
- Worked at home: 9 (5%)
Most commonly used house heating fuel:
- Bottled, tank, or LP gas (91%)
- Utility gas (4%)
- Wood (4%)
All residents speak only English at home
Household type by relationship:
Households: 343- In family households: 325 (113 male householders, 1 female householders)
111 spouses, 90 children (71 natural, 0 adopted, 19 stepchildren), 0 grandchildren, 4 brothers or sisters, 0 parents, 0 other relatives, 6 non-relatives
- In nonfamily households: 18 (5 male householders (5 living alone)), 13 female householders (13 living alone)), 0 nonrelatives
Size of family households: 46 2-persons, 22 3-persons, 37 4-persons, 9 5-persons,
Size of nonfamily households: 18 1-person,
51 married couples with children.
4 single-parent households (1 men, 3 women).
Private vs. public school enrollment:
Students in private schools in grades 1 to 8 (elementary and middle school): 0
| Here: | 0.0% |
| Kansas: | 11.1% |
Students in private schools in grades 9 to 12 (high school): 0
| Here: | 0.0% |
| Kansas: | 7.9% |
Students in private undergraduate colleges: 0
| Here: | 0.0% |
| Kansas: | 13.8% |