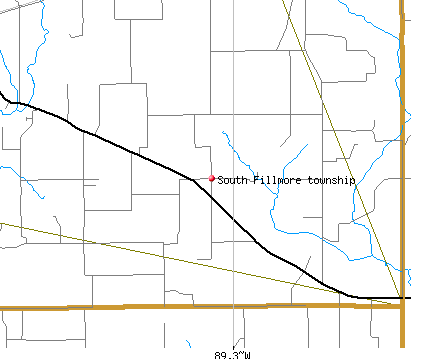
South Fillmore township, Montgomery County, Illinois (IL) detailed profile
Land area: 24.1 sq. mi.
Water area: 0.0 sq. mi.
Population: 246 (all rural)
| Males: 129 | |
| Females: 117 |
Occupied houses/apartments: 246 (220 owner occupied, 26 renter occupied)
| % of renters here: | 11% |
| State: | 33% |
Races in South Fillmore township:
- White Non-Hispanic: 97.2%
- American Indian and Alaska Native: 0.4%
- Two or more races: 2.0%
Median age of males: 39.6
Median age of females: 39.1
Discuss Illinois on our huge forum. We have over 16 million posts!
Average household size: 2.56
| South Fillmore township: | 2.6 people |
| Illinois: | 2.6 people |
Average family size: 3.12
| South Fillmore township: | $44,398 |
| Illinois: | $56,210 |
| Here: | $448 |
| State: | $772 |
Estimated median house or condo value in 2013: $73,962 (it was $55,300 in 2000)
| : | $73,962 |
| Illinois: | $169,600 |
| Population density: 10 people per square mile | (low). |
| This township: | 11.5% |
| Whole state: | 10.7% |
Notable locations in this township outside city limits:
Notable location: Forsee Vineyards (A). Display/hide its location on the map
Churches in South Fillmore township include: East Fork Church (A), Hurricane Church (B). Display/hide their locations on the map
Cemeteries: Walker Cemetery (1), Hurricane Cemetery (2), Renshaw Cemetery (3), Green Hill Cemetery (4), Shiloh Presbyterian Cemetery (5). Display/hide their locations on the map
Creeks: Mud Creek (A), Piatt Creek (B). Display/hide their locations on the map
68% of South Fillmore township residents lived in the same house 5 years ago.
Out of people who lived in different houses, 54% lived in this county.
Out of people who lived in different counties, 100% lived in Illinois.
Place of birth for U.S.-born residents:
- This state: 268
- Northeast: 0
- Midwest: 14
- South: 17
- West: 14
Percentage of households with unmarried partners: 6.3%
No gay or lesbian households reported
Housing units in structures:
- One, detached: 103
- Two: 6
- Mobile homes: 3
Housing units in South Fillmore township with a mortgage: 26 (0 second mortgage, 0 home equity loan, 0 both second mortgage and home equity loan)
Houses without a mortgage: 13
- Plastics and rubber products (29%)
- Public administration (15%)
- Motor vehicle and parts dealers (10%)
- Nonmetallic mineral products (8%)
- Miscellaneous manufacturing (8%)
- Lumber and other construction materials merchant wholesalers (8%)
- Truck transportation (8%)
- Health care (17%)
- Public administration (13%)
- Finance and insurance (10%)
- Metal and metal products (8%)
- Food and beverage stores (8%)
- Plastics and rubber products (7%)
- Nonmetallic mineral products (7%)
- Metal workers and plastic workers (21%)
- Operations specialties managers except financial managers (17%)
- Law enforcement workers including supervisors (15%)
- Driver/sales workers and truck drivers (15%)
- Retail sales workers except cashiers (10%)
- Construction trades workers except carpenters, electricians, painters, plumbers, and construction laborers (8%)
- Other production occupations including supervisors (8%)
- Therapists (13%)
- Other healthcare support occupations (10%)
- Financial clerks except bookkeeping, accounting, and auditing clerks (10%)
- Cashiers (8%)
- Metal workers and plastic workers (8%)
- Law enforcement workers including supervisors (7%)
- Retail sales workers except cashiers (7%)
Most common first ancestries reported in South Fillmore township:
- German (31.2%)
- United States or American (18.2%)
- Irish (11.1%)
- Lithuanian (7.9%)
- English (5.5%)
- Scotch-Irish (3.6%)
- Welsh (3.6%)
Means of transportation to work:
- Drove a car alone: 138 (85%)
- Carpooled: 18 (11%)
- Worked at home: 6 (4%)
Most commonly used house heating fuel:
- Bottled, tank, or LP gas (72%)
- Wood (11%)
- Fuel oil, kerosene, etc. (6%)
- Utility gas (6%)
- Electricity (6%)
95.6% of residents of South Fillmore township speak English at home.
4.4% of residents speak Spanish at home (100% speak English very well).
Household type by relationship:
Households: 313- In family households: 293 (71 male householders, 11 female householders)
70 spouses, 132 children (132 natural, 0 adopted, 0 stepchildren), 4 grandchildren, 5 brothers or sisters, 0 parents, 0 other relatives, 0 non-relatives
- In nonfamily households: 20 (6 male householders (6 living alone)), 14 female householders (14 living alone)), 0 nonrelatives
Size of family households: 14 2-persons, 23 3-persons, 25 4-persons, 20 5-persons,
Size of nonfamily households: 20 1-person,
40 married couples with children.
18 single-parent households (8 men, 10 women).
Private vs. public school enrollment:
Students in private schools in grades 1 to 8 (elementary and middle school): 0
| Here: | 0.0% |
| Illinois: | 13.4% |
Students in private schools in grades 9 to 12 (high school): 0
| Here: | 0.0% |
| Illinois: | 11.1% |
Students in private undergraduate colleges: 0
| Here: | 0.0% |
| Illinois: | 25.8% |