Work and Jobs in Baltic, South Dakota (SD) Detailed Stats
Occupations, Industries, Unemployment, Workers, Commute
Settings
X


Recent posts about work in Baltic, South Dakota on our local forum with over 2,400,000 registered users:
 | Questions about the area surrounding the USPS office at 4801 N 4th (4 replies) |
| Baltic, SD... Your thoughts? (3 replies) |
| Relocating, any nurses around? (8 replies) |
| Looking to relocate to somewhere else in the Midwest: Sioux Falls? (16 replies) |
| Information on Sioux Falls and outlying areas (48 replies) |
| Moving to Sioux Falls???? (81 replies) |
Latest news about work in Baltic, SD collected exclusively by city-data.com from local newspapers, TV, and radio stations
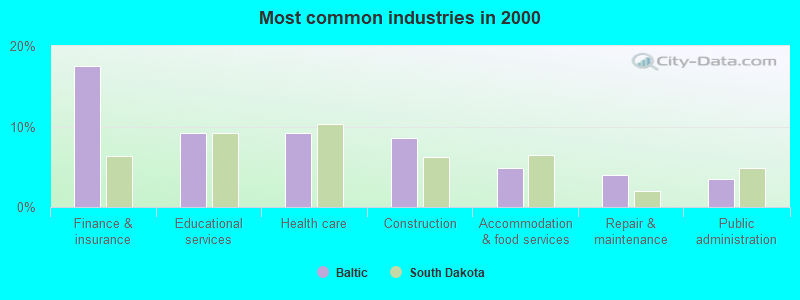
The most common industries in Baltic are: Finance & insurance (17.5% of civilian employees), Educational services (9.2% of civilian employees), Health care (9.2% of civilian employees). 85.8% of workers work in Minnehaha County and 9.5% of all workers work at home. 76.6% of workers are employees of private companies, which is 22.4% greater than the rate of 59.4% across the entire state of South Dakota.
Whole page based on the data from 2000 / 2022 when the population of Baltic, South Dakota was 811 / 1,485
Whole page based on the data from 2000 / 2022 when the population of Baltic, South Dakota was 811 / 1,485
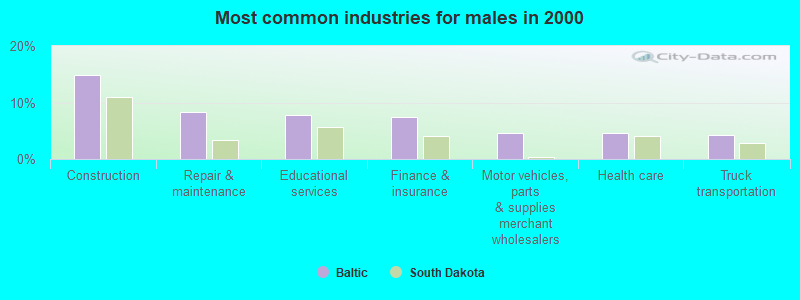
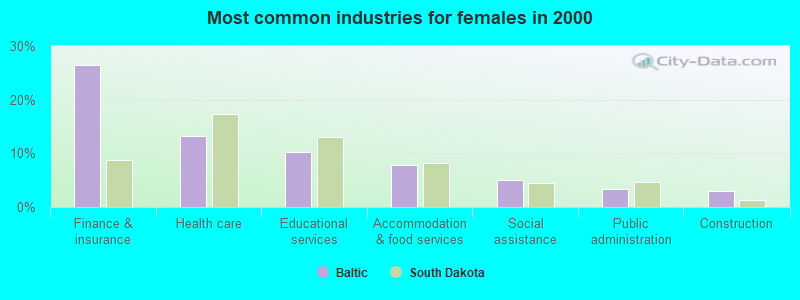
Most common industries
Most common industries | |||
|---|---|---|---|
Industry | All | Males | Females |
| Finance and insurance | 17.5% (80) | 7.4% (16) | 26.4% (64) |
| Educational services | 9.2% (42) | 7.9% (17) | 10.3% (25) |
| Health care | 9.2% (42) | 4.6% (10) | 13.2% (32) |
| Construction | 8.5% (39) | 14.8% (32) | 2.9% (7) |
| Accommodation and food services | 4.8% (22) | 1.4% (3) | 7.9% (19) |
| Repair and maintenance | 3.9% (18) | 8.3% (18) | 0.0% (0) |
| Public administration | 3.5% (16) | 3.7% (8) | 3.3% (8) |
| Social assistance | 2.6% (12) | 0.0% (0) | 5.0% (12) |
| Broadcasting and telecommunications | 2.4% (11) | 3.2% (7) | 1.7% (4) |
| Motor vehicles, parts and supplies merchant wholesalers | 2.2% (10) | 4.6% (10) | 0.0% (0) |
| Religious, grantmaking, civic, professional, and similar organizations | 2.2% (10) | 3.7% (8) | 0.8% (2) |
| Food | 2.0% (9) | 3.2% (7) | 0.8% (2) |
| Truck transportation | 2.0% (9) | 4.2% (9) | 0.0% (0) |
| Computer and electronic products | 2.0% (9) | 1.9% (4) | 2.1% (5) |
| Building material and garden equipment and supplies dealers | 2.0% (9) | 1.4% (3) | 2.5% (6) |
| Miscellaneous manufacturing | 1.3% (6) | 2.8% (6) | 0.0% (0) |
| Used merchandise, gift, novelty, and souvenir, and other miscellaneous stores | 1.3% (6) | 2.3% (5) | 0.4% (1) |
| Administrative and support and waste management services | 1.3% (6) | 1.4% (3) | 1.2% (3) |
| Professional, scientific, and technical services | 1.3% (6) | 0.9% (2) | 1.7% (4) |
| Other transportation, and support activities, and couriers | 1.3% (6) | 2.8% (6) | 0.0% (0) |
| Pharmacies and drug stores | 0.9% (4) | 0.0% (0) | 1.7% (4) |
| Metal and metal products | 0.9% (4) | 0.0% (0) | 1.7% (4) |
| Machinery | 0.9% (4) | 0.0% (0) | 1.7% (4) |
| Electronic shopping and mail-order houses | 0.9% (4) | 0.9% (2) | 0.8% (2) |
| Transportation equipment | 0.9% (4) | 1.9% (4) | 0.0% (0) |
| Real estate and rental and leasing | 0.9% (4) | 0.9% (2) | 0.8% (2) |
| Department and other general merchandise stores | 0.9% (4) | 0.9% (2) | 0.8% (2) |
| Farm product raw materials merchant wholesalers | 0.9% (4) | 1.9% (4) | 0.0% (0) |
| Agriculture, forestry, fishing and hunting | 0.9% (4) | 1.9% (4) | 0.0% (0) |
| Plastics and rubber products | 0.9% (4) | 1.9% (4) | 0.0% (0) |
| Retail florists | 0.7% (3) | 0.0% (0) | 1.2% (3) |
| Furniture and related product manufacturing | 0.7% (3) | 1.4% (3) | 0.0% (0) |
| Sewing, needlework, and piece goods stores | 0.7% (3) | 0.0% (0) | 1.2% (3) |
| Food and beverage stores | 0.7% (3) | 0.0% (0) | 1.2% (3) |
| Arts, entertainment, and recreation | 0.7% (3) | 0.9% (2) | 0.4% (1) |
| Miscellaneous durable goods merchant wholesalers | 0.7% (3) | 1.4% (3) | 0.0% (0) |
| Printing and related support activities | 0.4% (2) | 0.9% (2) | 0.0% (0) |
| Office supplies and stationery stores | 0.4% (2) | 0.0% (0) | 0.8% (2) |
| Radio, TV, and computer stores | 0.4% (2) | 0.0% (0) | 0.8% (2) |
| Nonmetallic mineral products | 0.4% (2) | 0.9% (2) | 0.0% (0) |
| Other direct selling establishments | 0.4% (2) | 0.0% (0) | 0.8% (2) |
| Furniture and home furnishings, and household appliance stores | 0.4% (2) | 0.0% (0) | 0.8% (2) |
| U. S. Postal service | 0.4% (2) | 0.0% (0) | 0.8% (2) |
| Miscellaneous nondurable goods merchant wholesalers | 0.4% (2) | 0.0% (0) | 0.8% (2) |
| Health and personal care, except drug, stores | 0.4% (2) | 0.0% (0) | 0.8% (2) |
| Alcoholic beverages merchant wholesalers | 0.4% (2) | 0.9% (2) | 0.0% (0) |
| Gasoline stations | 0.4% (2) | 0.0% (0) | 0.8% (2) |
| Petroleum and petroleum products merchant wholesalers | 0.4% (2) | 0.9% (2) | 0.0% (0) |
| Groceries and related products merchant wholesalers | 0.4% (2) | 0.0% (0) | 0.8% (2) |
| Machinery, equipment, and supplies merchant wholesalers | 0.4% (2) | 0.9% (2) | 0.0% (0) |
| Paper | 0.2% (1) | 0.5% (1) | 0.0% (0) |
| Drugs, sundries, and chemical and allied products merchant wholesalers | 0.2% (1) | 0.0% (0) | 0.4% (1) |
| Data processing, libraries, and other information services | 0.2% (1) | 0.0% (0) | 0.4% (1) |
| Personal and laundry services | 0.2% (1) | 0.5% (1) | 0.0% (0) |
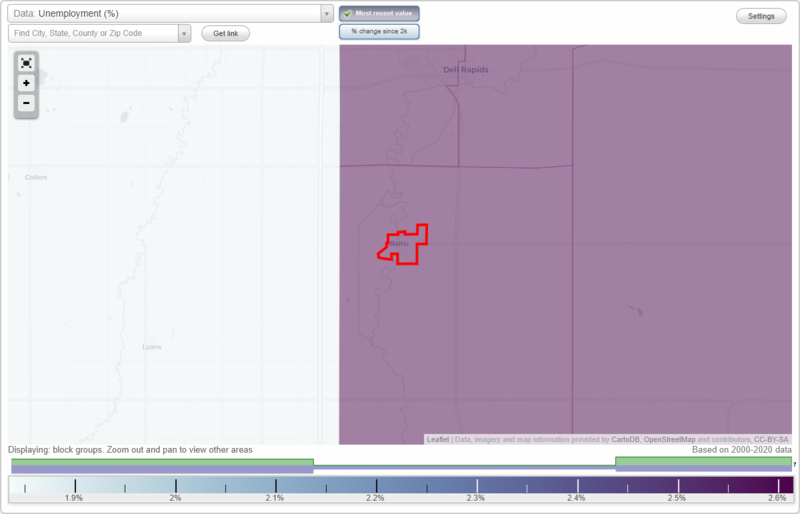
Unemployment in Baltic
- Unemployment by race in 2022
- Unemployment rate for White non-Hispanic residents
- 1.7%Males
- Unemployment by race in 2000
- Unemployment rate for White non-Hispanic residents
- 3.1%Males
- 0.8%Females
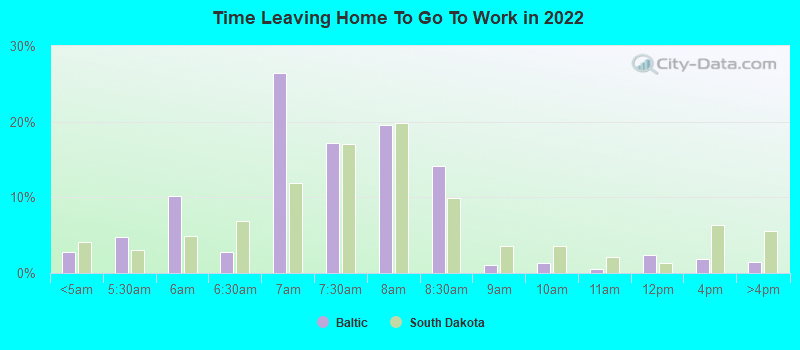
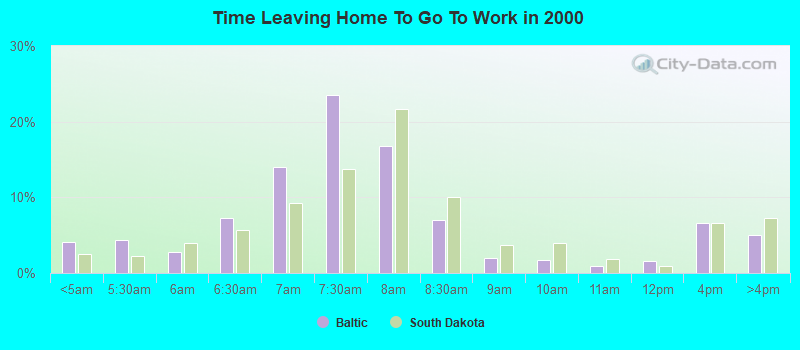
Time leaving home to go to work
12:00 a.m. to 4:59 a.m.:
| Baltic: | 2.8% (20) |
| South Dakota: | 4.1% (17,147) |
5:00 a.m. to 5:29 a.m.:
| Baltic: | 4.7% (33) |
| South Dakota: | 3.0% (12,392) |
5:30 a.m. to 5:59 a.m.:
| Baltic: | 10.2% (72) |
| South Dakota: | 4.8% (19,988) |
6:00 a.m. to 6:29 a.m.:
| Baltic: | 2.8% (20) |
| South Dakota: | 6.9% (28,443) |
6:30 a.m. to 6:59 a.m.:
| Baltic: | 26.5% (186) |
| South Dakota: | 11.9% (49,378) |
7:00 a.m. to 7:29 a.m.:
| Baltic: | 17.2% (121) |
| South Dakota: | 17.1% (70,737) |
7:30 a.m. to 7:59 a.m.:
| Baltic: | 19.5% (137) |
| South Dakota: | 19.8% (81,983) |
8:00 a.m. to 8:29 a.m.:
| Baltic: | 14.1% (99) |
| South Dakota: | 10.0% (41,264) |
8:30 a.m. to 8:59 a.m.:
| Baltic: | 1.1% (8) |
| South Dakota: | 3.5% (14,687) |
9:00 a.m. to 9:59 a.m.:
| Baltic: | 1.3% (9) |
| South Dakota: | 3.6% (14,897) |
10:00 a.m. to 10:59 a.m.:
| Baltic: | 0.6% (4) |
| South Dakota: | 2.1% (8,651) |
11:00 a.m. to 11:59 a.m.:
| Baltic: | 2.4% (17) |
| South Dakota: | 1.3% (5,370) |
12:00 p.m. to 3:59 p.m.:
| Baltic: | 1.8% (13) |
| South Dakota: | 6.3% (26,276) |
4:00 p.m. to 11:59 p.m.:
| Baltic: | 1.4% (10) |
| South Dakota: | 5.6% (23,036) |
<5am:
| Baltic: | 4.1% (19) |
| South Dakota: | 2.6% (9,542) |
5:30am:
| Baltic: | 4.4% (20) |
| South Dakota: | 2.2% (8,298) |
6am:
| Baltic: | 2.8% (13) |
| South Dakota: | 4.0% (14,879) |
6:30am:
| Baltic: | 7.2% (33) |
| South Dakota: | 5.7% (21,058) |
7am:
| Baltic: | 14.0% (64) |
| South Dakota: | 9.3% (34,473) |
7:30am:
| Baltic: | 23.6% (108) |
| South Dakota: | 13.7% (50,997) |
8am:
| Baltic: | 16.8% (77) |
| South Dakota: | 21.7% (80,886) |
8:30am:
| Baltic: | 7.0% (32) |
| South Dakota: | 10.1% (37,691) |
9am:
| Baltic: | 2.0% (9) |
| South Dakota: | 3.7% (13,935) |
10am:
| Baltic: | 1.7% (8) |
| South Dakota: | 3.9% (14,661) |
11am:
| Baltic: | 0.9% (4) |
| South Dakota: | 1.8% (6,829) |
12pm:
| Baltic: | 1.5% (7) |
| South Dakota: | 1.0% (3,670) |
4pm:
| Baltic: | 6.6% (30) |
| South Dakota: | 6.6% (24,424) |
>4pm:
| Baltic: | 5.0% (23) |
| South Dakota: | 7.3% (27,149) |
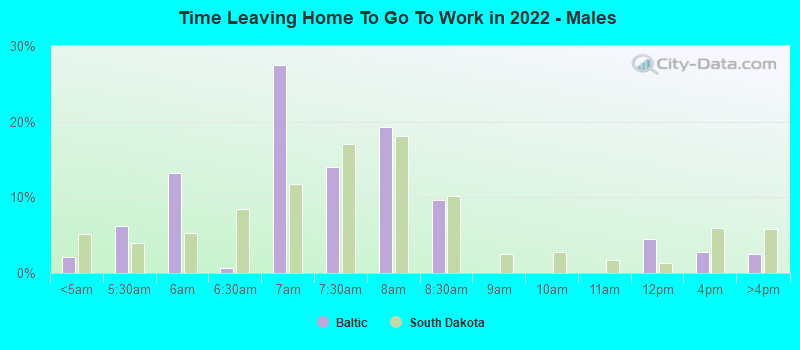
12:00 a.m. to 4:59 a.m. - Males:
| Baltic: | 2.2% (9) |
| South Dakota: | 5.2% (11,581) |
5:00 a.m. to 5:29 a.m. - Males:
| Baltic: | 6.2% (26) |
| South Dakota: | 3.9% (8,809) |
5:30 a.m. to 5:59 a.m. - Males:
| Baltic: | 13.2% (56) |
| South Dakota: | 5.3% (11,867) |
6:00 a.m. to 6:29 a.m. - Males:
| Baltic: | 0.6% (3) |
| South Dakota: | 8.4% (18,875) |
6:30 a.m. to 6:59 a.m. - Males:
| Baltic: | 27.5% (117) |
| South Dakota: | 11.7% (26,205) |
7:00 a.m. to 7:29 a.m. - Males:
| Baltic: | 14.0% (59) |
| South Dakota: | 17.1% (38,288) |
7:30 a.m. to 7:59 a.m. - Males:
| Baltic: | 19.3% (82) |
| South Dakota: | 18.2% (40,708) |
8:00 a.m. to 8:29 a.m. - Males:
| Baltic: | 9.6% (41) |
| South Dakota: | 10.2% (22,758) |
11:00 a.m. to 11:59 a.m. - Males:
| Baltic: | 4.5% (19) |
| South Dakota: | 1.3% (3,014) |
12:00 p.m. to 3:59 p.m. - Males:
| Baltic: | 2.7% (12) |
| South Dakota: | 6.0% (13,452) |
4:00 p.m. to 11:59 p.m. - Males:
| Baltic: | 2.6% (11) |
| South Dakota: | 5.8% (12,957) |
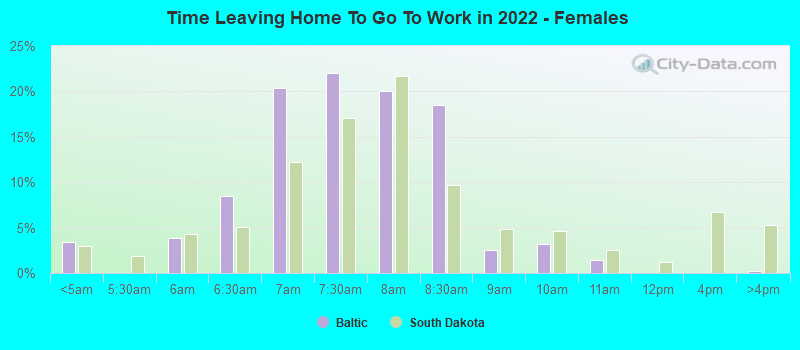
12:00 a.m. to 4:59 a.m. - Females:
| Baltic: | 3.4% (9) |
| South Dakota: | 2.9% (5,566) |
5:30 a.m. to 5:59 a.m. - Females:
| Baltic: | 3.9% (11) |
| South Dakota: | 4.3% (8,121) |
6:00 a.m. to 6:29 a.m. - Females:
| Baltic: | 8.5% (24) |
| South Dakota: | 5.0% (9,568) |
6:30 a.m. to 6:59 a.m. - Females:
| Baltic: | 20.4% (57) |
| South Dakota: | 12.2% (23,173) |
7:00 a.m. to 7:29 a.m. - Females:
| Baltic: | 22.1% (62) |
| South Dakota: | 17.1% (32,449) |
7:30 a.m. to 7:59 a.m. - Females:
| Baltic: | 20.0% (56) |
| South Dakota: | 21.7% (41,275) |
8:00 a.m. to 8:29 a.m. - Females:
| Baltic: | 18.5% (52) |
| South Dakota: | 9.7% (18,506) |
8:30 a.m. to 8:59 a.m. - Females:
| Baltic: | 2.6% (7) |
| South Dakota: | 4.8% (9,131) |
9:00 a.m. to 9:59 a.m. - Females:
| Baltic: | 3.2% (9) |
| South Dakota: | 4.6% (8,773) |
10:00 a.m. to 10:59 a.m. - Females:
| Baltic: | 1.5% (4) |
| South Dakota: | 2.6% (4,866) |
4:00 p.m. to 11:59 p.m. - Females:
| Baltic: | 0.2% (1) |
| South Dakota: | 5.3% (10,079) |
Travel time to work
Percentage of workers working in this county: 85.8%
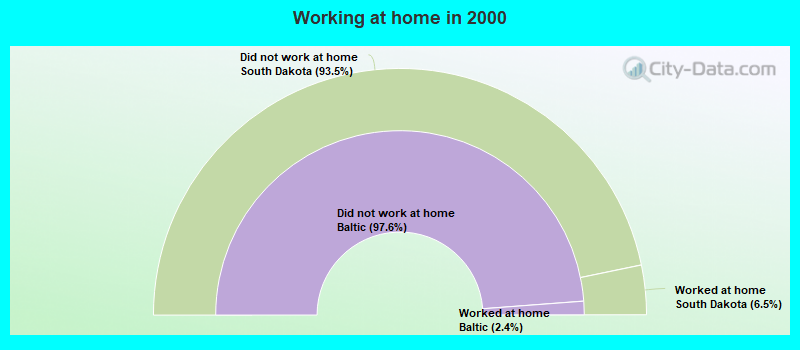
Number of people working at home: 76 (9.5% of all workers)
Number of people working at home: 76 (9.5% of all workers)
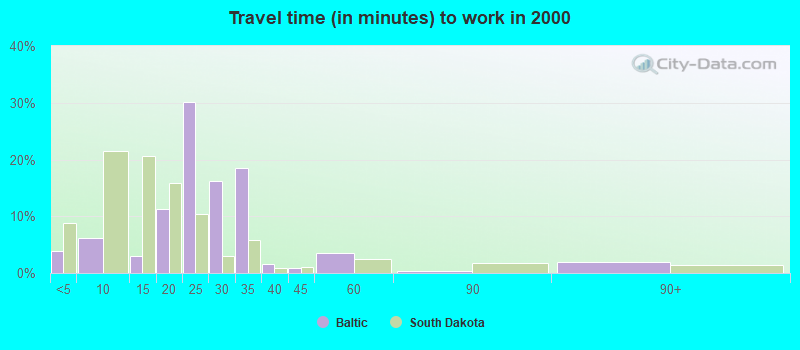
Less than 5 minutes:
| Baltic: | 3.9% (18) |
| South Dakota: | 8.7% (32,545) |
5 to 9 minutes:
| Baltic: | 6.1% (28) |
| South Dakota: | 21.6% (80,314) |
10 to 14 minutes:
| Baltic: | 3.1% (14) |
| South Dakota: | 20.5% (76,533) |
15 to 19 minutes:
| Baltic: | 11.4% (52) |
| South Dakota: | 15.9% (59,230) |
20 to 24 minutes:
| Baltic: | 30.1% (138) |
| South Dakota: | 10.4% (38,623) |
25 to 29 minutes:
| Baltic: | 16.2% (74) |
| South Dakota: | 3.0% (11,090) |
30 to 34 minutes:
| Baltic: | 18.6% (85) |
| South Dakota: | 5.8% (21,530) |
35 to 39 minutes:
| Baltic: | 1.5% (7) |
| South Dakota: | 0.9% (3,406) |
40 to 44 minutes:
| Baltic: | 0.9% (4) |
| South Dakota: | 1.1% (4,106) |
45 to 59 minutes:
| Baltic: | 3.5% (16) |
| South Dakota: | 2.5% (9,300) |
60 to 89 minutes:
| Baltic: | 0.4% (2) |
| South Dakota: | 1.8% (6,566) |
90 or more minutes:
| Baltic: | 2.0% (9) |
| South Dakota: | 1.4% (5,249) |
Means of transportation to work
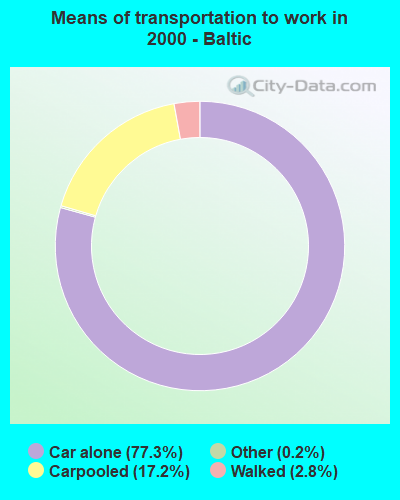
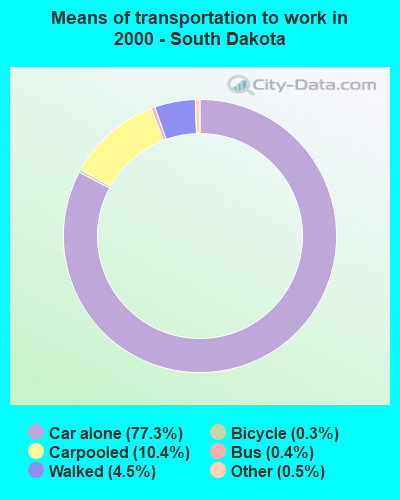
Drove car alone:
| Baltic: | 77.3% (354) |
| South Dakota: | 77.3% (288,227) |
Carpooled:
| Baltic: | 17.2% (79) |
| South Dakota: | 10.4% (38,805) |
Walked:
| Baltic: | 2.8% (13) |
| South Dakota: | 4.5% (16,786) |
Other means:
| Baltic: | 0.2% (1) |
| South Dakota: | 0.5% (1,830) |
Private vehicle occupancy
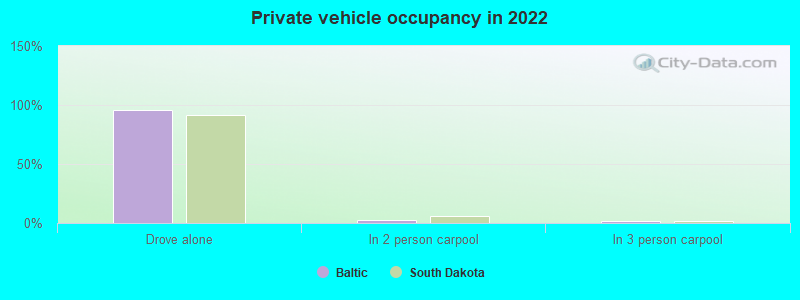
Drove alone:
| Baltic: | 95.6% (650) |
| South Dakota: | 91.7% (361,111) |
In 2 person carpool:
| Baltic: | 2.6% (18) |
| South Dakota: | 5.7% (22,529) |
In 3 person carpool:
| Baltic: | 1.3% (9) |
| South Dakota: | 1.6% (6,344) |
In 4 person carpool:
| Baltic: | 0.5% (3) |
| South Dakota: | 0.8% (2,997) |
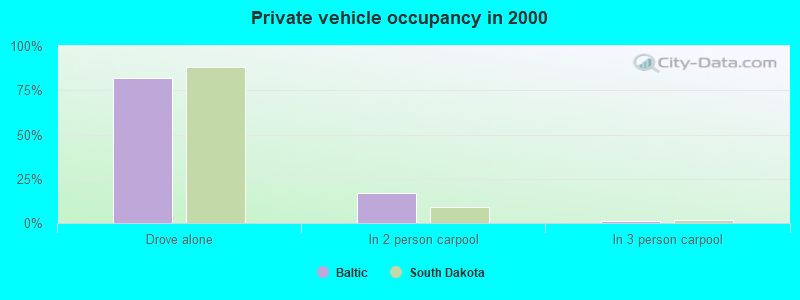
Drove alone:
| Baltic: | 81.8% (354) |
| South Dakota: | 88.1% (288,227) |
In 2 person carpool:
| Baltic: | 16.9% (73) |
| South Dakota: | 9.3% (30,269) |
In 3 person carpool:
| Baltic: | 1.4% (6) |
| South Dakota: | 1.6% (5,220) |
Class of workers
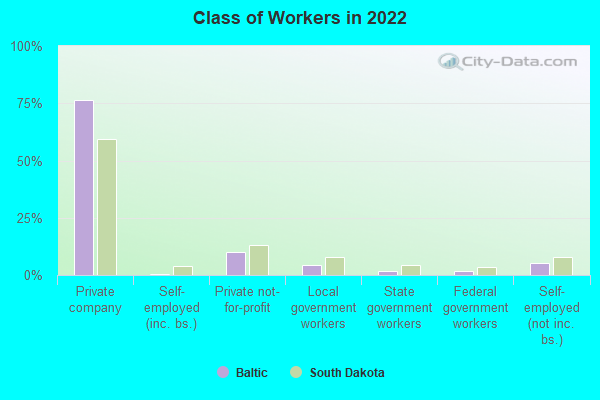
Employee of private company:
| Baltic: | 76.6% (625) |
| South Dakota: | 59.4% (273,962) |
Self-employed in own incorporated business:
| Baltic: | 0.4% (3) |
| South Dakota: | 4.0% (18,550) |
Private not-for-profit wage and salary workers:
| Baltic: | 10.2% (83) |
| South Dakota: | 13.0% (59,994) |
Local government workers:
| Baltic: | 4.3% (35) |
| South Dakota: | 7.8% (35,824) |
State government workers:
| Baltic: | 1.7% (14) |
| South Dakota: | 4.2% (19,563) |
Federal government workers:
| Baltic: | 1.6% (13) |
| South Dakota: | 3.5% (16,240) |
Self-employed workers in own not incorporated business:
| Baltic: | 5.3% (43) |
| South Dakota: | 7.8% (35,785) |
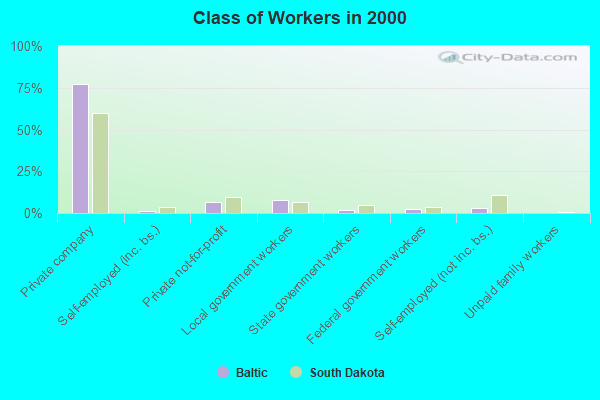
Employee of private company:
| Baltic: | 77.1% (353) |
| South Dakota: | 59.7% (223,625) |
Self-employed in own incorporated business:
| Baltic: | 1.3% (6) |
| South Dakota: | 3.6% (13,641) |
Private not-for-profit wage and salary workers:
| Baltic: | 6.3% (29) |
| South Dakota: | 9.5% (35,617) |
Local government workers:
| Baltic: | 8.1% (37) |
| South Dakota: | 6.8% (25,501) |
State government workers:
| Baltic: | 1.5% (7) |
| South Dakota: | 4.7% (17,748) |
Federal government workers:
| Baltic: | 2.4% (11) |
| South Dakota: | 3.7% (13,895) |
Self-employed workers in own not incorporated business:
| Baltic: | 3.3% (15) |
| South Dakota: | 11.0% (41,320) |
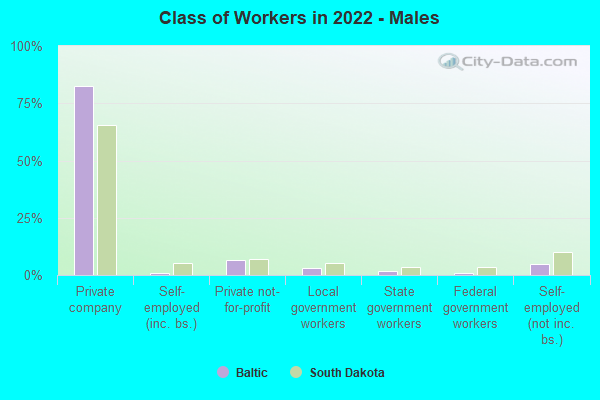
Employee of private company - Males:
| Baltic: | 82.6% (381) |
| South Dakota: | 65.4% (159,555) |
Self-employed in own incorporated business - Males:
| Baltic: | 0.7% (3) |
| South Dakota: | 5.2% (12,573) |
Private not-for-profit wage and salary workers - Males:
| Baltic: | 6.4% (30) |
| South Dakota: | 7.2% (17,479) |
Local government workers - Males:
| Baltic: | 3.0% (14) |
| South Dakota: | 5.2% (12,624) |
State government workers - Males:
| Baltic: | 1.8% (8) |
| South Dakota: | 3.5% (8,572) |
Federal government workers - Males:
| Baltic: | 0.7% (3) |
| South Dakota: | 3.5% (8,638) |
Self-employed workers in own not incorporated business - Males:
| Baltic: | 4.8% (22) |
| South Dakota: | 9.9% (24,290) |
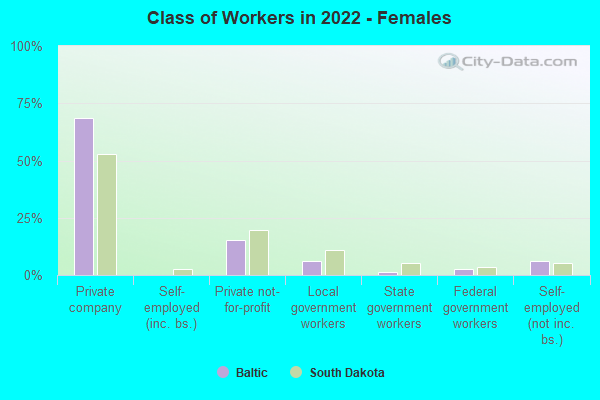
Employee of private company - Females:
| Baltic: | 68.8% (244) |
| South Dakota: | 52.8% (114,407) |
Private not-for-profit wage and salary workers - Females:
| Baltic: | 15.2% (54) |
| South Dakota: | 19.6% (42,515) |
Local government workers - Females:
| Baltic: | 6.0% (21) |
| South Dakota: | 10.7% (23,200) |
State government workers - Females:
| Baltic: | 1.5% (5) |
| South Dakota: | 5.1% (10,991) |
Federal government workers - Females:
| Baltic: | 2.7% (10) |
| South Dakota: | 3.5% (7,602) |
Self-employed workers in own not incorporated business - Females:
| Baltic: | 6.0% (21) |
| South Dakota: | 5.3% (11,495) |