Work and Jobs in Borrego Springs, California (CA) Detailed Stats
Occupations, Industries, Unemployment, Workers, Commute
Settings
X


Recent posts about work in Borrego Springs, California on our local forum with over 2,400,000 registered users:

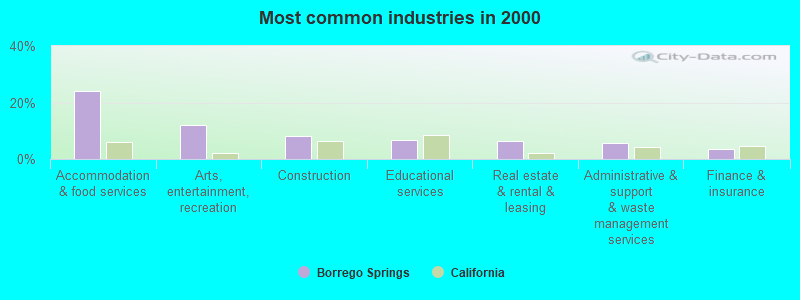
The most common industries in Borrego Springs are: Accommodation & food services (23.9% of civilian employees), Arts, entertainment, recreation (12.2% of civilian employees), Construction (8.2% of civilian employees). 94.0% of workers work in San Diego County and 27.9% of all workers work at home. 70.6% of workers are employees of private companies, which is 5.8% greater than the rate of 66.5% across the entire state of California.
Whole page based on the data from 2000 / 2022 when the population of Borrego Springs, California was 2,535 / 2,934
Whole page based on the data from 2000 / 2022 when the population of Borrego Springs, California was 2,535 / 2,934
Most common industries
Most common industries | |||
|---|---|---|---|
Industry | All | Males | Females |
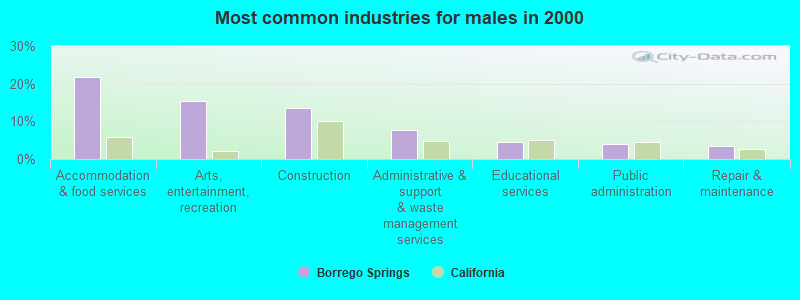
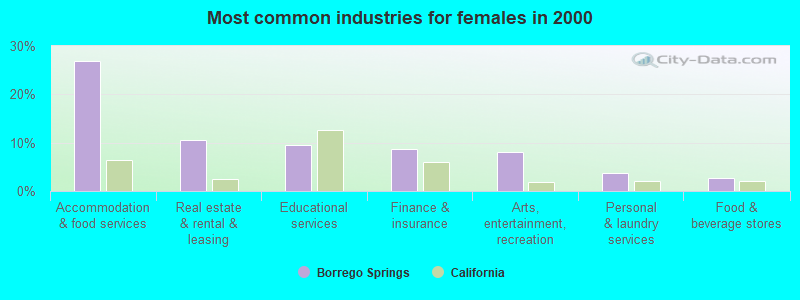
| Accommodation and food services | 23.9% (269) | 21.8% (141) | 26.8% (128) |
| Arts, entertainment, and recreation | 12.2% (137) | 15.3% (99) | 8.0% (38) |
| Construction | 8.2% (92) | 13.4% (87) | 1.0% (5) |
| Educational services | 6.7% (75) | 4.6% (30) | 9.4% (45) |
| Real estate and rental and leasing | 6.2% (70) | 3.1% (20) | 10.5% (50) |
| Administrative and support and waste management services | 5.6% (63) | 7.7% (50) | 2.7% (13) |
| Finance and insurance | 3.6% (41) | 0.0% (0) | 8.6% (41) |
| Public administration | 2.9% (33) | 3.9% (25) | 1.7% (8) |
| Repair and maintenance | 2.0% (23) | 3.5% (23) | 0.0% (0) |
| Food and beverage stores | 2.0% (22) | 1.4% (9) | 2.7% (13) |
| Personal and laundry services | 2.0% (22) | 0.6% (4) | 3.8% (18) |
| Building material and garden equipment and supplies dealers | 1.9% (21) | 2.2% (14) | 1.5% (7) |
| Health care | 1.7% (19) | 1.9% (12) | 1.5% (7) |
| Other transportation, and support activities, and couriers | 1.6% (18) | 2.8% (18) | 0.0% (0) |
| Religious, grantmaking, civic, professional, and similar organizations | 1.5% (17) | 0.6% (4) | 2.7% (13) |
| Motor vehicle and parts dealers | 1.4% (16) | 2.5% (16) | 0.0% (0) |
| Miscellaneous nondurable goods merchant wholesalers | 1.2% (13) | 2.0% (13) | 0.0% (0) |
| Professional, scientific, and technical services | 1.2% (13) | 0.6% (4) | 1.9% (9) |
| Agriculture, forestry, fishing and hunting | 1.1% (12) | 1.9% (12) | 0.0% (0) |
| Publishing, and motion picture and sound recording industries | 1.1% (12) | 0.0% (0) | 2.5% (12) |
| Electronic shopping and mail-order houses | 1.0% (11) | 0.6% (4) | 1.5% (7) |
| Broadcasting and telecommunications | 0.8% (9) | 0.0% (0) | 1.9% (9) |
| Food | 0.8% (9) | 0.8% (5) | 0.8% (4) |
| Truck transportation | 0.8% (9) | 0.8% (5) | 0.8% (4) |
| Sporting goods, camera, and hobby and toy stores | 0.8% (9) | 0.6% (4) | 1.0% (5) |
| Jewelry, luggage, and leather goods stores | 0.8% (9) | 0.6% (4) | 1.0% (5) |
| Nonmetallic mineral products | 0.8% (9) | 0.6% (4) | 1.0% (5) |
| Utilities | 0.7% (8) | 0.8% (5) | 0.6% (3) |
| Used merchandise, gift, novelty, and souvenir, and other miscellaneous stores | 0.7% (8) | 0.6% (4) | 0.8% (4) |
| Clothing and accessories, including shoe, stores | 0.7% (8) | 0.0% (0) | 1.7% (8) |
| Mining, quarrying, and oil and gas extraction | 0.4% (5) | 0.8% (5) | 0.0% (0) |
| Department and other general merchandise stores | 0.4% (5) | 0.0% (0) | 1.0% (5) |
| Metal and metal products | 0.4% (5) | 0.8% (5) | 0.0% (0) |
| Alcoholic beverages merchant wholesalers | 0.4% (4) | 0.6% (4) | 0.0% (0) |
| Book stores and news dealers | 0.4% (4) | 0.0% (0) | 0.8% (4) |
| Other direct selling establishments | 0.4% (4) | 0.6% (4) | 0.0% (0) |
| Data processing, libraries, and other information services | 0.4% (4) | 0.6% (4) | 0.0% (0) |
| Social assistance | 0.4% (4) | 0.0% (0) | 0.8% (4) |
| Professional and commercial equipment and supplies merchant wholesalers | 0.4% (4) | 0.6% (4) | 0.0% (0) |
| Transportation equipment | 0.4% (4) | 0.6% (4) | 0.0% (0) |
| U. S. Postal service | 0.3% (3) | 0.0% (0) | 0.6% (3) |
| Gasoline stations | 0.2% (2) | 0.3% (2) | 0.0% (0) |
Unemployment in Borrego Springs
- Unemployment by race in 2022
- Unemployment rate for two or more race residents
- 18.8%Males
- Unemployment rate for Hispanic or Latino residents
- 14.8%Males
- Unemployment by race in 2000
- Unemployment rate for White non-Hispanic residents
- 4.5%Males
- Unemployment rate for other race residents
- 9.1%Males
- 18.6%Females
- Unemployment rate for Hispanic or Latino residents
- 3.9%Males
- 12.7%Females
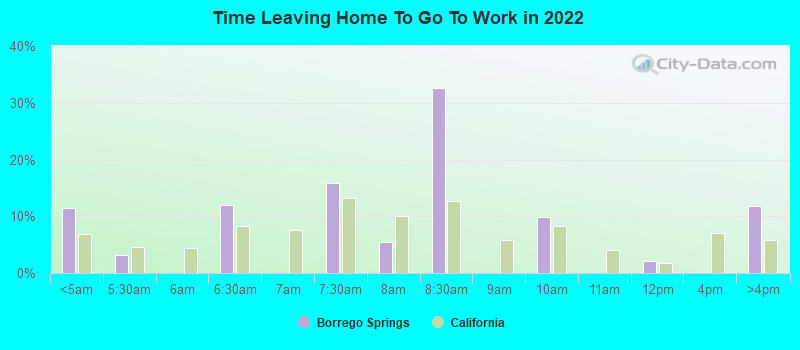
Time leaving home to go to work
12:00 a.m. to 4:59 a.m.:
| Borrego Springs: | 11.4% (92) |
| California: | 6.8% (1,050,902) |
5:00 a.m. to 5:29 a.m.:
| Borrego Springs: | 3.1% (25) |
| California: | 4.5% (692,772) |
6:00 a.m. to 6:29 a.m.:
| Borrego Springs: | 12.1% (97) |
| California: | 8.3% (1,273,588) |
7:00 a.m. to 7:29 a.m.:
| Borrego Springs: | 15.9% (128) |
| California: | 13.2% (2,027,702) |
7:30 a.m. to 7:59 a.m.:
| Borrego Springs: | 5.5% (45) |
| California: | 10.1% (1,550,402) |
8:00 a.m. to 8:29 a.m.:
| Borrego Springs: | 32.5% (263) |
| California: | 12.7% (1,953,986) |
9:00 a.m. to 9:59 a.m.:
| Borrego Springs: | 9.8% (79) |
| California: | 8.4% (1,288,499) |
11:00 a.m. to 11:59 a.m.:
| Borrego Springs: | 2.1% (17) |
| California: | 1.8% (280,975) |
4:00 p.m. to 11:59 p.m.:
| Borrego Springs: | 11.8% (96) |
| California: | 5.8% (891,240) |
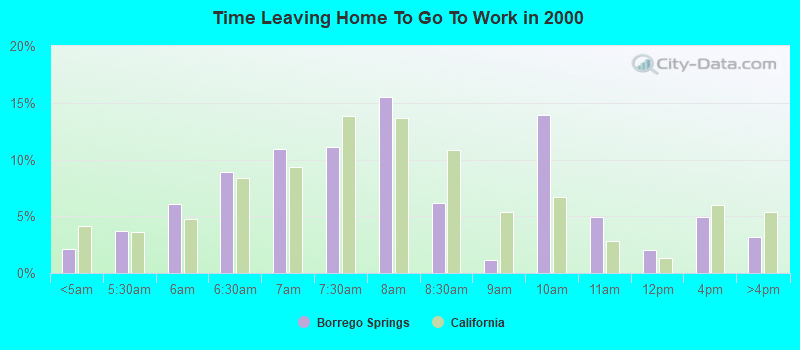
<5am:
| Borrego Springs: | 2.1% (23) |
| California: | 4.2% (606,086) |
5:30am:
| Borrego Springs: | 3.7% (40) |
| California: | 3.6% (523,209) |
6am:
| Borrego Springs: | 6.1% (66) |
| California: | 4.8% (692,256) |
6:30am:
| Borrego Springs: | 8.9% (97) |
| California: | 8.4% (1,216,867) |
7am:
| Borrego Springs: | 11.0% (119) |
| California: | 9.4% (1,362,830) |
7:30am:
| Borrego Springs: | 11.1% (120) |
| California: | 13.8% (2,006,950) |
8am:
| Borrego Springs: | 15.5% (168) |
| California: | 13.7% (1,986,831) |
8:30am:
| Borrego Springs: | 6.2% (67) |
| California: | 10.9% (1,577,815) |
9am:
| Borrego Springs: | 1.1% (12) |
| California: | 5.4% (778,152) |
10am:
| Borrego Springs: | 13.9% (151) |
| California: | 6.7% (972,355) |
11am:
| Borrego Springs: | 5.0% (54) |
| California: | 2.9% (414,479) |
12pm:
| Borrego Springs: | 2.0% (22) |
| California: | 1.3% (189,005) |
4pm:
| Borrego Springs: | 5.0% (54) |
| California: | 6.0% (865,284) |
>4pm:
| Borrego Springs: | 3.1% (34) |
| California: | 5.3% (776,167) |
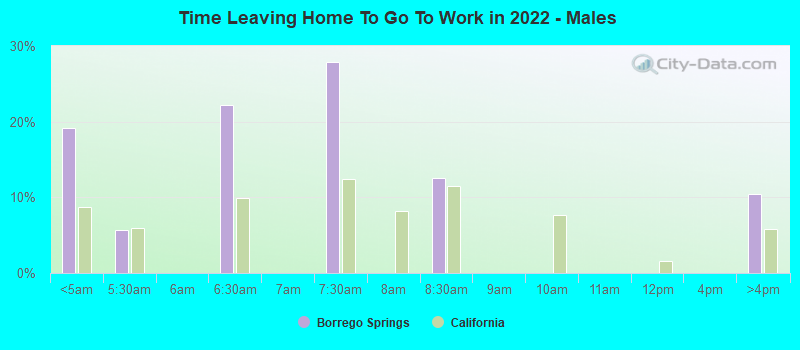
12:00 a.m. to 4:59 a.m. - Males:
| Borrego Springs: | 19.2% (87) |
| California: | 8.7% (747,612) |
5:00 a.m. to 5:29 a.m. - Males:
| Borrego Springs: | 5.7% (26) |
| California: | 6.0% (509,420) |
6:00 a.m. to 6:29 a.m. - Males:
| Borrego Springs: | 22.2% (101) |
| California: | 9.8% (842,941) |
7:00 a.m. to 7:29 a.m. - Males:
| Borrego Springs: | 27.9% (127) |
| California: | 12.4% (1,058,532) |
8:00 a.m. to 8:29 a.m. - Males:
| Borrego Springs: | 12.6% (57) |
| California: | 11.5% (984,538) |
4:00 p.m. to 11:59 p.m. - Males:
| Borrego Springs: | 10.4% (47) |
| California: | 5.8% (499,471) |
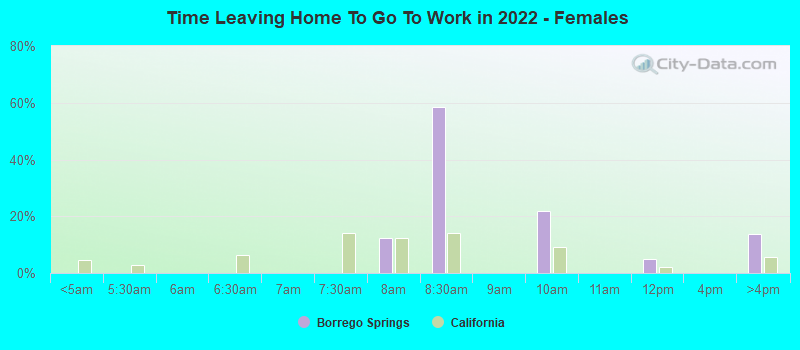
7:30 a.m. to 7:59 a.m. - Females:
| Borrego Springs: | 12.2% (43) |
| California: | 12.4% (847,675) |
8:00 a.m. to 8:29 a.m. - Females:
| Borrego Springs: | 58.6% (207) |
| California: | 14.1% (969,448) |
9:00 a.m. to 9:59 a.m. - Females:
| Borrego Springs: | 21.9% (77) |
| California: | 9.2% (633,461) |
11:00 a.m. to 11:59 a.m. - Females:
| Borrego Springs: | 4.8% (17) |
| California: | 2.0% (139,355) |
4:00 p.m. to 11:59 p.m. - Females:
| Borrego Springs: | 13.7% (48) |
| California: | 5.7% (391,769) |
Travel time to work
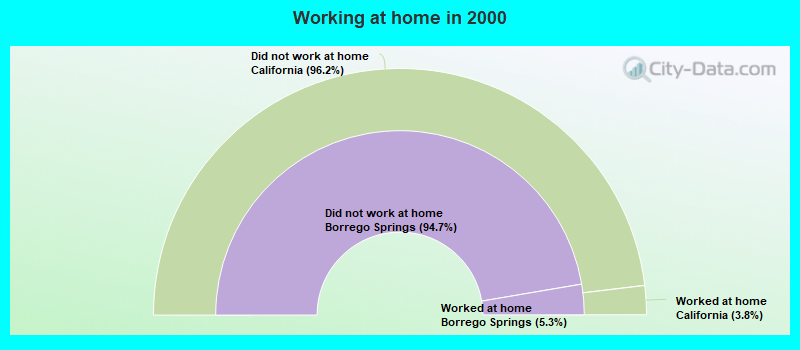
Percentage of workers working in this county: 94.0%
Number of people working at home: 327 (27.9% of all workers)
Number of people working at home: 327 (27.9% of all workers)
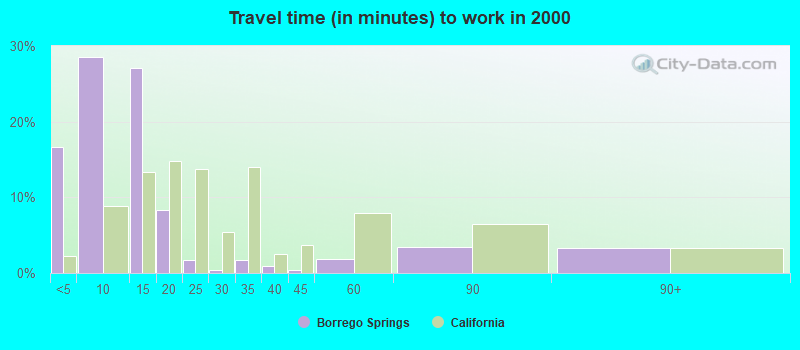
Less than 5 minutes:
| Borrego Springs: | 16.7% (181) |
| California: | 2.2% (324,703) |
5 to 9 minutes:
| Borrego Springs: | 28.6% (310) |
| California: | 8.8% (1,280,443) |
10 to 14 minutes:
| Borrego Springs: | 27.1% (294) |
| California: | 13.3% (1,930,263) |
15 to 19 minutes:
| Borrego Springs: | 8.4% (91) |
| California: | 14.9% (2,157,970) |
20 to 24 minutes:
| Borrego Springs: | 1.7% (18) |
| California: | 13.8% (2,004,060) |
25 to 29 minutes:
| Borrego Springs: | 0.5% (5) |
| California: | 5.4% (782,241) |
30 to 34 minutes:
| Borrego Springs: | 1.8% (19) |
| California: | 13.9% (2,025,657) |
35 to 39 minutes:
| Borrego Springs: | 0.9% (10) |
| California: | 2.5% (366,487) |
40 to 44 minutes:
| Borrego Springs: | 0.5% (5) |
| California: | 3.6% (528,043) |
45 to 59 minutes:
| Borrego Springs: | 1.8% (20) |
| California: | 7.9% (1,151,598) |
60 to 89 minutes:
| Borrego Springs: | 3.5% (38) |
| California: | 6.4% (933,123) |
90 or more minutes:
| Borrego Springs: | 3.3% (36) |
| California: | 3.3% (483,698) |
Means of transportation to work
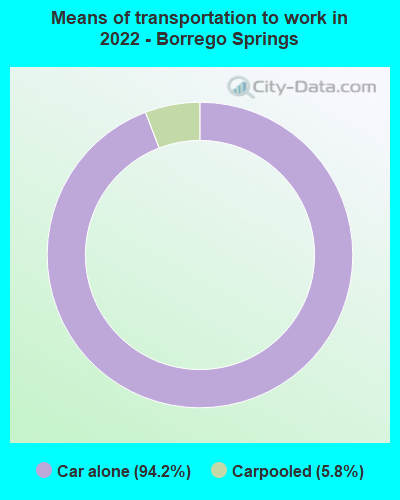

Drove car alone:
| Borrego Springs: | 94.2% (855) |
| California: | 79.1% (5,345,368) |
Carpooled:
| Borrego Springs: | 5.8% (53) |
| California: | 11.9% (878,699) |
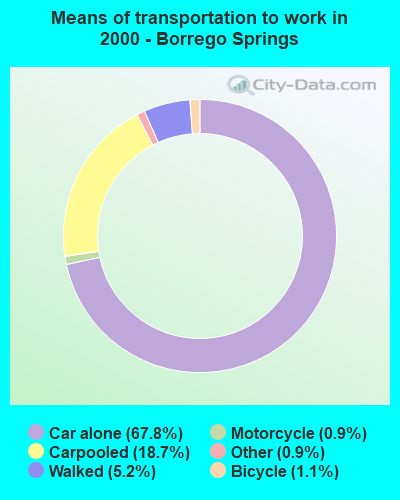

Drove car alone:
| Borrego Springs: | 67.8% (736) |
| California: | 71.8% (10,432,462) |
Carpooled:
| Borrego Springs: | 18.7% (203) |
| California: | 14.5% (2,113,313) |
Motorcycle:
| Borrego Springs: | 0.9% (10) |
| California: | 0.2% (36,262) |
Bicycle:
| Borrego Springs: | 1.1% (12) |
| California: | 0.8% (120,567) |
Walked:
| Borrego Springs: | 5.2% (56) |
| California: | 2.9% (414,581) |
Other means:
| Borrego Springs: | 0.9% (10) |
| California: | 0.8% (115,064) |
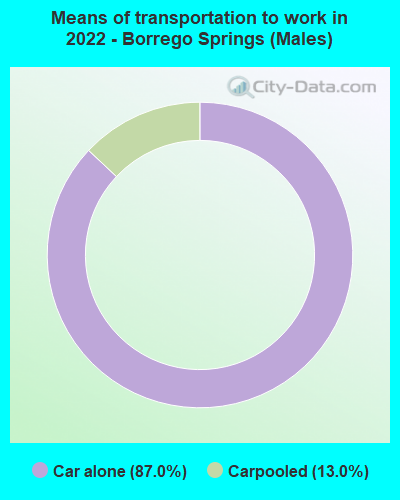

Drove car alone - Males:
| Borrego Springs: | 87.0% (349) |
| California: | 80.0% (5,345,368) |
Carpooled - Males:
| Borrego Springs: | 13.0% (52) |
| California: | 11.1% (878,699) |

Drove car alone - Females:
| Borrego Springs: | 100.0% (510) |
| California: | 77.9% (5,345,368) |
Private vehicle occupancy
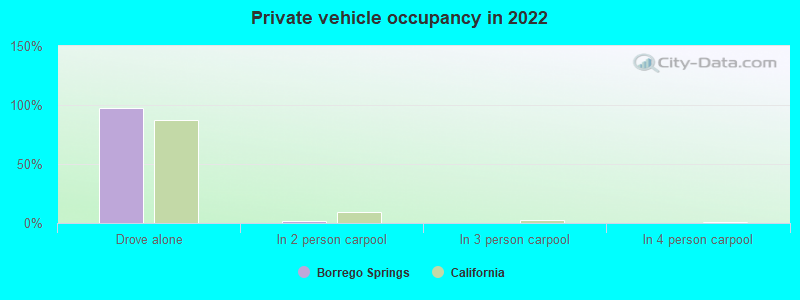
Drove alone:
| Borrego Springs: | 97.4% (786) |
| California: | 86.9% (12,187,486) |
In 2 person carpool:
| Borrego Springs: | 2.0% (16) |
| California: | 9.2% (1,295,561) |
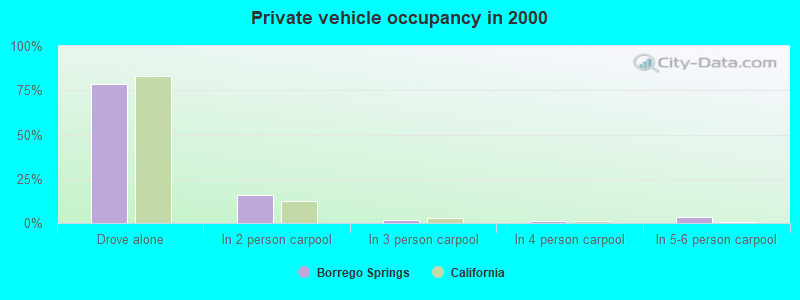
Drove alone:
| Borrego Springs: | 78.4% (736) |
| California: | 83.2% (10,432,462) |
In 2 person carpool:
| Borrego Springs: | 15.7% (147) |
| California: | 12.5% (1,564,905) |
In 3 person carpool:
| Borrego Springs: | 1.8% (17) |
| California: | 2.6% (330,732) |
In 4 person carpool:
| Borrego Springs: | 0.9% (8) |
| California: | 1.0% (119,364) |
In 5-6 person carpool:
| Borrego Springs: | 3.3% (31) |
| California: | 0.5% (57,036) |
Class of workers
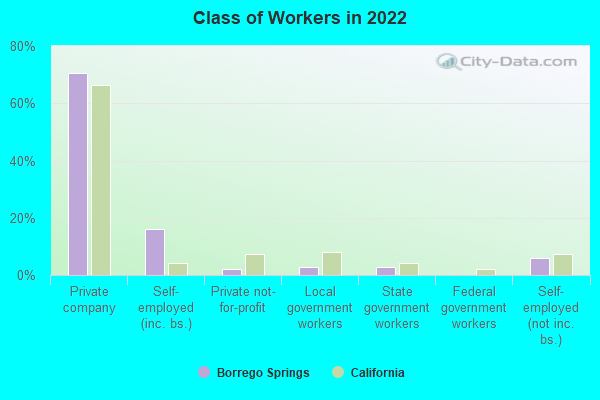
Employee of private company:
| Borrego Springs: | 70.6% (855) |
| California: | 66.5% (12,596,030) |
Self-employed in own incorporated business:
| Borrego Springs: | 16.1% (195) |
| California: | 4.1% (784,709) |
Private not-for-profit wage and salary workers:
| Borrego Springs: | 1.9% (23) |
| California: | 7.5% (1,417,407) |
Local government workers:
| Borrego Springs: | 2.8% (34) |
| California: | 8.2% (1,547,056) |
State government workers:
| Borrego Springs: | 2.7% (33) |
| California: | 4.1% (780,915) |
Self-employed workers in own not incorporated business:
| Borrego Springs: | 5.9% (71) |
| California: | 7.4% (1,410,735) |
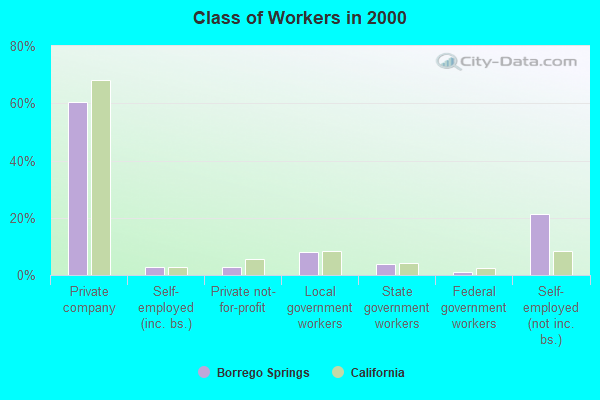
Employee of private company:
| Borrego Springs: | 60.4% (679) |
| California: | 68.0% (10,009,465) |
Self-employed in own incorporated business:
| Borrego Springs: | 2.8% (32) |
| California: | 2.7% (402,392) |
Private not-for-profit wage and salary workers:
| Borrego Springs: | 2.8% (32) |
| California: | 5.7% (845,536) |
Local government workers:
| Borrego Springs: | 8.1% (91) |
| California: | 8.3% (1,218,764) |
State government workers:
| Borrego Springs: | 3.7% (42) |
| California: | 4.0% (594,953) |
Federal government workers:
| Borrego Springs: | 1.0% (11) |
| California: | 2.3% (344,354) |
Self-employed workers in own not incorporated business:
| Borrego Springs: | 21.2% (238) |
| California: | 8.5% (1,249,530) |
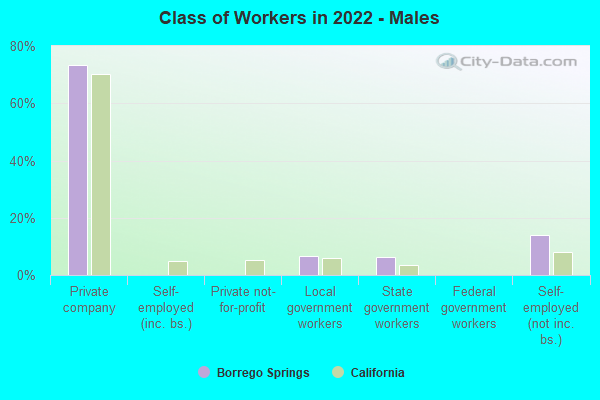
Employee of private company - Males:
| Borrego Springs: | 73.3% (377) |
| California: | 70.3% (7,191,252) |
Local government workers - Males:
| Borrego Springs: | 6.5% (34) |
| California: | 6.0% (610,331) |
State government workers - Males:
| Borrego Springs: | 6.3% (33) |
| California: | 3.4% (343,636) |
Self-employed workers in own not incorporated business - Males:
| Borrego Springs: | 13.8% (71) |
| California: | 8.1% (824,359) |
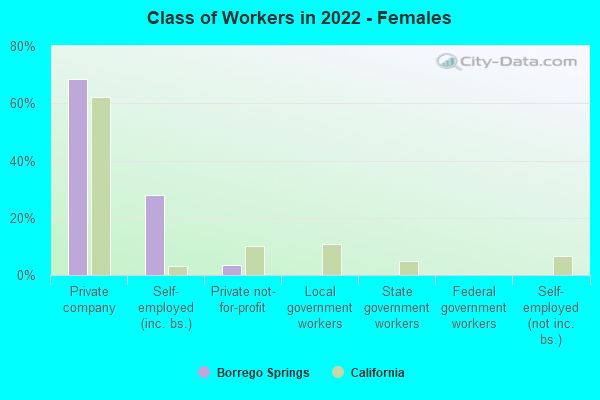
Employee of private company - Females:
| Borrego Springs: | 68.6% (478) |
| California: | 62.0% (5,404,778) |
Self-employed in own incorporated business - Females:
| Borrego Springs: | 28.0% (195) |
| California: | 3.2% (279,945) |
Private not-for-profit wage and salary workers - Females:
| Borrego Springs: | 3.4% (23) |
| California: | 10.2% (888,285) |