Work and Jobs in Burlington, Michigan (MI) Detailed Stats
Occupations, Industries, Unemployment, Workers, Commute
Settings
X


Recent posts about work in Burlington, Michigan on our local forum with over 2,400,000 registered users:
 | Why won't high tech companies open offices in Detroit? (44 replies) |
| Thinking of moving to Marquette... (86 replies) |
| To Michigan from Vermont - advice (28 replies) |
| Pros and cons of living in Michigan? (15 replies) |
| Grand Rapids Area...Jobs, Climate, Politics (9 replies) |
| Winters really that bad? (42 replies) |
Latest news about work in Burlington, MI collected exclusively by city-data.com from local newspapers, TV, and radio stations
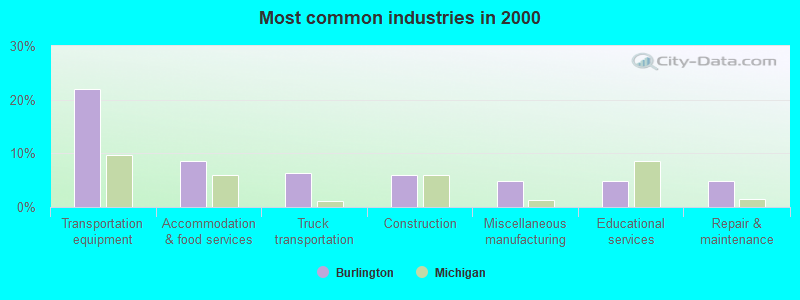
The most common industries in Burlington are: Transportation equipment (21.9% of civilian employees), Accommodation & food services (8.6% of civilian employees), Truck transportation (6.4% of civilian employees). 76.8% of workers work in Calhoun County and 4.2% of all workers work at home. 82.8% of workers are employees of private companies, which is 15.7% greater than the rate of 69.8% across the entire state of Michigan.
Whole page based on the data from 2000 / 2022 when the population of Burlington, Michigan was 405 / 232
Whole page based on the data from 2000 / 2022 when the population of Burlington, Michigan was 405 / 232
Most common industries
Most common industries | |||
|---|---|---|---|
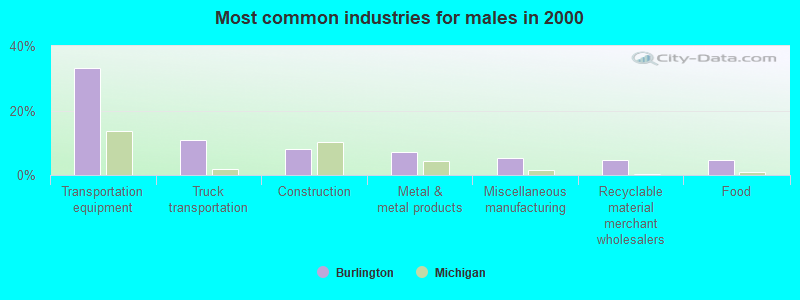
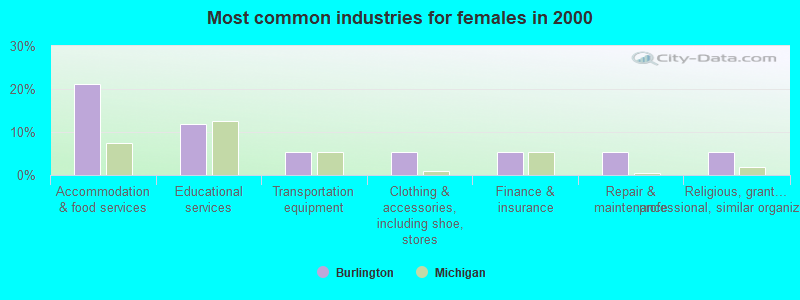
Industry | All | Males | Females |
| Transportation equipment | 21.9% (41) | 33.3% (37) | 5.3% (4) |
| Accommodation and food services | 8.6% (16) | 0.0% (0) | 21.1% (16) |
| Truck transportation | 6.4% (12) | 10.8% (12) | 0.0% (0) |
| Construction | 5.9% (11) | 8.1% (9) | 2.6% (2) |
| Miscellaneous manufacturing | 4.8% (9) | 5.4% (6) | 3.9% (3) |
| Educational services | 4.8% (9) | 0.0% (0) | 11.8% (9) |
| Repair and maintenance | 4.8% (9) | 4.5% (5) | 5.3% (4) |
| Metal and metal products | 4.3% (8) | 7.2% (8) | 0.0% (0) |
| Plastics and rubber products | 3.7% (7) | 3.6% (4) | 3.9% (3) |
| Food | 2.7% (5) | 4.5% (5) | 0.0% (0) |
| Recyclable material merchant wholesalers | 2.7% (5) | 4.5% (5) | 0.0% (0) |
| Public administration | 2.7% (5) | 3.6% (4) | 1.3% (1) |
| Religious, grantmaking, civic, professional, and similar organizations | 2.1% (4) | 0.0% (0) | 5.3% (4) |
| Drugs, sundries, and chemical and allied products merchant wholesalers | 2.1% (4) | 3.6% (4) | 0.0% (0) |
| Motor vehicle and parts dealers | 2.1% (4) | 3.6% (4) | 0.0% (0) |
| Department and other general merchandise stores | 2.1% (4) | 3.6% (4) | 0.0% (0) |
| Clothing and accessories, including shoe, stores | 2.1% (4) | 0.0% (0) | 5.3% (4) |
| Finance and insurance | 2.1% (4) | 0.0% (0) | 5.3% (4) |
| Agriculture, forestry, fishing and hunting | 1.6% (3) | 0.0% (0) | 3.9% (3) |
| Nonmetallic mineral products | 1.6% (3) | 0.0% (0) | 3.9% (3) |
| Office supplies and stationery stores | 1.6% (3) | 0.0% (0) | 3.9% (3) |
| Health care | 1.6% (3) | 0.0% (0) | 3.9% (3) |
| Professional, scientific, and technical services | 1.6% (3) | 0.9% (1) | 2.6% (2) |
| Social assistance | 1.6% (3) | 0.0% (0) | 3.9% (3) |
| Arts, entertainment, and recreation | 1.6% (3) | 0.9% (1) | 2.6% (2) |
| Gasoline stations | 1.1% (2) | 0.0% (0) | 2.6% (2) |
| Textile mills and textile products | 1.1% (2) | 1.8% (2) | 0.0% (0) |
| Groceries and related products merchant wholesalers | 0.5% (1) | 0.0% (0) | 1.3% (1) |
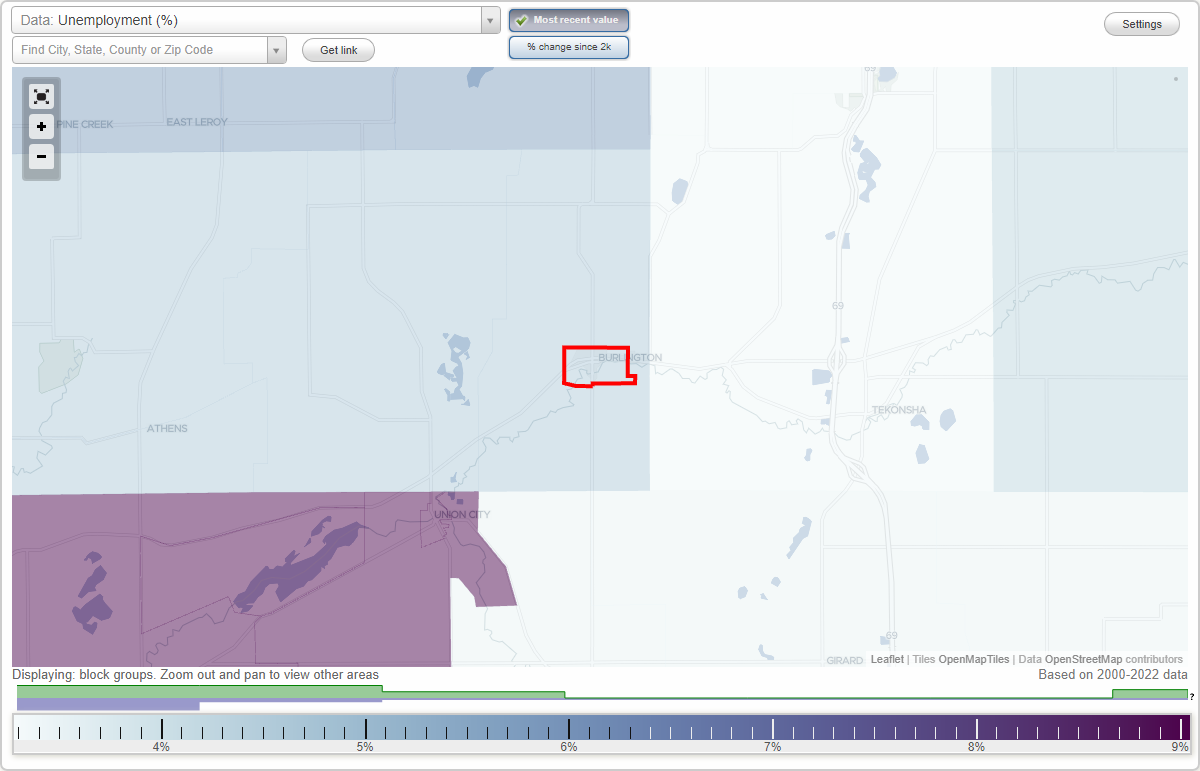
Unemployment in Burlington
- Unemployment by race in 2022
- Unemployment rate for White non-Hispanic residents
- 2.5%Males
- 4.1%Females
- Unemployment by race in 2000
- Unemployment rate for White non-Hispanic residents
- 3.6%Males
Time leaving home to go to work
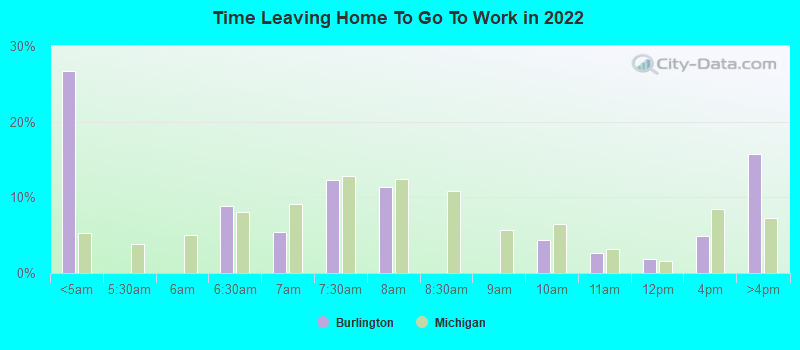
12:00 a.m. to 4:59 a.m.:
| Burlington: | 26.6% (25) |
| Michigan: | 5.3% (217,059) |
6:00 a.m. to 6:29 a.m.:
| Burlington: | 8.9% (8) |
| Michigan: | 8.0% (325,839) |
6:30 a.m. to 6:59 a.m.:
| Burlington: | 5.4% (5) |
| Michigan: | 9.1% (371,022) |
7:00 a.m. to 7:29 a.m.:
| Burlington: | 12.3% (12) |
| Michigan: | 12.8% (521,843) |
7:30 a.m. to 7:59 a.m.:
| Burlington: | 11.4% (11) |
| Michigan: | 12.4% (502,248) |
9:00 a.m. to 9:59 a.m.:
| Burlington: | 4.4% (4) |
| Michigan: | 6.5% (265,944) |
10:00 a.m. to 10:59 a.m.:
| Burlington: | 2.6% (2) |
| Michigan: | 3.2% (130,748) |
11:00 a.m. to 11:59 a.m.:
| Burlington: | 1.9% (2) |
| Michigan: | 1.6% (65,426) |
12:00 p.m. to 3:59 p.m.:
| Burlington: | 4.9% (5) |
| Michigan: | 8.5% (343,555) |
4:00 p.m. to 11:59 p.m.:
| Burlington: | 15.7% (15) |
| Michigan: | 7.2% (293,541) |
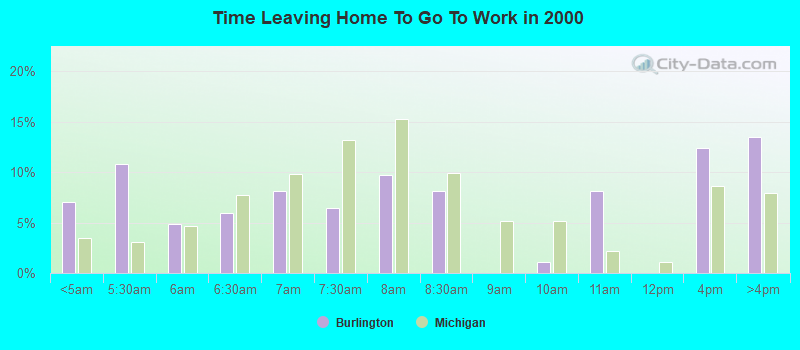
<5am:
| Burlington: | 7.0% (13) |
| Michigan: | 3.4% (156,327) |
5:30am:
| Burlington: | 10.8% (20) |
| Michigan: | 3.1% (139,699) |
6am:
| Burlington: | 4.9% (9) |
| Michigan: | 4.7% (211,446) |
6:30am:
| Burlington: | 5.9% (11) |
| Michigan: | 7.7% (349,878) |
7am:
| Burlington: | 8.1% (15) |
| Michigan: | 9.8% (446,636) |
7:30am:
| Burlington: | 6.5% (12) |
| Michigan: | 13.2% (597,402) |
8am:
| Burlington: | 9.7% (18) |
| Michigan: | 15.3% (692,901) |
8:30am:
| Burlington: | 8.1% (15) |
| Michigan: | 9.9% (448,050) |
10am:
| Burlington: | 1.1% (2) |
| Michigan: | 5.1% (233,210) |
11am:
| Burlington: | 8.1% (15) |
| Michigan: | 2.2% (98,395) |
4pm:
| Burlington: | 12.4% (23) |
| Michigan: | 8.6% (391,612) |
>4pm:
| Burlington: | 13.5% (25) |
| Michigan: | 8.0% (361,157) |
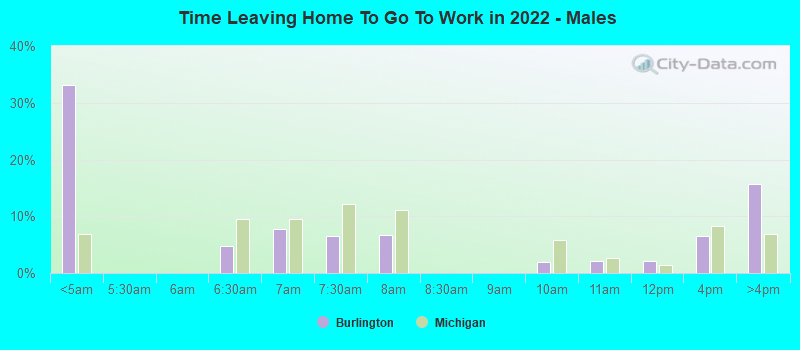
12:00 a.m. to 4:59 a.m. - Males:
| Burlington: | 33.1% (22) |
| Michigan: | 6.9% (150,486) |
6:00 a.m. to 6:29 a.m. - Males:
| Burlington: | 4.7% (3) |
| Michigan: | 9.5% (205,411) |
6:30 a.m. to 6:59 a.m. - Males:
| Burlington: | 7.7% (5) |
| Michigan: | 9.5% (206,578) |
7:00 a.m. to 7:29 a.m. - Males:
| Burlington: | 6.5% (4) |
| Michigan: | 12.2% (265,994) |
7:30 a.m. to 7:59 a.m. - Males:
| Burlington: | 6.7% (4) |
| Michigan: | 11.2% (242,506) |
9:00 a.m. to 9:59 a.m. - Males:
| Burlington: | 2.0% (1) |
| Michigan: | 5.8% (125,232) |
10:00 a.m. to 10:59 a.m. - Males:
| Burlington: | 2.1% (1) |
| Michigan: | 2.7% (58,514) |
11:00 a.m. to 11:59 a.m. - Males:
| Burlington: | 2.1% (1) |
| Michigan: | 1.4% (30,535) |
12:00 p.m. to 3:59 p.m. - Males:
| Burlington: | 6.6% (4) |
| Michigan: | 8.3% (180,250) |
4:00 p.m. to 11:59 p.m. - Males:
| Burlington: | 15.8% (10) |
| Michigan: | 6.8% (148,394) |
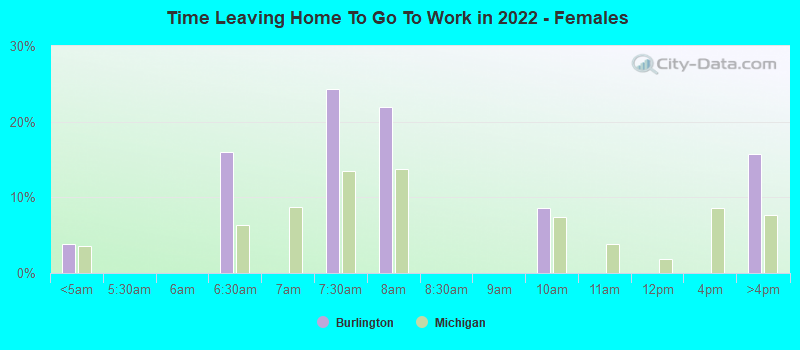
12:00 a.m. to 4:59 a.m. - Females:
| Burlington: | 3.8% (1) |
| Michigan: | 3.5% (66,573) |
6:00 a.m. to 6:29 a.m. - Females:
| Burlington: | 16.0% (5) |
| Michigan: | 6.4% (120,428) |
7:00 a.m. to 7:29 a.m. - Females:
| Burlington: | 24.3% (7) |
| Michigan: | 13.5% (255,849) |
7:30 a.m. to 7:59 a.m. - Females:
| Burlington: | 21.9% (6) |
| Michigan: | 13.7% (259,742) |
9:00 a.m. to 9:59 a.m. - Females:
| Burlington: | 8.5% (2) |
| Michigan: | 7.4% (140,712) |
4:00 p.m. to 11:59 p.m. - Females:
| Burlington: | 15.7% (5) |
| Michigan: | 7.7% (145,147) |
Travel time to work
Percentage of workers working in this county: 76.8%
Number of people working at home: 4 (4.2% of all workers)
Number of people working at home: 4 (4.2% of all workers)
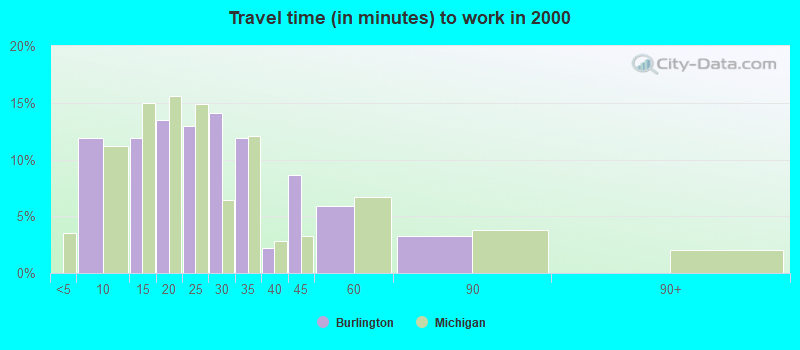

5 to 9 minutes:
| Burlington: | 11.9% (22) |
| Michigan: | 11.2% (507,653) |
10 to 14 minutes:
| Burlington: | 11.9% (22) |
| Michigan: | 15.0% (681,990) |
15 to 19 minutes:
| Burlington: | 13.5% (25) |
| Michigan: | 15.6% (708,036) |
20 to 24 minutes:
| Burlington: | 13.0% (24) |
| Michigan: | 14.9% (675,865) |
25 to 29 minutes:
| Burlington: | 14.1% (26) |
| Michigan: | 6.4% (291,938) |
30 to 34 minutes:
| Burlington: | 11.9% (22) |
| Michigan: | 12.0% (546,870) |
35 to 39 minutes:
| Burlington: | 2.2% (4) |
| Michigan: | 2.8% (126,158) |
40 to 44 minutes:
| Burlington: | 8.6% (16) |
| Michigan: | 3.3% (147,930) |
45 to 59 minutes:
| Burlington: | 5.9% (11) |
| Michigan: | 6.7% (304,785) |
60 to 89 minutes:
| Burlington: | 3.2% (6) |
| Michigan: | 3.8% (171,403) |
Means of transportation to work
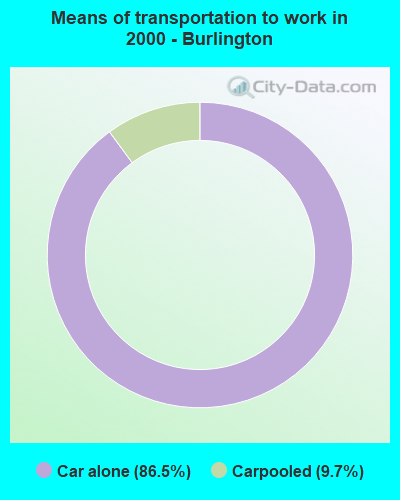
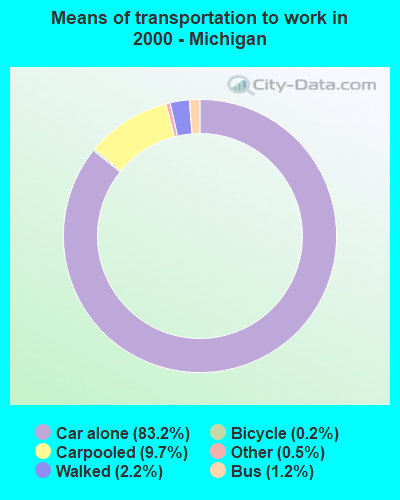
Drove car alone:
| Burlington: | 86.5% (160) |
| Michigan: | 83.2% (3,776,535) |
Carpooled:
| Burlington: | 9.7% (18) |
| Michigan: | 9.7% (440,606) |
Private vehicle occupancy
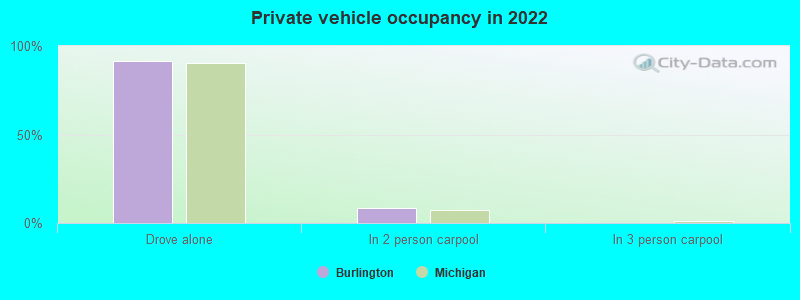
Drove alone:
| Burlington: | 91.7% (76) |
| Michigan: | 90.4% (3,484,723) |
In 2 person carpool:
| Burlington: | 8.2% (7) |
| Michigan: | 7.3% (282,230) |
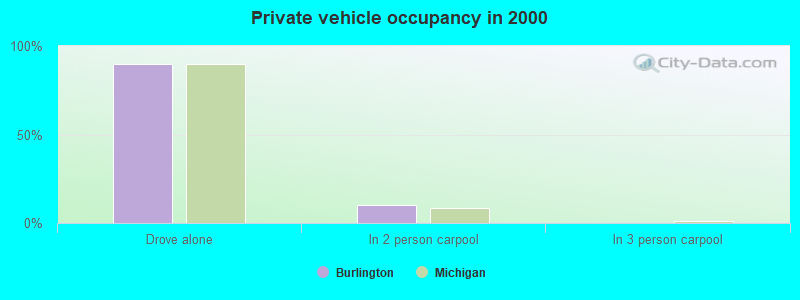
Drove alone:
| Burlington: | 89.9% (160) |
| Michigan: | 89.6% (3,776,535) |
In 2 person carpool:
| Burlington: | 10.1% (18) |
| Michigan: | 8.5% (358,473) |
Class of workers
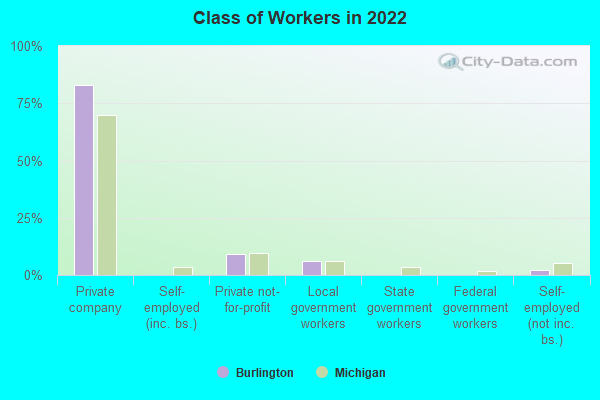
Employee of private company:
| Burlington: | 82.8% (86) |
| Michigan: | 69.8% (3,350,300) |
Private not-for-profit wage and salary workers:
| Burlington: | 9.1% (9) |
| Michigan: | 9.8% (468,535) |
Local government workers:
| Burlington: | 6.1% (6) |
| Michigan: | 6.3% (300,493) |
Self-employed workers in own not incorporated business:
| Burlington: | 2.0% (2) |
| Michigan: | 5.3% (256,382) |
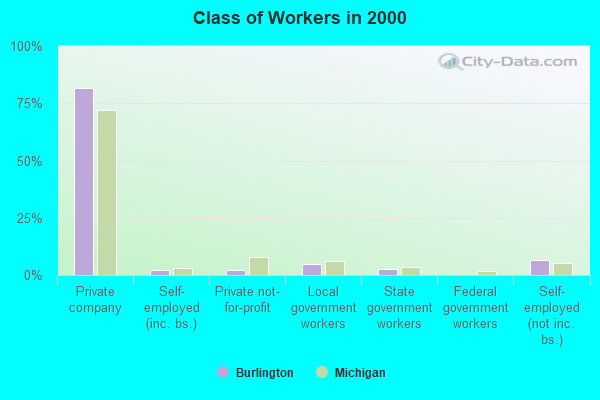
Employee of private company:
| Burlington: | 81.8% (153) |
| Michigan: | 71.9% (3,336,174) |
Self-employed in own incorporated business:
| Burlington: | 2.1% (4) |
| Michigan: | 3.1% (145,931) |
Private not-for-profit wage and salary workers:
| Burlington: | 2.1% (4) |
| Michigan: | 8.0% (370,593) |
Local government workers:
| Burlington: | 4.8% (9) |
| Michigan: | 6.2% (285,684) |
State government workers:
| Burlington: | 2.7% (5) |
| Michigan: | 3.7% (170,984) |
Self-employed workers in own not incorporated business:
| Burlington: | 6.4% (12) |
| Michigan: | 5.2% (243,300) |
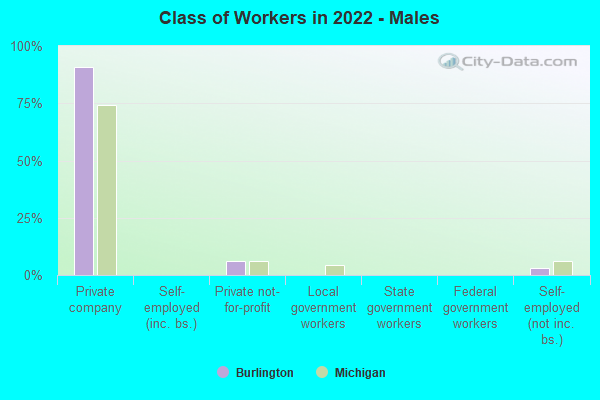
Employee of private company - Males:
| Burlington: | 90.9% (63) |
| Michigan: | 74.4% (1,882,423) |
Private not-for-profit wage and salary workers - Males:
| Burlington: | 6.1% (4) |
| Michigan: | 6.0% (151,243) |
Self-employed workers in own not incorporated business - Males:
| Burlington: | 3.0% (2) |
| Michigan: | 6.0% (152,865) |
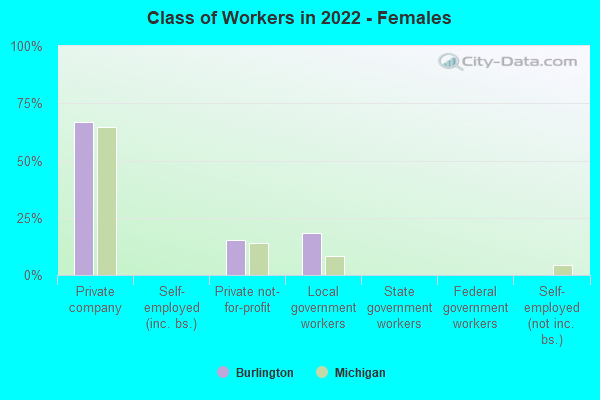
Employee of private company - Females:
| Burlington: | 66.7% (23) |
| Michigan: | 64.7% (1,467,877) |
Private not-for-profit wage and salary workers - Females:
| Burlington: | 15.2% (5) |
| Michigan: | 14.0% (317,292) |
Local government workers - Females:
| Burlington: | 18.2% (6) |
| Michigan: | 8.3% (189,466) |