Work and Jobs in Carmel Valley, California (CA) Detailed Stats
Occupations, Industries, Unemployment, Workers, Commute
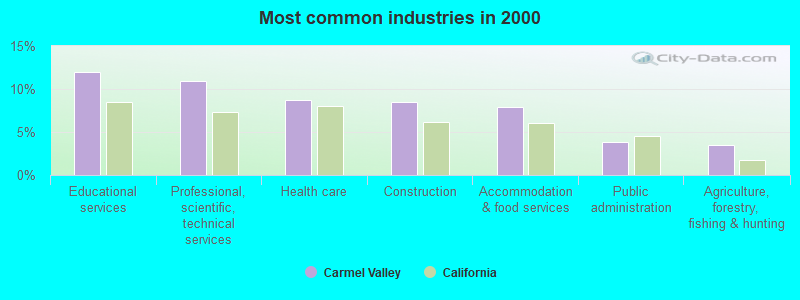
The most common industries in Carmel Valley are: Educational services (12.0% of civilian employees), Professional, scientific, technical services (10.9% of civilian employees), Health care (8.7% of civilian employees). 49.9% of workers are employees of private companies, which is 36.3% less than the rate of 68.0% across the entire state of California.
Most common industries
Most common industries | |||
|---|---|---|---|
Industry | All | Males | Females |
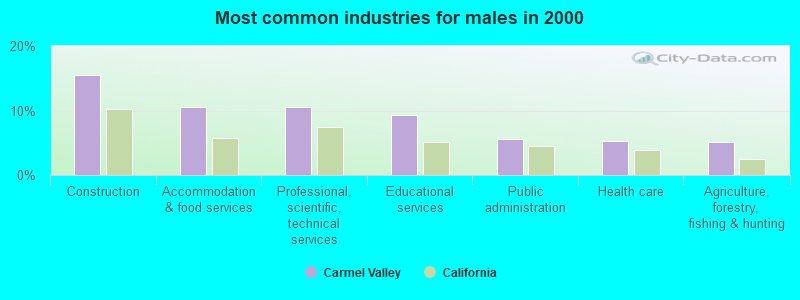
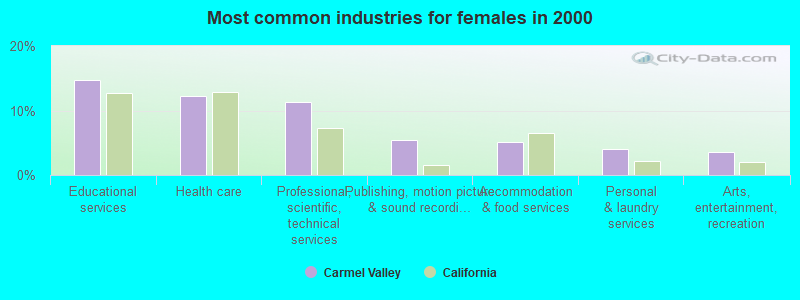
| Educational services | 12.0% (403) | 9.4% (163) | 14.7% (240) |
| Professional, scientific, and technical services | 10.9% (368) | 10.5% (183) | 11.3% (185) |
| Health care | 8.7% (293) | 5.3% (93) | 12.3% (200) |
| Construction | 8.5% (288) | 15.5% (270) | 1.1% (18) |
| Accommodation and food services | 7.9% (268) | 10.6% (185) | 5.1% (83) |
| Public administration | 3.8% (128) | 5.6% (98) | 1.8% (30) |
| Agriculture, forestry, fishing and hunting | 3.5% (117) | 5.2% (90) | 1.7% (27) |
| Administrative and support and waste management services | 3.5% (117) | 4.2% (74) | 2.6% (43) |
| Publishing, and motion picture and sound recording industries | 3.2% (109) | 1.2% (21) | 5.4% (88) |
| Arts, entertainment, and recreation | 3.0% (102) | 2.5% (43) | 3.6% (59) |
| Real estate and rental and leasing | 2.3% (78) | 1.1% (19) | 3.6% (59) |
| Motor vehicle and parts dealers | 2.0% (68) | 2.3% (40) | 1.7% (28) |
| Personal and laundry services | 2.0% (66) | 0.0% (0) | 4.0% (66) |
| Repair and maintenance | 1.9% (64) | 2.6% (45) | 1.2% (19) |
| Finance and insurance | 1.8% (62) | 1.4% (25) | 2.3% (37) |
| Used merchandise, gift, novelty, and souvenir, and other miscellaneous stores | 1.7% (59) | 1.8% (32) | 1.7% (27) |
| Furniture and home furnishings, and household appliance stores | 1.6% (54) | 1.1% (20) | 2.1% (34) |
| Religious, grantmaking, civic, professional, and similar organizations | 1.6% (53) | 0.0% (0) | 3.3% (53) |
| Building material and garden equipment and supplies dealers | 1.6% (53) | 1.7% (30) | 1.4% (23) |
| Miscellaneous nondurable goods merchant wholesalers | 1.5% (52) | 1.4% (24) | 1.7% (28) |
| Beverage and tobacco products | 1.5% (51) | 1.3% (23) | 1.7% (28) |
| Miscellaneous manufacturing | 1.4% (46) | 1.5% (26) | 1.2% (20) |
| Food and beverage stores | 1.3% (45) | 1.1% (19) | 1.6% (26) |
| Gasoline stations | 0.9% (32) | 1.0% (17) | 0.9% (15) |
| U. S. Postal service | 0.9% (31) | 1.8% (31) | 0.0% (0) |
| Pharmacies and drug stores | 0.9% (31) | 1.1% (19) | 0.7% (12) |
| Broadcasting and telecommunications | 0.9% (29) | 1.1% (19) | 0.6% (10) |
| Private households | 0.8% (27) | 0.0% (0) | 1.7% (27) |
| Food | 0.7% (25) | 1.4% (25) | 0.0% (0) |
| Alcoholic beverages merchant wholesalers | 0.7% (24) | 0.5% (9) | 0.9% (15) |
| Retail florists | 0.6% (21) | 0.0% (0) | 1.3% (21) |
| Sporting goods, camera, and hobby and toy stores | 0.6% (20) | 0.6% (11) | 0.6% (9) |
| Miscellaneous durable goods merchant wholesalers | 0.6% (20) | 0.0% (0) | 1.2% (20) |
| Other transportation, and support activities, and couriers | 0.6% (19) | 0.7% (12) | 0.4% (7) |
| Machinery, equipment, and supplies merchant wholesalers | 0.6% (19) | 1.1% (19) | 0.0% (0) |
| Furniture and related product manufacturing | 0.5% (16) | 0.5% (8) | 0.5% (8) |
| Office supplies and stationery stores | 0.4% (15) | 0.0% (0) | 0.9% (15) |
| Data processing, libraries, and other information services | 0.4% (15) | 0.3% (6) | 0.6% (9) |
| Social assistance | 0.4% (15) | 0.0% (0) | 0.9% (15) |
| Book stores and news dealers | 0.4% (14) | 0.0% (0) | 0.9% (14) |
| Computer and electronic products | 0.4% (12) | 0.0% (0) | 0.7% (12) |
| Utilities | 0.3% (10) | 0.6% (10) | 0.0% (0) |
| Other direct selling establishments | 0.3% (9) | 0.5% (9) | 0.0% (0) |
| Groceries and related products merchant wholesalers | 0.3% (9) | 0.5% (9) | 0.0% (0) |
| Air transportation | 0.2% (8) | 0.5% (8) | 0.0% (0) |
| Professional and commercial equipment and supplies merchant wholesalers | 0.2% (7) | 0.4% (7) | 0.0% (0) |
Unemployment in Carmel Valley
- Unemployment by race in 2000
- Unemployment rate for White non-Hispanic residents
- 2.4%Males
- 2.7%Females
- Unemployment rate for other race residents
- 23.2%Males
Time leaving home to go to work
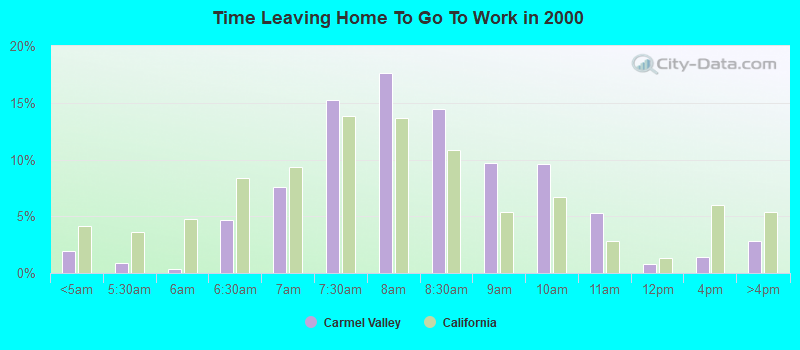
<5am:
| Carmel Valley: | 1.9% (64) |
| California: | 4.2% (606,086) |
5:30am:
| Carmel Valley: | 0.8% (28) |
| California: | 3.6% (523,209) |
6am:
| Carmel Valley: | 0.4% (12) |
| California: | 4.8% (692,256) |
6:30am:
| Carmel Valley: | 4.6% (155) |
| California: | 8.4% (1,216,867) |
7am:
| Carmel Valley: | 7.6% (253) |
| California: | 9.4% (1,362,830) |
7:30am:
| Carmel Valley: | 15.2% (508) |
| California: | 13.8% (2,006,950) |
8am:
| Carmel Valley: | 17.6% (588) |
| California: | 13.7% (1,986,831) |
8:30am:
| Carmel Valley: | 14.5% (483) |
| California: | 10.9% (1,577,815) |
9am:
| Carmel Valley: | 9.7% (324) |
| California: | 5.4% (778,152) |
10am:
| Carmel Valley: | 9.6% (319) |
| California: | 6.7% (972,355) |
11am:
| Carmel Valley: | 5.3% (176) |
| California: | 2.9% (414,479) |
12pm:
| Carmel Valley: | 0.8% (26) |
| California: | 1.3% (189,005) |
4pm:
| Carmel Valley: | 1.4% (47) |
| California: | 6.0% (865,284) |
>4pm:
| Carmel Valley: | 2.8% (94) |
| California: | 5.3% (776,167) |
Travel time to work
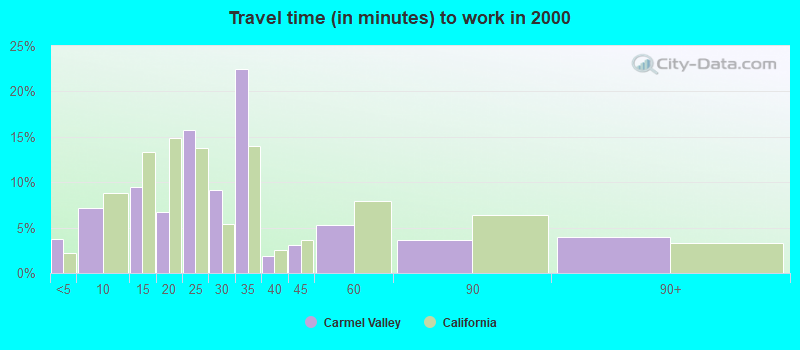
Less than 5 minutes:
| Carmel Valley: | 3.7% (125) |
| California: | 2.2% (324,703) |
5 to 9 minutes:
| Carmel Valley: | 7.2% (239) |
| California: | 8.8% (1,280,443) |
10 to 14 minutes:
| Carmel Valley: | 9.4% (315) |
| California: | 13.3% (1,930,263) |
15 to 19 minutes:
| Carmel Valley: | 6.8% (226) |
| California: | 14.9% (2,157,970) |
20 to 24 minutes:
| Carmel Valley: | 15.8% (526) |
| California: | 13.8% (2,004,060) |
25 to 29 minutes:
| Carmel Valley: | 9.2% (306) |
| California: | 5.4% (782,241) |
30 to 34 minutes:
| Carmel Valley: | 22.5% (749) |
| California: | 13.9% (2,025,657) |
35 to 39 minutes:
| Carmel Valley: | 1.8% (61) |
| California: | 2.5% (366,487) |
40 to 44 minutes:
| Carmel Valley: | 3.1% (104) |
| California: | 3.6% (528,043) |
45 to 59 minutes:
| Carmel Valley: | 5.2% (175) |
| California: | 7.9% (1,151,598) |
60 to 89 minutes:
| Carmel Valley: | 3.6% (120) |
| California: | 6.4% (933,123) |
90 or more minutes:
| Carmel Valley: | 3.9% (131) |
| California: | 3.3% (483,698) |
Means of transportation to work
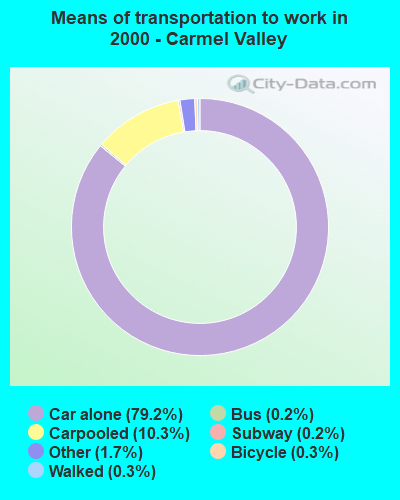

Drove car alone:
| Carmel Valley: | 79.2% (2,641) |
| California: | 71.8% (10,432,462) |
Carpooled:
| Carmel Valley: | 10.3% (344) |
| California: | 14.5% (2,113,313) |
Bus or trolley bus:
| Carmel Valley: | 0.2% (7) |
| California: | 3.8% (549,425) |
Subway or elevated:
| Carmel Valley: | 0.2% (7) |
| California: | 0.7% (107,711) |
Bicycle:
| Carmel Valley: | 0.3% (9) |
| California: | 0.8% (120,567) |
Walked:
| Carmel Valley: | 0.3% (11) |
| California: | 2.9% (414,581) |
Other means:
| Carmel Valley: | 1.7% (58) |
| California: | 0.8% (115,064) |
Private vehicle occupancy
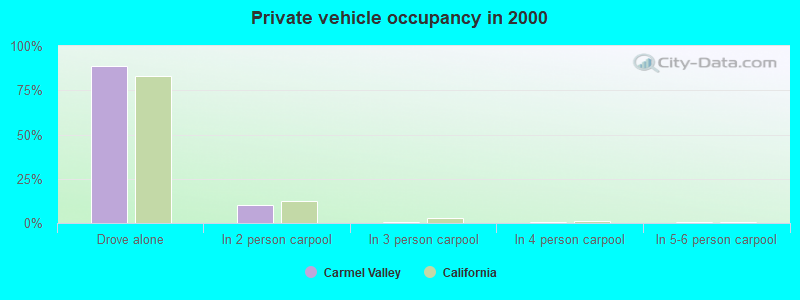
Drove alone:
| Carmel Valley: | 88.5% (2,641) |
| California: | 83.2% (10,432,462) |
In 2 person carpool:
| Carmel Valley: | 10.1% (300) |
| California: | 12.5% (1,564,905) |
In 3 person carpool:
| Carmel Valley: | 0.3% (10) |
| California: | 2.6% (330,732) |
In 4 person carpool:
| Carmel Valley: | 0.3% (10) |
| California: | 1.0% (119,364) |
In 5-6 person carpool:
| Carmel Valley: | 0.8% (24) |
| California: | 0.5% (57,036) |
Class of workers
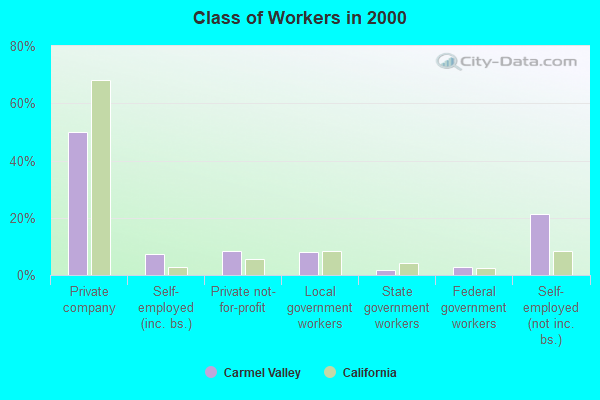
Employee of private company:
| Carmel Valley: | 49.9% (1,682) |
| California: | 68.0% (10,009,465) |
Self-employed in own incorporated business:
| Carmel Valley: | 7.4% (251) |
| California: | 2.7% (402,392) |
Private not-for-profit wage and salary workers:
| Carmel Valley: | 8.4% (283) |
| California: | 5.7% (845,536) |
Local government workers:
| Carmel Valley: | 8.0% (270) |
| California: | 8.3% (1,218,764) |
State government workers:
| Carmel Valley: | 1.7% (57) |
| California: | 4.0% (594,953) |
Federal government workers:
| Carmel Valley: | 2.8% (96) |
| California: | 2.3% (344,354) |
Self-employed workers in own not incorporated business:
| Carmel Valley: | 21.4% (723) |
| California: | 8.5% (1,249,530) |
Unpaid family workers:
| Carmel Valley: | 0.3% (10) |
| California: | 0.4% (53,934) |
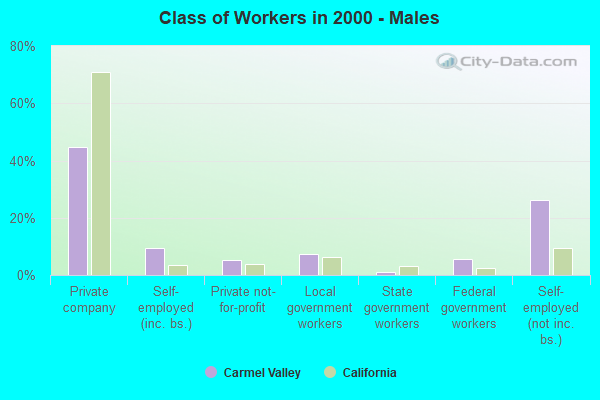
Employee of private company - Males:
| Carmel Valley: | 44.9% (782) |
| California: | 71.1% (5,716,697) |
Self-employed in own incorporated business - Males:
| Carmel Valley: | 9.5% (166) |
| California: | 3.6% (290,657) |
Private not-for-profit wage and salary workers - Males:
| Carmel Valley: | 5.4% (94) |
| California: | 3.8% (303,997) |
Local government workers - Males:
| Carmel Valley: | 7.3% (128) |
| California: | 6.2% (495,927) |
State government workers - Males:
| Carmel Valley: | 1.1% (19) |
| California: | 3.2% (255,434) |
Federal government workers - Males:
| Carmel Valley: | 5.5% (96) |
| California: | 2.5% (198,555) |
Self-employed workers in own not incorporated business - Males:
| Carmel Valley: | 26.2% (457) |
| California: | 9.5% (760,853) |
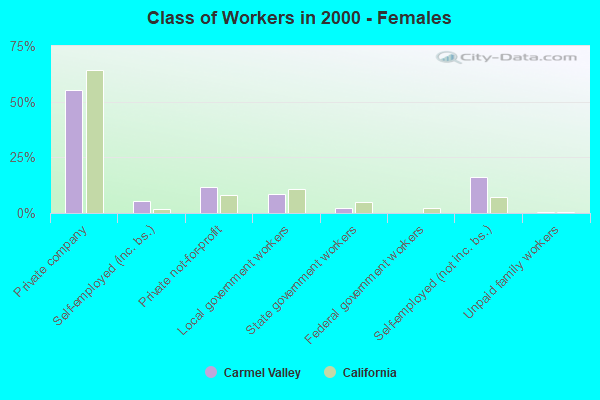
Employee of private company - Females:
| Carmel Valley: | 55.2% (900) |
| California: | 64.3% (4,292,768) |
Self-employed in own incorporated business - Females:
| Carmel Valley: | 5.2% (85) |
| California: | 1.7% (111,735) |
Private not-for-profit wage and salary workers - Females:
| Carmel Valley: | 11.6% (189) |
| California: | 8.1% (541,539) |
Local government workers - Females:
| Carmel Valley: | 8.7% (142) |
| California: | 10.8% (722,837) |
State government workers - Females:
| Carmel Valley: | 2.3% (38) |
| California: | 5.1% (339,519) |
Self-employed workers in own not incorporated business - Females:
| Carmel Valley: | 16.3% (266) |
| California: | 7.3% (488,677) |
Unpaid family workers - Females:
| Carmel Valley: | 0.6% (10) |
| California: | 0.5% (30,704) |