Work and Jobs in Carson, California (CA) Detailed Stats
Occupations, Industries, Unemployment, Workers, Commute
Settings
X


Recent posts about work in Carson, California on our local forum with over 2,400,000 registered users:
 | Where in Southern California can I find Entry Level Mechanical Engineering jobs? (30 replies) |
| Raising a family within an hour of Carson? (32 replies) |
| Working in Carson: Long Beach vs. Redondo/Hermosa (4 replies) |
| The Great California Exodus Accelerates (1871 replies) |
| Job in carson (1 reply) |
| Job in Carson where to live (19 replies) |
Latest news about work in Carson, CA collected exclusively by city-data.com from local newspapers, TV, and radio stations
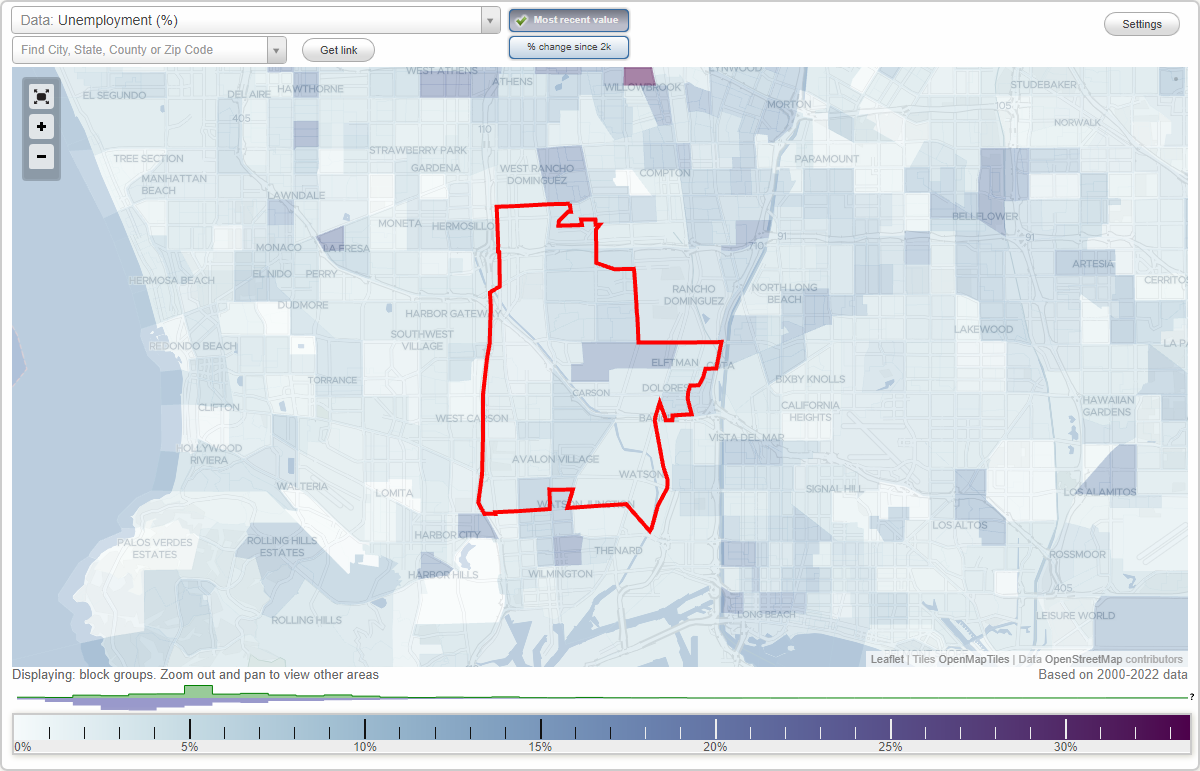
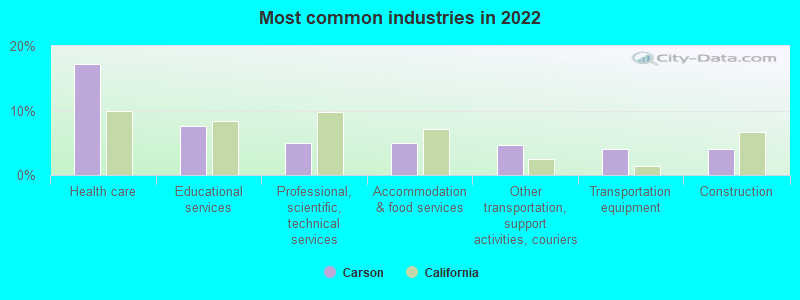
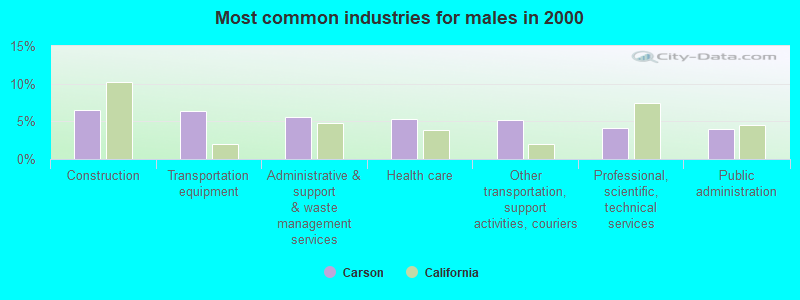
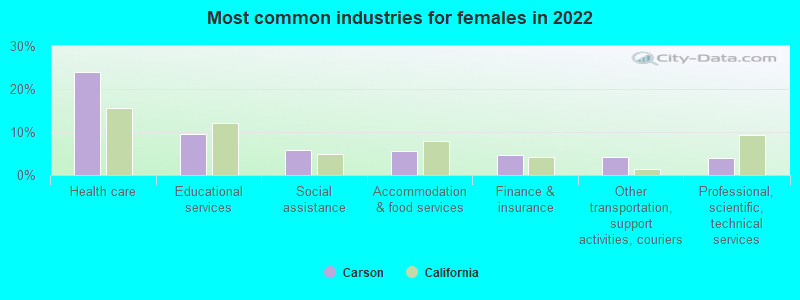
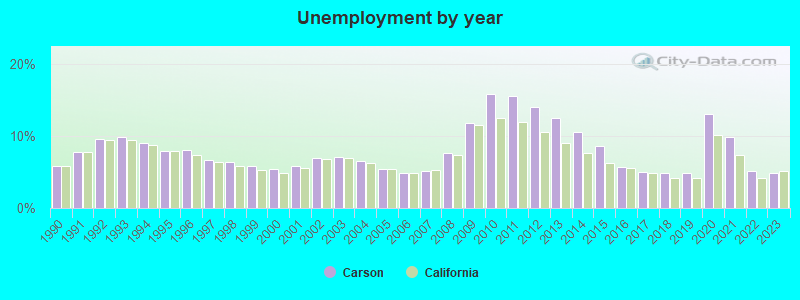
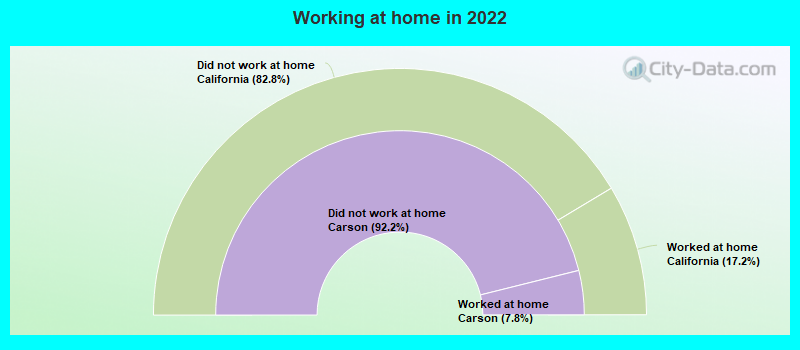
The unemployment rate in 2023 in Carson, CA was 4.9%, which was 4.1% less than the unemployment rate of 5.1% across the entire state of California. Compared to the unemployment rate of 12.5% in 2013, this represents a decrease of 155.1%. According to 2022 data, the most common industries in Carson are: Health care (17.2% of civilian employees), Educational services (7.6% of civilian employees), Professional, scientific, technical services (4.9% of civilian employees). 93.0% of workers work in Los Angeles County and 7.8% of all workers work at home. 64.5% of workers are employees of private companies, which is 3.1% less than the rate of 66.5% across the entire state of California.
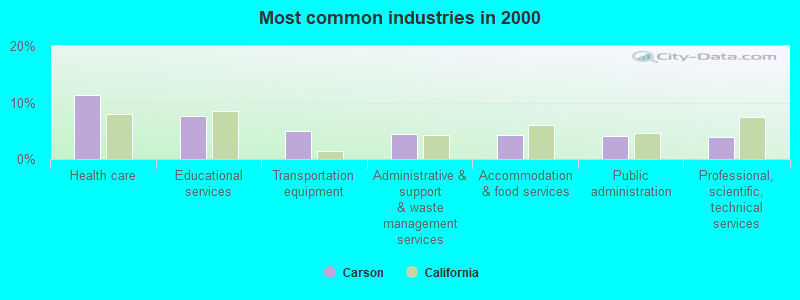
Whole page based on the data from 2000 / 2022 when the population of Carson, California was 89,730 / 92,391
Whole page based on the data from 2000 / 2022 when the population of Carson, California was 89,730 / 92,391
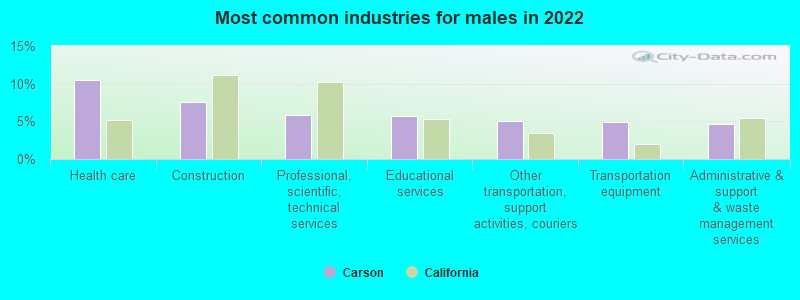
Most common industries
Most common industries | Most common industries | |||||
|---|---|---|---|---|---|---|
Industry | All | Males | Females | All | Males | Females |
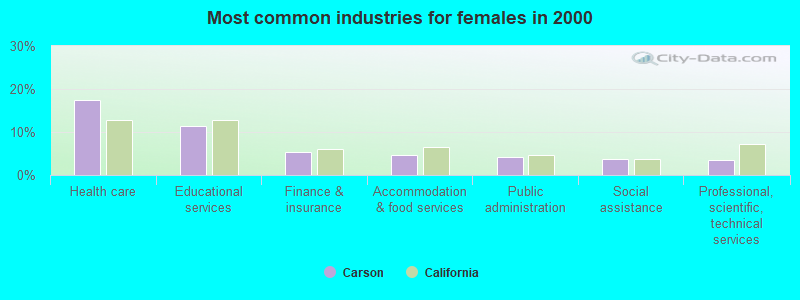
| Health care | 17.2% (8,110) | 10.5% (2,493) | 24.0% (5,617) | 11.3% (4,210) | 5.3% (1,003) | 17.5% (3,207) |
| Educational services | 7.6% (3,572) | 5.6% (1,337) | 9.5% (2,235) | 7.6% (2,851) | 3.9% (743) | 11.5% (2,108) |
| Professional, scientific, and technical services | 4.9% (2,315) | 5.8% (1,379) | 4.0% (936) | 3.8% (1,435) | 4.1% (775) | 3.6% (660) |
| Accommodation and food services | 4.9% (2,307) | 4.2% (994) | 5.6% (1,313) | 4.3% (1,604) | 3.9% (745) | 4.7% (859) |
| Other transportation, and support activities, and couriers | 4.6% (2,178) | 5.0% (1,190) | 4.2% (988) | 3.3% (1,231) | 5.2% (995) | 1.3% (236) |
| Transportation equipment | 4.1% (1,935) | 4.9% (1,164) | 3.3% (771) | 4.9% (1,834) | 6.3% (1,198) | 3.5% (636) |
| Construction | 4.0% (1,870) | 7.6% (1,790) | 0.3% (80) | 3.7% (1,389) | 6.6% (1,245) | 0.8% (144) |
| Social assistance | 3.9% (1,852) | 2.0% (475) | 5.9% (1,377) | 2.0% (759) | 0.4% (75) | 3.7% (684) |
| Administrative and support and waste management services | 3.6% (1,678) | 4.6% (1,092) | 2.5% (586) | 4.4% (1,631) | 5.6% (1,060) | 3.1% (571) |
| Finance and insurance | 3.3% (1,545) | 2.0% (469) | 4.6% (1,076) | 3.6% (1,350) | 2.0% (372) | 5.3% (978) |
| Public administration | 3.1% (1,464) | 2.4% (560) | 3.9% (904) | 4.1% (1,530) | 4.0% (756) | 4.2% (774) |
| Department and other general merchandise stores | 2.2% (1,040) | 2.3% (535) | 2.2% (505) | 1.7% (649) | 1.5% (293) | 1.9% (356) |
| Broadcasting and telecommunications | 1.9% (883) | 2.1% (508) | 1.6% (375) | 1.7% (624) | 1.4% (257) | 2.0% (367) |
| Food and beverage stores | 1.9% (881) | 1.4% (321) | 2.4% (560) | 1.9% (700) | 2.3% (428) | 1.5% (272) |
| Arts, entertainment, and recreation | 1.8% (836) | 2.2% (513) | 1.4% (323) | 1.1% (394) | 1.4% (271) | 0.7% (123) |
| Motor vehicle and parts dealers | 1.7% (791) | 2.5% (589) | 0.9% (202) | 1.4% (533) | 2.2% (418) | 0.6% (115) |
| Computer and electronic products | 1.6% (736) | 1.5% (346) | 1.7% (390) | 2.3% (875) | 2.4% (452) | 2.3% (423) |
| Real estate and rental and leasing | 1.6% (731) | 1.9% (448) | 1.2% (283) | 1.6% (584) | 1.8% (351) | 1.3% (233) |
| Repair and maintenance | 1.4% (683) | 2.7% (639) | 0.2% (44) | 1.6% (595) | 2.8% (536) | 0.3% (59) |
| U. S. Postal service | 1.4% (682) | 1.6% (373) | 1.3% (309) | 2.2% (803) | 2.4% (452) | 1.9% (351) |
| Personal and laundry services | 1.3% (636) | 1.5% (359) | 1.2% (277) | 1.1% (420) | 0.5% (100) | 1.7% (320) |
| Private households | 1.3% (624) | 0.4% (91) | 2.3% (533) | 0.8% (312) | 0.1% (17) | 1.6% (295) |
| Truck transportation | 1.1% (534) | 1.9% (448) | 0.4% (86) | 1.6% (606) | 2.7% (512) | 0.5% (94) |
| Chemicals | 1.1% (524) | 1.2% (279) | 1.0% (245) | 0.8% (310) | 0.8% (158) | 0.8% (152) |
| Groceries and related products merchant wholesalers | 1.0% (493) | 1.3% (317) | 0.8% (176) | 0.4% (146) | 0.4% (75) | 0.4% (71) |
| Religious, grantmaking, civic, professional, and similar organizations | 1.0% (474) | 1.0% (229) | 1.0% (245) | 0.9% (339) | 1.0% (195) | 0.8% (144) |
| Miscellaneous manufacturing | 0.9% (445) | 1.1% (270) | 0.7% (175) | 2.5% (942) | 2.8% (534) | 2.2% (408) |
| Metal and metal products | 0.9% (427) | 1.4% (325) | 0.4% (102) | 1.7% (634) | 2.9% (547) | 0.5% (87) |
| Apparel | 0.9% (420) | 0.6% (134) | 1.2% (286) | 0.6% (208) | 0.2% (45) | 0.9% (163) |
| Publishing, and motion picture and sound recording industries | 0.8% (366) | 0.8% (188) | 0.8% (178) | 1.0% (377) | 1.0% (196) | 1.0% (181) |
| Clothing and accessories, including shoe, stores | 0.8% (356) | 0.4% (103) | 1.1% (253) | 0.9% (321) | 0.3% (59) | 1.4% (262) |
| Electrical equipment, appliances, and components | 0.8% (355) | 0.9% (217) | 0.6% (138) | 0.8% (312) | 0.9% (169) | 0.8% (143) |
| Utilities | 0.7% (331) | 1.2% (287) | 0.2% (44) | 0.6% (227) | 0.9% (164) | 0.3% (63) |
| Pharmacies and drug stores | 0.7% (325) | 0.6% (150) | 0.7% (175) | 0.4% (166) | 0.3% (61) | 0.6% (105) |
| Miscellaneous nondurable goods merchant wholesalers | 0.6% (278) | 0.9% (209) | 0.3% (69) | 0.6% (219) | 0.7% (131) | 0.5% (88) |
| Food | 0.6% (261) | 0.7% (158) | 0.4% (103) | 0.9% (319) | 0.9% (168) | 0.8% (151) |
| Air transportation | 0.5% (256) | 0.4% (101) | 0.7% (155) | 1.1% (416) | 0.9% (170) | 1.3% (246) |
| Used merchandise, gift, novelty, and souvenir, and other miscellaneous stores | 0.5% (252) | 0.6% (152) | 0.4% (100) | 0.5% (189) | 0.4% (73) | 0.6% (116) |
| Warehousing and storage | 0.5% (241) | 1.0% (230) | 0.0% (11) | 0.4% (161) | 0.7% (141) | 0.1% (20) |
| Sporting goods, camera, and hobby and toy stores | 0.4% (198) | 0.4% (88) | 0.5% (110) | 0.3% (114) | 0.2% (46) | 0.4% (68) |
| Building material and garden equipment and supplies dealers | 0.4% (190) | 0.8% (179) | 0.0% (11) | 0.8% (296) | 1.2% (225) | 0.4% (71) |
| Other direct selling establishments | 0.4% (182) | 0.4% (98) | 0.4% (84) | 0.5% (198) | 0.4% (85) | 0.6% (113) |
| Furniture and related product manufacturing | 0.4% (174) | 0.5% (123) | 0.2% (51) | 0.6% (219) | 0.9% (167) | 0.3% (52) |
| Petroleum and coal products | 0.3% (161) | 0.6% (141) | 0.1% (20) | 0.5% (178) | 0.9% (169) | 0.0% (9) |
| Printing and related support activities | 0.3% (154) | 0.6% (154) | 0.0% (0) | 0.4% (163) | 0.6% (116) | 0.3% (47) |
| Machinery | 0.3% (148) | 0.6% (139) | 0.0% (9) | 0.9% (344) | 1.3% (242) | 0.6% (102) |
| Furniture and home furnishings, and household appliance stores | 0.3% (144) | 0.4% (100) | 0.2% (44) | 0.6% (239) | 0.6% (123) | 0.6% (116) |
| Agriculture, forestry, fishing and hunting | 0.3% (142) | 0.5% (108) | 0.1% (34) | 0.2% (90) | 0.2% (29) | 0.3% (61) |
| Radio, TV, and computer stores | 0.3% (125) | 0.3% (69) | 0.2% (56) | 0.6% (230) | 0.6% (116) | 0.6% (114) |
| Apparel, fabrics, and notions merchant wholesalers | 0.2% (106) | 0.1% (21) | 0.4% (85) | 0.3% (108) | 0.2% (32) | 0.4% (76) |
| Data processing, libraries, and other information services | 0.2% (104) | 0.3% (62) | 0.2% (42) | 0.6% (240) | 0.6% (110) | 0.7% (130) |
| Rail transportation | 0.2% (102) | 0.4% (102) | 0.0% (0) | 0.2% (59) | 0.3% (59) | 0.0% (0) |
| Gasoline stations | 0.2% (97) | 0.2% (47) | 0.2% (50) | 0.2% (90) | 0.4% (83) | 0.0% (7) |
| Textile mills and textile products | 0.2% (92) | 0.1% (32) | 0.3% (60) | 0.5% (172) | 0.2% (35) | 0.7% (137) |
| Motor vehicles, parts and supplies merchant wholesalers | 0.2% (83) | 0.4% (83) | 0.0% (0) | 0.4% (155) | 0.6% (121) | 0.2% (34) |
| Professional and commercial equipment and supplies merchant wholesalers | 0.2% (76) | 0.1% (15) | 0.3% (61) | 0.4% (142) | 0.6% (117) | 0.1% (25) |
| Vending machine operators | 0.2% (73) | 0.3% (73) | 0.0% (0) | 0.1% (33) | 0.2% (33) | 0.0% (0) |
| Drugs, sundries, and chemical and allied products merchant wholesalers | 0.1% (70) | 0.1% (30) | 0.2% (40) | 0.1% (55) | 0.2% (35) | 0.1% (20) |
| Water transportation | 0.1% (62) | 0.1% (25) | 0.2% (37) | 0.1% (25) | 0.1% (19) | 0.0% (6) |
| Plastics and rubber products | 0.1% (61) | 0.1% (25) | 0.2% (36) | 0.6% (207) | 0.5% (100) | 0.6% (107) |
| Miscellaneous durable goods merchant wholesalers | 0.1% (59) | 0.0% (0) | 0.3% (59) | 0.4% (148) | 0.5% (89) | 0.3% (59) |
| Office supplies and stationery stores | 0.1% (58) | 0.1% (35) | 0.1% (23) | 0.4% (146) | 0.4% (79) | 0.4% (67) |
| Electrical and electronic goods merchant wholesalers | 0.1% (55) | 0.1% (20) | 0.1% (35) | 0.4% (142) | 0.2% (43) | 0.5% (99) |
| Furniture and home furnishing merchant wholesalers | 0.1% (53) | 0.1% (14) | 0.2% (39) | 0.1% (53) | 0.1% (25) | 0.2% (28) |
| Wood products | 0.1% (53) | 0.2% (53) | 0.0% (0) | 0.1% (35) | 0.2% (35) | 0.0% (0) |
| Machinery, equipment, and supplies merchant wholesalers | 0.1% (48) | 0.2% (37) | 0.0% (11) | 0.6% (232) | 0.9% (172) | 0.3% (60) |
| Paper | 0.1% (43) | 0.2% (43) | 0.0% (0) | 0.3% (109) | 0.4% (67) | 0.2% (42) |
| Hardware, plumbing and heating equipment, and supplies merchant wholesalers | 0.1% (40) | 0.1% (13) | 0.1% (27) | 0.2% (66) | 0.2% (34) | 0.2% (32) |
| Fuel dealers | 0.1% (38) | 0.2% (38) | 0.0% (0) | 0.0% (0) | 0.0% (0) | 0.0% (0) |
| Management of companies and enterprises | 0.1% (30) | 0.1% (18) | 0.1% (12) | 0.1% (50) | 0.0% (0) | 0.3% (50) |
| Nonmetallic mineral products | 0.1% (30) | 0.0% (9) | 0.1% (21) | 0.5% (187) | 0.7% (142) | 0.2% (45) |
| Beverage and tobacco products | 0.1% (24) | 0.0% (10) | 0.1% (14) | 0.1% (45) | 0.1% (19) | 0.1% (26) |
| Jewelry, luggage, and leather goods stores | 0.0% (22) | 0.1% (15) | 0.0% (7) | 0.1% (41) | 0.1% (28) | 0.1% (13) |
| Metals and minerals, except petroleum, merchant wholesalers | 0.0% (19) | 0.1% (19) | 0.0% (0) | 0.1% (29) | 0.1% (24) | 0.0% (5) |
| Paper and paper products merchant wholesalers | 0.0% (18) | 0.1% (18) | 0.0% (0) | 0.1% (55) | 0.2% (29) | 0.1% (26) |
| Mining, quarrying, and oil and gas extraction | 0.0% (13) | 0.1% (13) | 0.0% (0) | 0.1% (49) | 0.2% (40) | 0.0% (9) |
| Health and personal care, except drug, stores | 0.0% (11) | 0.0% (0) | 0.0% (11) | 0.3% (96) | 0.2% (30) | 0.4% (66) |
| Music stores | 0.0% (0) | 0.0% (0) | 0.0% (0) | 0.1% (38) | 0.0% (6) | 0.2% (32) |
| Petroleum and petroleum products merchant wholesalers | 0.0% (0) | 0.0% (0) | 0.0% (0) | 0.1% (35) | 0.2% (35) | 0.0% (0) |
| Recyclable material merchant wholesalers | 0.0% (0) | 0.0% (0) | 0.0% (0) | 0.1% (40) | 0.2% (40) | 0.0% (0) |
Unemployment in Carson
- Unemployment by race in 2022
- Unemployment rate for White non-Hispanic residents
- 6.3%Males
- 11.0%Females
- Unemployment rate for Black residents
- 7.8%Males
- 9.5%Females
- Unemployment rate for American Indian and Alaska Native residents
- 5.3%Females
- Unemployment rate for Asian residents
- 8.1%Males
- 1.7%Females
- Unemployment rate for other race residents
- 6.2%Males
- 13.5%Females
- Unemployment rate for two or more race residents
- 9.7%Males
- 6.6%Females
- Unemployment rate for Hispanic or Latino residents
- 6.6%Males
- 9.8%Females
- Unemployment by race in 2000
- Unemployment rate for White non-Hispanic residents
- 7.0%Males
- 6.9%Females
- Unemployment rate for Black residents
- 11.8%Males
- 6.5%Females
- Unemployment rate for American Indian and Alaska Native residents
- 16.2%Males
- 23.0%Females
- Unemployment rate for Asian residents
- 4.7%Males
- 4.2%Females
- Unemployment rate for other race residents
- 8.9%Males
- 8.3%Females
- Unemployment rate for two or more race residents
- 11.8%Males
- 8.9%Females
- Unemployment rate for Hispanic or Latino residents
- 9.1%Males
- 9.4%Females
Unemployment in 2023:
| Carson: | 4.9% |
| California: | 5.1% |
Unemployment in 2022:
| Carson: | 5.2% |
| California: | 4.2% |
Unemployment in 2021:
| Carson: | 9.9% |
| California: | 7.3% |
Unemployment in 2020:
| Carson: | 13.1% |
| California: | 10.1% |
Unemployment in 2019:
| Carson: | 4.9% |
| California: | 4.1% |
Unemployment in 2018:
| Carson: | 4.9% |
| California: | 4.2% |
Unemployment in 2017:
| Carson: | 5.0% |
| California: | 4.8% |
Unemployment in 2016:
| Carson: | 5.7% |
| California: | 5.5% |
Unemployment in 2015:
| Carson: | 8.6% |
| California: | 6.3% |
Unemployment in 2014:
| Carson: | 10.5% |
| California: | 7.6% |
Unemployment in 2013:
| Carson: | 12.5% |
| California: | 9.0% |
Unemployment in 2012:
| Carson: | 14.0% |
| California: | 10.5% |
Unemployment in 2011:
| Carson: | 15.5% |
| California: | 11.9% |
Unemployment in 2010:
| Carson: | 15.9% |
| California: | 12.5% |
Unemployment in 2009:
| Carson: | 11.8% |
| California: | 11.5% |
Unemployment in 2008:
| Carson: | 7.6% |
| California: | 7.3% |
Unemployment in 2007:
| Carson: | 5.2% |
| California: | 5.3% |
Unemployment in 2006:
| Carson: | 4.8% |
| California: | 4.9% |
Unemployment in 2005:
| Carson: | 5.4% |
| California: | 5.4% |
Unemployment in 2004:
| Carson: | 6.5% |
| California: | 6.2% |
Unemployment in 2003:
| Carson: | 7.1% |
| California: | 6.9% |
Unemployment in 2002:
| Carson: | 6.9% |
| California: | 6.8% |
Unemployment in 2001:
| Carson: | 5.8% |
| California: | 5.5% |
Unemployment in 2000:
| Carson: | 5.4% |
| California: | 4.9% |
Unemployment in 1999:
| Carson: | 5.8% |
| California: | 5.3% |
Unemployment in 1998:
| Carson: | 6.4% |
| California: | 5.9% |
Unemployment in 1997:
| Carson: | 6.7% |
| California: | 6.4% |
Unemployment in 1996:
| Carson: | 8.0% |
| California: | 7.3% |
Unemployment in 1995:
| Carson: | 7.9% |
| California: | 7.9% |
Unemployment in 1994:
| Carson: | 9.0% |
| California: | 8.7% |
Unemployment in 1993:
| Carson: | 9.8% |
| California: | 9.5% |
Unemployment in 1992:
| Carson: | 9.6% |
| California: | 9.4% |
Unemployment in 1991:
| Carson: | 7.8% |
| California: | 7.8% |
Unemployment in 1990:
| Carson: | 5.8% |
| California: | 5.8% |
Time leaving home to go to work
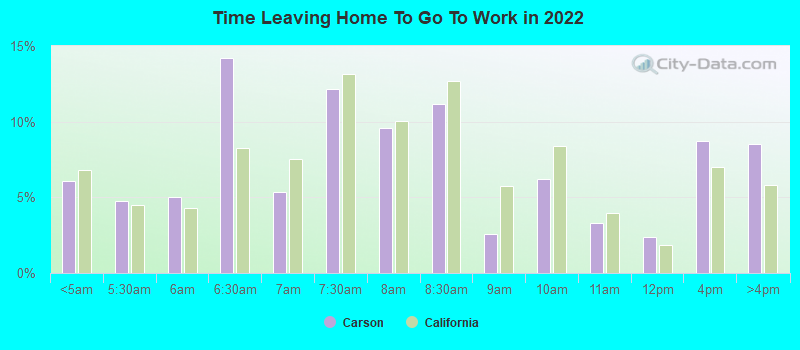
12:00 a.m. to 4:59 a.m.:
| Carson: | 6.1% (2,385) |
| California: | 6.8% (1,050,902) |
5:00 a.m. to 5:29 a.m.:
| Carson: | 4.8% (1,869) |
| California: | 4.5% (692,772) |
5:30 a.m. to 5:59 a.m.:
| Carson: | 5.0% (1,964) |
| California: | 4.3% (665,475) |
6:00 a.m. to 6:29 a.m.:
| Carson: | 14.2% (5,575) |
| California: | 8.3% (1,273,588) |
6:30 a.m. to 6:59 a.m.:
| Carson: | 5.3% (2,092) |
| California: | 7.5% (1,156,338) |
7:00 a.m. to 7:29 a.m.:
| Carson: | 12.2% (4,787) |
| California: | 13.2% (2,027,702) |
7:30 a.m. to 7:59 a.m.:
| Carson: | 9.6% (3,753) |
| California: | 10.1% (1,550,402) |
8:00 a.m. to 8:29 a.m.:
| Carson: | 11.2% (4,395) |
| California: | 12.7% (1,953,986) |
8:30 a.m. to 8:59 a.m.:
| Carson: | 2.6% (1,024) |
| California: | 5.8% (890,950) |
9:00 a.m. to 9:59 a.m.:
| Carson: | 6.2% (2,445) |
| California: | 8.4% (1,288,499) |
10:00 a.m. to 10:59 a.m.:
| Carson: | 3.3% (1,287) |
| California: | 4.0% (613,193) |
11:00 a.m. to 11:59 a.m.:
| Carson: | 2.4% (931) |
| California: | 1.8% (280,975) |
12:00 p.m. to 3:59 p.m.:
| Carson: | 8.7% (3,418) |
| California: | 7.0% (1,075,505) |
4:00 p.m. to 11:59 p.m.:
| Carson: | 8.5% (3,344) |
| California: | 5.8% (891,240) |
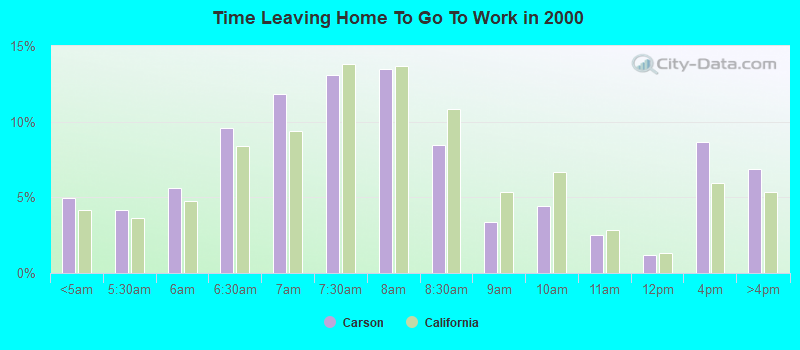
<5am:
| Carson: | 5.0% (1,815) |
| California: | 4.2% (606,086) |
5:30am:
| Carson: | 4.2% (1,520) |
| California: | 3.6% (523,209) |
6am:
| Carson: | 5.6% (2,049) |
| California: | 4.8% (692,256) |
6:30am:
| Carson: | 9.6% (3,495) |
| California: | 8.4% (1,216,867) |
7am:
| Carson: | 11.8% (4,321) |
| California: | 9.4% (1,362,830) |
7:30am:
| Carson: | 13.1% (4,777) |
| California: | 13.8% (2,006,950) |
8am:
| Carson: | 13.5% (4,921) |
| California: | 13.7% (1,986,831) |
8:30am:
| Carson: | 8.5% (3,098) |
| California: | 10.9% (1,577,815) |
9am:
| Carson: | 3.4% (1,225) |
| California: | 5.4% (778,152) |
10am:
| Carson: | 4.4% (1,609) |
| California: | 6.7% (972,355) |
11am:
| Carson: | 2.5% (925) |
| California: | 2.9% (414,479) |
12pm:
| Carson: | 1.2% (442) |
| California: | 1.3% (189,005) |
4pm:
| Carson: | 8.6% (3,150) |
| California: | 6.0% (865,284) |
>4pm:
| Carson: | 6.9% (2,505) |
| California: | 5.3% (776,167) |
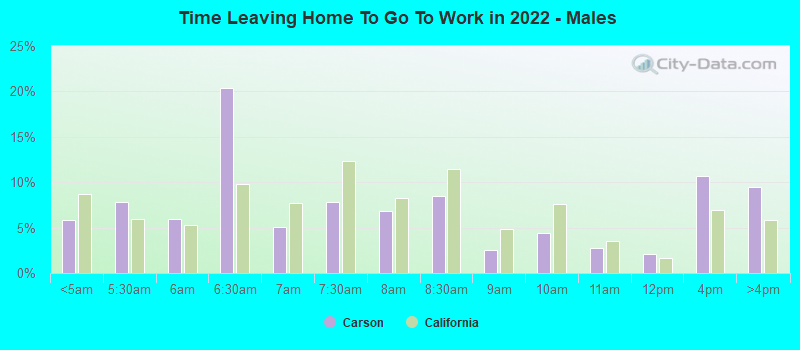
12:00 a.m. to 4:59 a.m. - Males:
| Carson: | 5.8% (1,237) |
| California: | 8.7% (747,612) |
5:00 a.m. to 5:29 a.m. - Males:
| Carson: | 7.8% (1,656) |
| California: | 6.0% (509,420) |
5:30 a.m. to 5:59 a.m. - Males:
| Carson: | 6.0% (1,274) |
| California: | 5.2% (448,269) |
6:00 a.m. to 6:29 a.m. - Males:
| Carson: | 20.3% (4,328) |
| California: | 9.8% (842,941) |
6:30 a.m. to 6:59 a.m. - Males:
| Carson: | 5.0% (1,072) |
| California: | 7.7% (657,557) |
7:00 a.m. to 7:29 a.m. - Males:
| Carson: | 7.8% (1,668) |
| California: | 12.4% (1,058,532) |
7:30 a.m. to 7:59 a.m. - Males:
| Carson: | 6.8% (1,445) |
| California: | 8.2% (702,727) |
8:00 a.m. to 8:29 a.m. - Males:
| Carson: | 8.5% (1,805) |
| California: | 11.5% (984,538) |
8:30 a.m. to 8:59 a.m. - Males:
| Carson: | 2.5% (541) |
| California: | 4.8% (414,815) |
9:00 a.m. to 9:59 a.m. - Males:
| Carson: | 4.5% (951) |
| California: | 7.7% (655,038) |
10:00 a.m. to 10:59 a.m. - Males:
| Carson: | 2.8% (592) |
| California: | 3.5% (301,425) |
11:00 a.m. to 11:59 a.m. - Males:
| Carson: | 2.0% (435) |
| California: | 1.7% (141,620) |
12:00 p.m. to 3:59 p.m. - Males:
| Carson: | 10.7% (2,282) |
| California: | 7.0% (594,847) |
4:00 p.m. to 11:59 p.m. - Males:
| Carson: | 9.5% (2,016) |
| California: | 5.8% (499,471) |
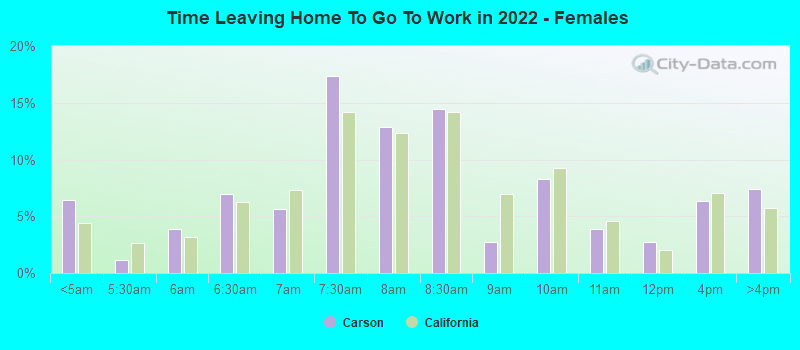
12:00 a.m. to 4:59 a.m. - Females:
| Carson: | 6.4% (1,148) |
| California: | 4.4% (303,290) |
5:00 a.m. to 5:29 a.m. - Females:
| Carson: | 1.2% (213) |
| California: | 2.7% (183,352) |
5:30 a.m. to 5:59 a.m. - Females:
| Carson: | 3.8% (690) |
| California: | 3.2% (217,206) |
6:00 a.m. to 6:29 a.m. - Females:
| Carson: | 6.9% (1,247) |
| California: | 6.3% (430,647) |
6:30 a.m. to 6:59 a.m. - Females:
| Carson: | 5.7% (1,020) |
| California: | 7.3% (498,781) |
7:00 a.m. to 7:29 a.m. - Females:
| Carson: | 17.4% (3,119) |
| California: | 14.1% (969,170) |
7:30 a.m. to 7:59 a.m. - Females:
| Carson: | 12.8% (2,308) |
| California: | 12.4% (847,675) |
8:00 a.m. to 8:29 a.m. - Females:
| Carson: | 14.4% (2,590) |
| California: | 14.1% (969,448) |
8:30 a.m. to 8:59 a.m. - Females:
| Carson: | 2.7% (483) |
| California: | 6.9% (476,135) |
9:00 a.m. to 9:59 a.m. - Females:
| Carson: | 8.3% (1,494) |
| California: | 9.2% (633,461) |
10:00 a.m. to 10:59 a.m. - Females:
| Carson: | 3.9% (695) |
| California: | 4.5% (311,768) |
11:00 a.m. to 11:59 a.m. - Females:
| Carson: | 2.8% (496) |
| California: | 2.0% (139,355) |
12:00 p.m. to 3:59 p.m. - Females:
| Carson: | 6.3% (1,136) |
| California: | 7.0% (480,658) |
4:00 p.m. to 11:59 p.m. - Females:
| Carson: | 7.4% (1,328) |
| California: | 5.7% (391,769) |
Travel time to work
Percentage of workers working in this county: 93.0%
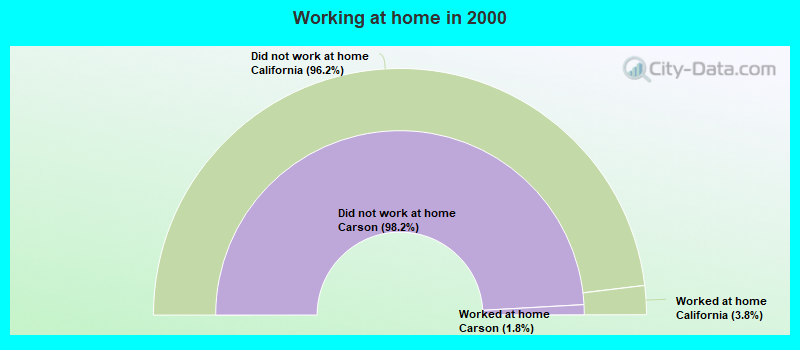
Number of people working at home: 3,303 (7.8% of all workers)
Daytime population change due to commuting: +14,445 (+16.1%)
Workers who live and work in this city: 5,635 (15.4%)
Number of people working at home: 3,303 (7.8% of all workers)
Daytime population change due to commuting: +14,445 (+16.1%)
Workers who live and work in this city: 5,635 (15.4%)
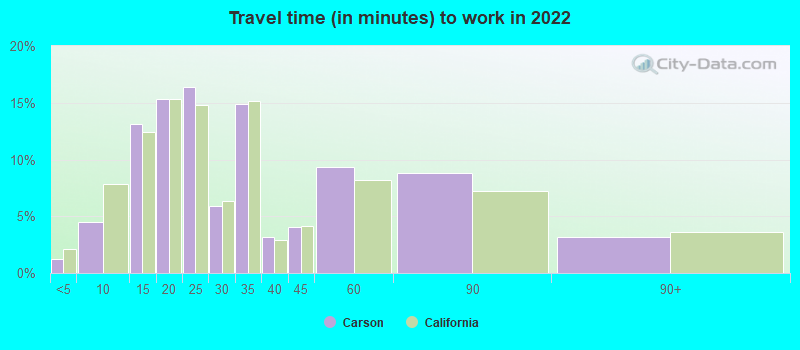
Less than 5 minutes:
| Carson: | 1.2% (735) |
| California: | 2.1% (323,064) |
5 to 9 minutes:
| Carson: | 4.5% (2,657) |
| California: | 7.8% (1,208,682) |
10 to 14 minutes:
| Carson: | 13.1% (7,773) |
| California: | 12.4% (1,917,610) |
15 to 19 minutes:
| Carson: | 15.3% (9,073) |
| California: | 15.3% (2,367,483) |
20 to 24 minutes:
| Carson: | 16.4% (9,722) |
| California: | 14.8% (2,279,693) |
25 to 29 minutes:
| Carson: | 5.9% (3,498) |
| California: | 6.4% (981,997) |
30 to 34 minutes:
| Carson: | 14.9% (8,831) |
| California: | 15.2% (2,339,223) |
35 to 39 minutes:
| Carson: | 3.2% (1,890) |
| California: | 2.9% (453,226) |
40 to 44 minutes:
| Carson: | 4.0% (2,386) |
| California: | 4.1% (637,781) |
45 to 59 minutes:
| Carson: | 9.4% (5,551) |
| California: | 8.2% (1,259,482) |
60 to 89 minutes:
| Carson: | 8.8% (5,201) |
| California: | 7.2% (1,111,698) |
90 or more minutes:
| Carson: | 3.2% (1,893) |
| California: | 3.6% (552,805) |
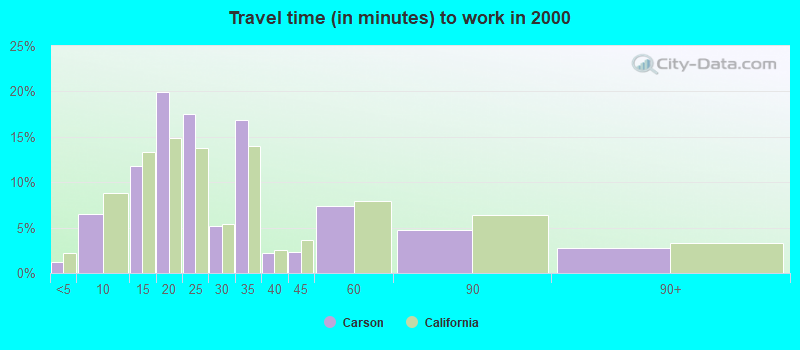
Less than 5 minutes:
| Carson: | 1.2% (432) |
| California: | 2.2% (324,703) |
5 to 9 minutes:
| Carson: | 6.5% (2,365) |
| California: | 8.8% (1,280,443) |
10 to 14 minutes:
| Carson: | 11.8% (4,290) |
| California: | 13.3% (1,930,263) |
15 to 19 minutes:
| Carson: | 19.9% (7,255) |
| California: | 14.9% (2,157,970) |
20 to 24 minutes:
| Carson: | 17.5% (6,380) |
| California: | 13.8% (2,004,060) |
25 to 29 minutes:
| Carson: | 5.2% (1,891) |
| California: | 5.4% (782,241) |
30 to 34 minutes:
| Carson: | 16.9% (6,164) |
| California: | 13.9% (2,025,657) |
35 to 39 minutes:
| Carson: | 2.2% (786) |
| California: | 2.5% (366,487) |
40 to 44 minutes:
| Carson: | 2.3% (854) |
| California: | 3.6% (528,043) |
45 to 59 minutes:
| Carson: | 7.4% (2,693) |
| California: | 7.9% (1,151,598) |
60 to 89 minutes:
| Carson: | 4.7% (1,733) |
| California: | 6.4% (933,123) |
90 or more minutes:
| Carson: | 2.8% (1,009) |
| California: | 3.3% (483,698) |
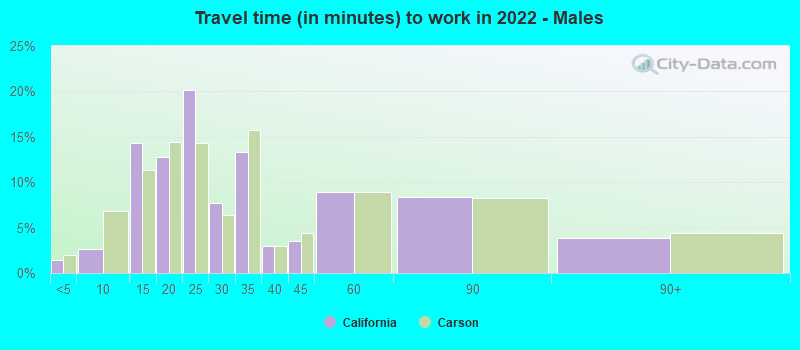
Less than 5 minutes - Males:
| Carson: | 1.4% (530) |
| California: | 2.0% (173,603) |
5 to 9 minutes - Males:
| Carson: | 2.7% (974) |
| California: | 6.8% (580,822) |
10 to 14 minutes - Males:
| Carson: | 14.4% (5,250) |
| California: | 11.4% (974,497) |
15 to 19 minutes - Males:
| Carson: | 12.7% (4,661) |
| California: | 14.5% (1,239,386) |
20 to 24 minutes - Males:
| Carson: | 20.1% (7,355) |
| California: | 14.3% (1,223,429) |
25 to 29 minutes - Males:
| Carson: | 7.8% (2,840) |
| California: | 6.4% (545,844) |
30 to 34 minutes - Males:
| Carson: | 13.4% (4,889) |
| California: | 15.8% (1,352,210) |
35 to 39 minutes - Males:
| Carson: | 3.0% (1,089) |
| California: | 3.0% (253,732) |
40 to 44 minutes - Males:
| Carson: | 3.5% (1,290) |
| California: | 4.4% (376,144) |
45 to 59 minutes - Males:
| Carson: | 8.9% (3,258) |
| California: | 8.9% (762,659) |
60 to 89 minutes - Males:
| Carson: | 8.3% (3,043) |
| California: | 8.3% (711,394) |
90 or more minutes - Males:
| Carson: | 3.8% (1,406) |
| California: | 4.4% (378,954) |
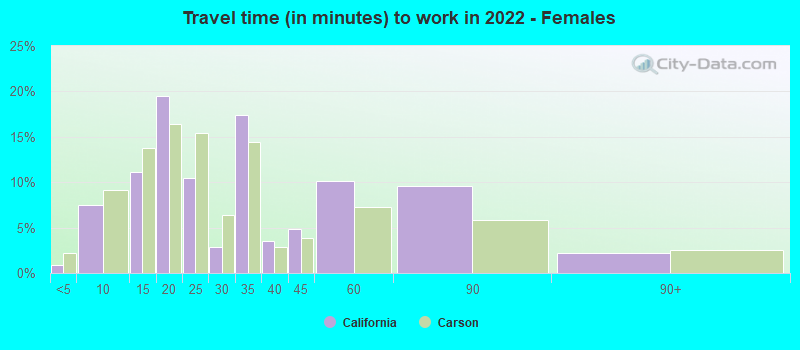
Less than 5 minutes - Females:
| Carson: | 0.9% (205) |
| California: | 2.2% (149,461) |
5 to 9 minutes - Females:
| Carson: | 7.4% (1,683) |
| California: | 9.2% (627,860) |
10 to 14 minutes - Females:
| Carson: | 11.2% (2,523) |
| California: | 13.7% (943,113) |
15 to 19 minutes - Females:
| Carson: | 19.5% (4,412) |
| California: | 16.4% (1,128,097) |
20 to 24 minutes - Females:
| Carson: | 10.5% (2,367) |
| California: | 15.4% (1,056,264) |
25 to 29 minutes - Females:
| Carson: | 2.9% (658) |
| California: | 6.4% (436,153) |
30 to 34 minutes - Females:
| Carson: | 17.4% (3,942) |
| California: | 14.4% (987,013) |
35 to 39 minutes - Females:
| Carson: | 3.5% (801) |
| California: | 2.9% (199,494) |
40 to 44 minutes - Females:
| Carson: | 4.8% (1,096) |
| California: | 3.8% (261,637) |
45 to 59 minutes - Females:
| Carson: | 10.1% (2,293) |
| California: | 7.2% (496,823) |
60 to 89 minutes - Females:
| Carson: | 9.5% (2,158) |
| California: | 5.8% (400,304) |
90 or more minutes - Females:
| Carson: | 2.2% (487) |
| California: | 2.5% (173,851) |
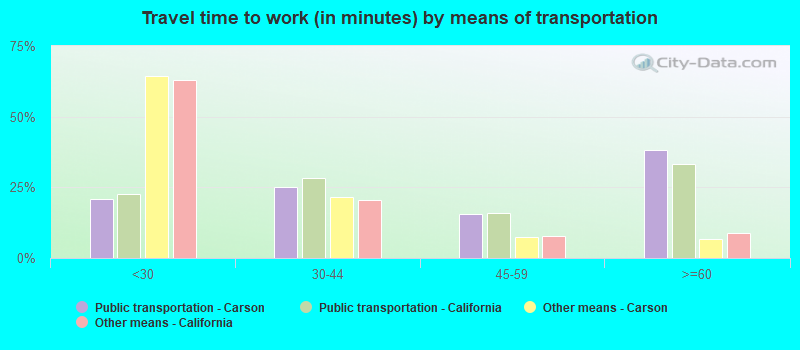
Means of transportation to work
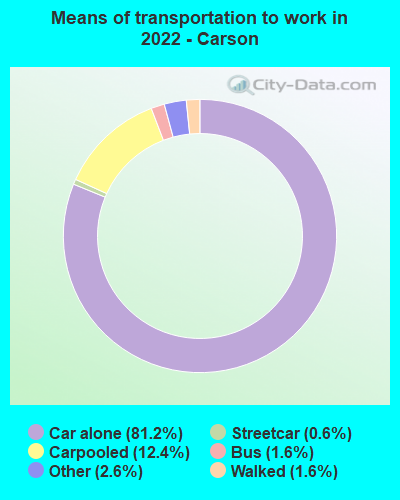

Drove car alone:
| Carson: | 81.2% (48,074) |
| California: | 79.1% (5,345,368) |
Carpooled:
| Carson: | 12.4% (7,315) |
| California: | 11.9% (878,699) |
Bus:
| Carson: | 1.6% (922) |
| California: | 2.2% (170,574) |
Subway or elevated rail:
| Carson: | 0.6% (347) |
| California: | 0.6% (40,665) |
Long-distance train or commuter rail:
| Carson: | 0.1% (55) |
| California: | 0.2% (16,750) |
Walked:
| Carson: | 1.6% (962) |
| California: | 2.9% (218,374) |
Other means:
| Carson: | 2.6% (1,535) |
| California: | 2.1% (137,489) |
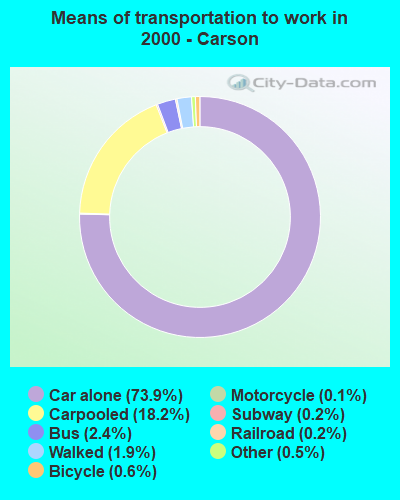

Drove car alone:
| Carson: | 73.9% (26,989) |
| California: | 71.8% (10,432,462) |
Carpooled:
| Carson: | 18.2% (6,627) |
| California: | 14.5% (2,113,313) |
Bus or trolley bus:
| Carson: | 2.4% (890) |
| California: | 3.8% (549,425) |
Streetcar or trolley car:
| Carson: | 0.1% (22) |
| California: | 0.1% (21,158) |
Subway or elevated:
| Carson: | 0.2% (65) |
| California: | 0.7% (107,711) |
Railroad:
| Carson: | 0.2% (79) |
| California: | 0.3% (41,022) |
Taxicab:
| Carson: | 0.0% (14) |
| California: | 0.1% (9,890) |
Motorcycle:
| Carson: | 0.1% (37) |
| California: | 0.2% (36,262) |
Bicycle:
| Carson: | 0.6% (230) |
| California: | 0.8% (120,567) |
Walked:
| Carson: | 1.9% (709) |
| California: | 2.9% (414,581) |
Other means:
| Carson: | 0.5% (190) |
| California: | 0.8% (115,064) |
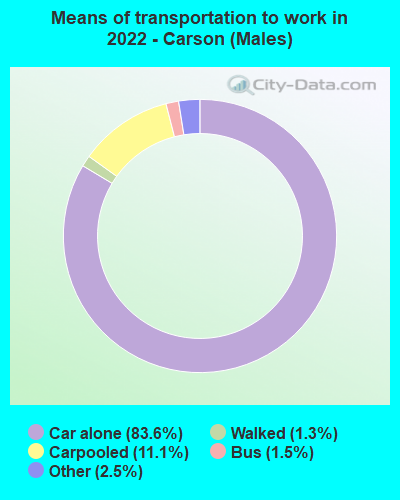

Drove car alone - Males:
| Carson: | 83.6% (30,589) |
| California: | 80.0% (5,345,368) |
Carpooled - Males:
| Carson: | 11.1% (4,053) |
| California: | 11.1% (878,699) |
Bus - Males:
| Carson: | 1.5% (561) |
| California: | 2.0% (170,574) |
Walked - Males:
| Carson: | 1.3% (482) |
| California: | 2.7% (218,374) |
Other means - Males:
| Carson: | 2.5% (900) |
| California: | 2.1% (137,489) |
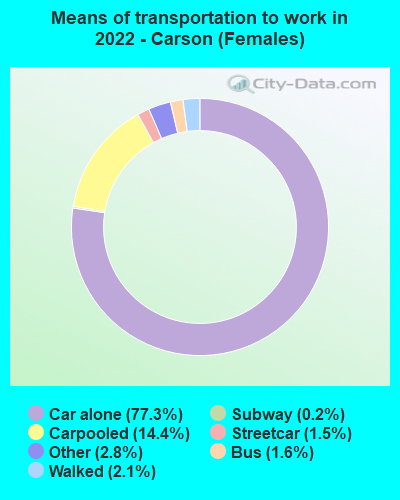

Drove car alone - Females:
| Carson: | 77.3% (17,485) |
| California: | 77.9% (5,345,368) |
Carpooled - Females:
| Carson: | 14.4% (3,262) |
| California: | 12.8% (878,699) |
Bus - Females:
| Carson: | 1.6% (361) |
| California: | 2.5% (170,574) |
Subway or elevated rail - Females:
| Carson: | 1.5% (347) |
| California: | 0.6% (40,665) |
Long-distance train or commuter rail - Females:
| Carson: | 0.2% (55) |
| California: | 0.2% (16,750) |
Walked - Females:
| Carson: | 2.1% (480) |
| California: | 3.2% (218,374) |
Other means - Females:
| Carson: | 2.8% (635) |
| California: | 2.0% (137,489) |
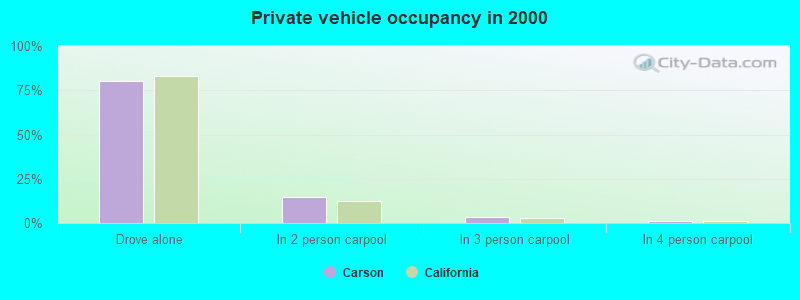
Private vehicle occupancy
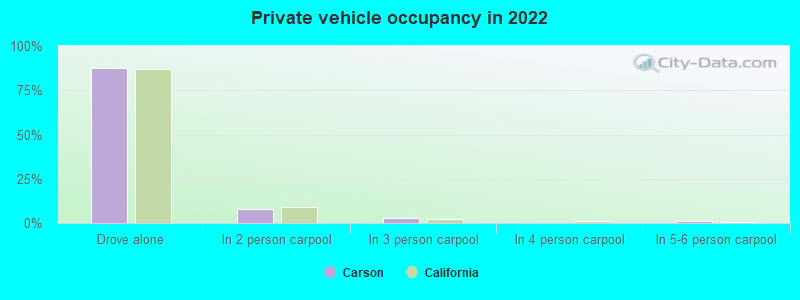
Drove alone:
| Carson: | 87.7% (31,777) |
| California: | 86.9% (12,187,486) |
In 2 person carpool:
| Carson: | 7.8% (2,824) |
| California: | 9.2% (1,295,561) |
In 3 person carpool:
| Carson: | 2.9% (1,033) |
| California: | 2.2% (309,969) |
In 4 person carpool:
| Carson: | 0.2% (86) |
| California: | 0.9% (126,987) |
In 5-6 person carpool:
| Carson: | 1.2% (440) |
| California: | 0.5% (70,825) |
In 7+ person carpool:
| Carson: | 0.2% (75) |
| California: | 0.2% (28,258) |
Drove alone:
| Carson: | 80.3% (26,989) |
| California: | 83.2% (10,432,462) |
In 2 person carpool:
| Carson: | 14.4% (4,856) |
| California: | 12.5% (1,564,905) |
In 3 person carpool:
| Carson: | 3.5% (1,163) |
| California: | 2.6% (330,732) |
In 4 person carpool:
| Carson: | 0.9% (295) |
| California: | 1.0% (119,364) |
In 5-6 person carpool:
| Carson: | 0.4% (129) |
| California: | 0.5% (57,036) |
In 7+ person carpool:
| Carson: | 0.5% (184) |
| California: | 0.3% (41,276) |
Class of workers
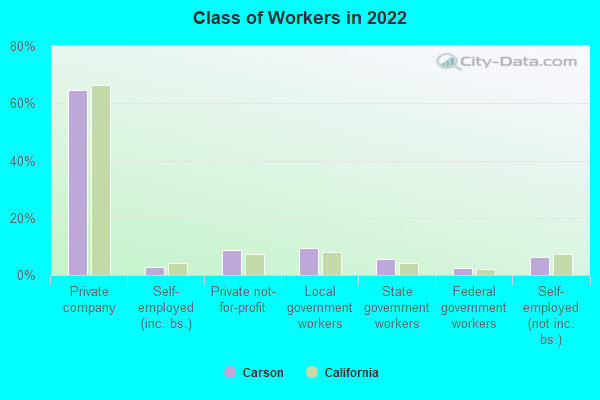
Employee of private company:
| Carson: | 64.5% (28,474) |
| California: | 66.5% (12,596,030) |
Self-employed in own incorporated business:
| Carson: | 2.9% (1,283) |
| California: | 4.1% (784,709) |
Private not-for-profit wage and salary workers:
| Carson: | 8.7% (3,840) |
| California: | 7.5% (1,417,407) |
Local government workers:
| Carson: | 9.3% (4,114) |
| California: | 8.2% (1,547,056) |
State government workers:
| Carson: | 5.6% (2,462) |
| California: | 4.1% (780,915) |
Federal government workers:
| Carson: | 2.5% (1,089) |
| California: | 2.0% (369,858) |
Self-employed workers in own not incorporated business:
| Carson: | 6.3% (2,783) |
| California: | 7.4% (1,410,735) |
Unpaid family workers:
| Carson: | 0.2% (107) |
| California: | 0.2% (36,267) |
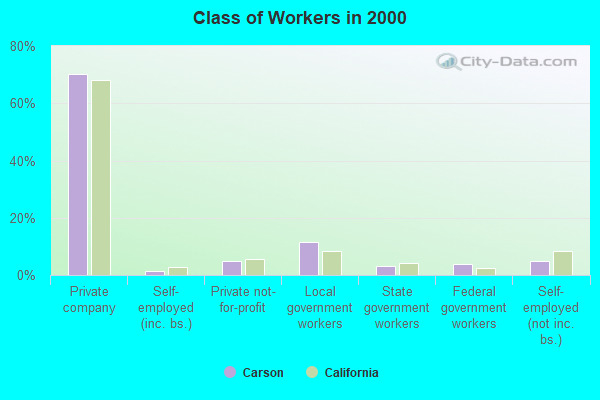
Employee of private company:
| Carson: | 70.4% (26,245) |
| California: | 68.0% (10,009,465) |
Self-employed in own incorporated business:
| Carson: | 1.5% (562) |
| California: | 2.7% (402,392) |
Private not-for-profit wage and salary workers:
| Carson: | 4.8% (1,805) |
| California: | 5.7% (845,536) |
Local government workers:
| Carson: | 11.4% (4,238) |
| California: | 8.3% (1,218,764) |
State government workers:
| Carson: | 3.0% (1,109) |
| California: | 4.0% (594,953) |
Federal government workers:
| Carson: | 3.7% (1,398) |
| California: | 2.3% (344,354) |
Self-employed workers in own not incorporated business:
| Carson: | 4.9% (1,840) |
| California: | 8.5% (1,249,530) |
Unpaid family workers:
| Carson: | 0.3% (103) |
| California: | 0.4% (53,934) |
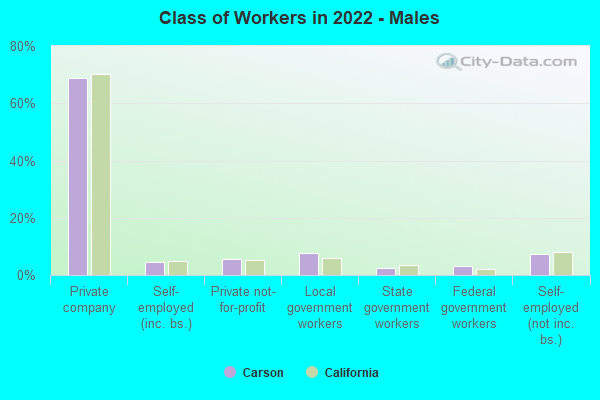
Employee of private company - Males:
| Carson: | 68.9% (16,041) |
| California: | 70.3% (7,191,252) |
Self-employed in own incorporated business - Males:
| Carson: | 4.7% (1,096) |
| California: | 4.9% (504,764) |
Private not-for-profit wage and salary workers - Males:
| Carson: | 5.6% (1,298) |
| California: | 5.2% (529,122) |
Local government workers - Males:
| Carson: | 7.6% (1,759) |
| California: | 6.0% (610,331) |
State government workers - Males:
| Carson: | 2.5% (583) |
| California: | 3.4% (343,636) |
Federal government workers - Males:
| Carson: | 3.1% (725) |
| California: | 2.1% (209,874) |
Self-employed workers in own not incorporated business - Males:
| Carson: | 7.4% (1,723) |
| California: | 8.1% (824,359) |
Unpaid family workers - Males:
| Carson: | 0.3% (70) |
| California: | 0.2% (17,922) |
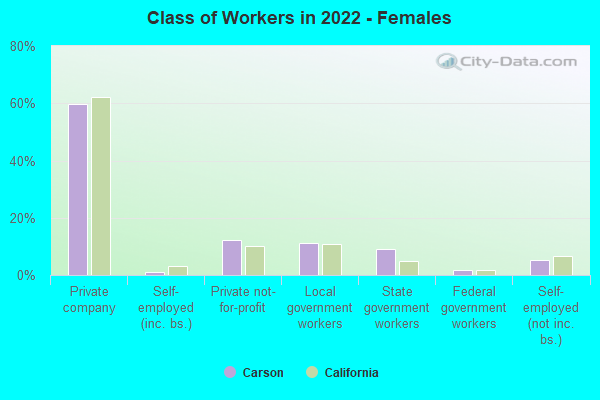
Employee of private company - Females:
| Carson: | 59.6% (12,433) |
| California: | 62.0% (5,404,778) |
Self-employed in own incorporated business - Females:
| Carson: | 0.9% (187) |
| California: | 3.2% (279,945) |
Private not-for-profit wage and salary workers - Females:
| Carson: | 12.2% (2,542) |
| California: | 10.2% (888,285) |
Local government workers - Females:
| Carson: | 11.3% (2,355) |
| California: | 10.8% (936,725) |
State government workers - Females:
| Carson: | 9.0% (1,879) |
| California: | 5.0% (437,279) |
Federal government workers - Females:
| Carson: | 1.7% (364) |
| California: | 1.8% (159,984) |
Self-employed workers in own not incorporated business - Females:
| Carson: | 5.1% (1,060) |
| California: | 6.7% (586,376) |
Unpaid family workers - Females:
| Carson: | 0.2% (37) |
| California: | 0.2% (18,345) |