Work and Jobs in Danville, Georgia (GA) Detailed Stats
Occupations, Industries, Unemployment, Workers, Commute
Settings
X


Recent posts about work in Danville, Georgia on our local forum with over 2,400,000 registered users:
 | Atlanta MSA one of few top metros growing (296 replies) |
| Moving from California to Atlanta (64 replies) |
| Eastern Wharf News, Updates and Observations (15 replies) |
| Considering move from SF Bay Area to Atlanta suburbs (18 replies) |
| Affluent Black Suburbs? (77 replies) |
| Torn over move to N. California (43 replies) |
Latest news about work in Danville, GA collected exclusively by city-data.com from local newspapers, TV, and radio stations
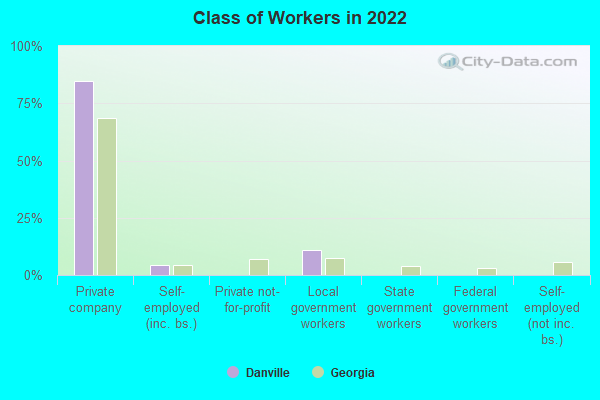
The most common industries in Danville are: Health care (9.1% of civilian employees), Public administration (8.3% of civilian employees), Educational services (6.8% of civilian employees). 14.3% of workers work in Twiggs County. 84.8% of workers are employees of private companies, which is 19.1% greater than the rate of 68.6% across the entire state of Georgia.
Whole page based on the data from 2000 / 2022 when the population of Danville, Georgia was 373 / 189
Whole page based on the data from 2000 / 2022 when the population of Danville, Georgia was 373 / 189
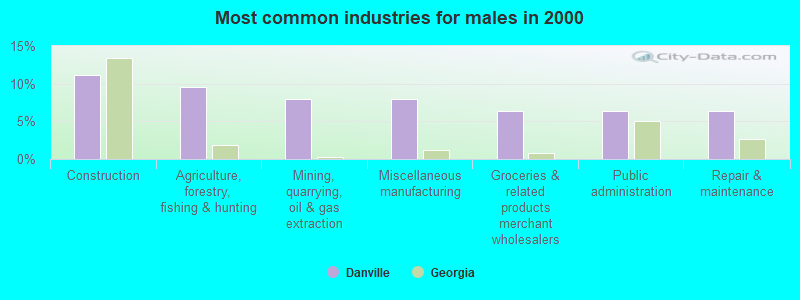
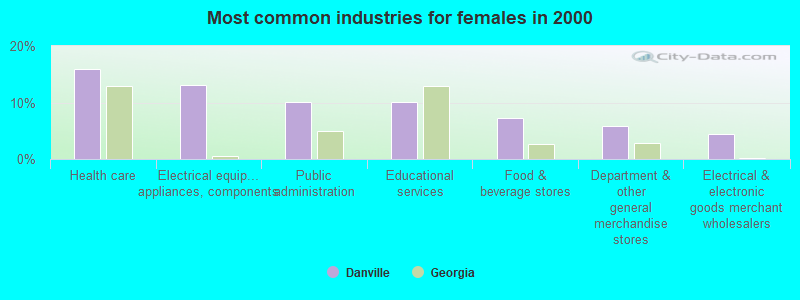
Most common industries

Most common industries | |||
|---|---|---|---|
Industry | All | Males | Females |
| Health care | 9.1% (12) | 1.6% (1) | 15.9% (11) |
| Public administration | 8.3% (11) | 6.3% (4) | 10.1% (7) |
| Educational services | 6.8% (9) | 3.2% (2) | 10.1% (7) |
| Electrical equipment, appliances, and components | 6.8% (9) | 0.0% (0) | 13.0% (9) |
| Food and beverage stores | 6.1% (8) | 4.8% (3) | 7.2% (5) |
| Construction | 5.3% (7) | 11.1% (7) | 0.0% (0) |
| Agriculture, forestry, fishing and hunting | 4.5% (6) | 9.5% (6) | 0.0% (0) |
| Miscellaneous manufacturing | 4.5% (6) | 7.9% (5) | 1.4% (1) |
| Mining, quarrying, and oil and gas extraction | 3.8% (5) | 7.9% (5) | 0.0% (0) |
| Religious, grantmaking, civic, professional, and similar organizations | 3.0% (4) | 4.8% (3) | 1.4% (1) |
| Apparel | 3.0% (4) | 3.2% (2) | 2.9% (2) |
| Repair and maintenance | 3.0% (4) | 6.3% (4) | 0.0% (0) |
| Department and other general merchandise stores | 3.0% (4) | 0.0% (0) | 5.8% (4) |
| Groceries and related products merchant wholesalers | 3.0% (4) | 6.3% (4) | 0.0% (0) |
| Metal and metal products | 2.3% (3) | 0.0% (0) | 4.3% (3) |
| Broadcasting and telecommunications | 2.3% (3) | 4.8% (3) | 0.0% (0) |
| Other transportation, and support activities, and couriers | 2.3% (3) | 0.0% (0) | 4.3% (3) |
| Electrical and electronic goods merchant wholesalers | 2.3% (3) | 0.0% (0) | 4.3% (3) |
| Beverage and tobacco products | 1.5% (2) | 3.2% (2) | 0.0% (0) |
| Textile mills and textile products | 1.5% (2) | 3.2% (2) | 0.0% (0) |
| Social assistance | 1.5% (2) | 0.0% (0) | 2.9% (2) |
| Professional, scientific, and technical services | 1.5% (2) | 0.0% (0) | 2.9% (2) |
| Nonmetallic mineral products | 1.5% (2) | 0.0% (0) | 2.9% (2) |
| Machinery | 1.5% (2) | 3.2% (2) | 0.0% (0) |
| Real estate and rental and leasing | 1.5% (2) | 3.2% (2) | 0.0% (0) |
| Finance and insurance | 1.5% (2) | 0.0% (0) | 2.9% (2) |
| Furniture and related product manufacturing | 1.5% (2) | 0.0% (0) | 2.9% (2) |
| Lumber and other construction materials merchant wholesalers | 1.5% (2) | 3.2% (2) | 0.0% (0) |
| Clothing and accessories, including shoe, stores | 1.5% (2) | 3.2% (2) | 0.0% (0) |
| Building material and garden equipment and supplies dealers | 0.8% (1) | 0.0% (0) | 1.4% (1) |
| Accommodation and food services | 0.8% (1) | 0.0% (0) | 1.4% (1) |
| Private households | 0.8% (1) | 0.0% (0) | 1.4% (1) |
| Truck transportation | 0.8% (1) | 1.6% (1) | 0.0% (0) |
| Transportation equipment | 0.8% (1) | 1.6% (1) | 0.0% (0) |
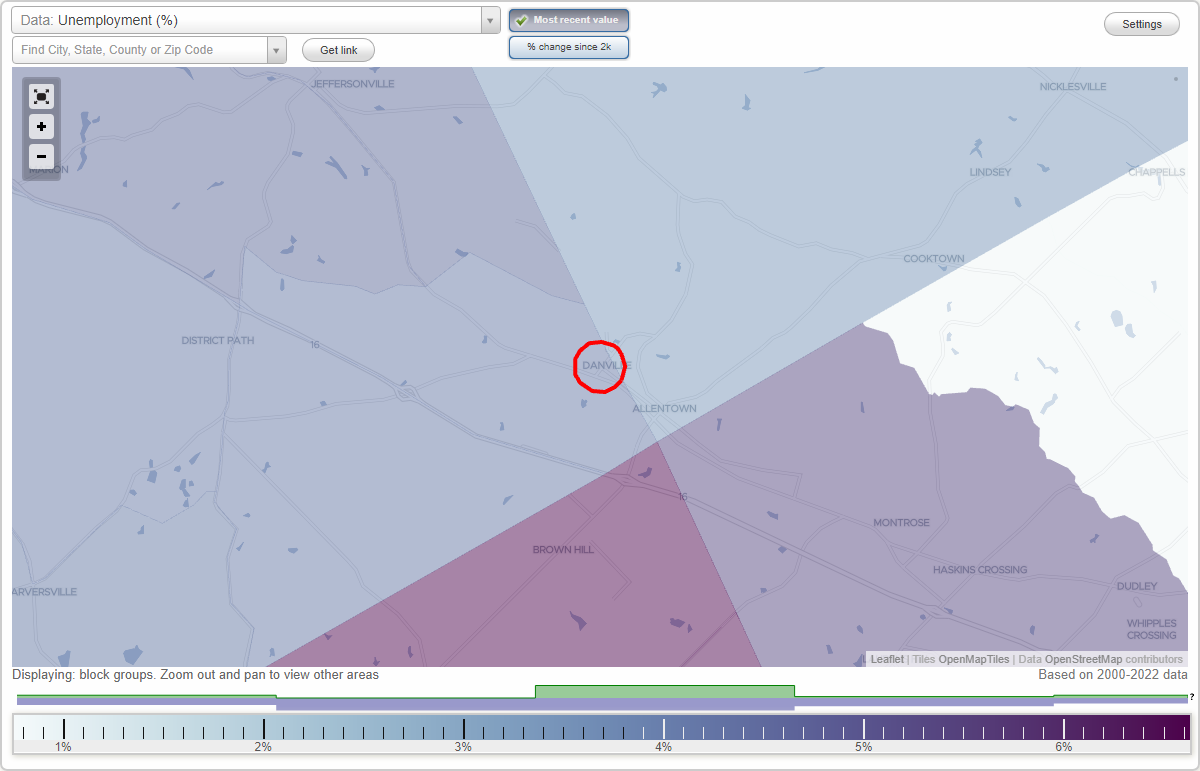
Unemployment in Danville
- Unemployment by race in 2000
- Unemployment rate for White non-Hispanic residents
- 2.9%Females
- Unemployment rate for Black residents
- 35.8%Females
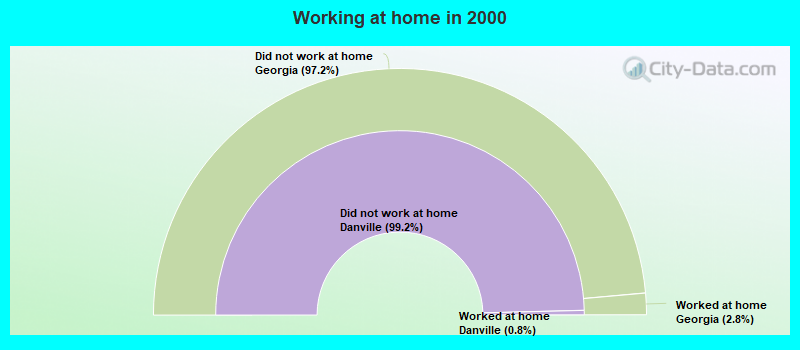
Time leaving home to go to work
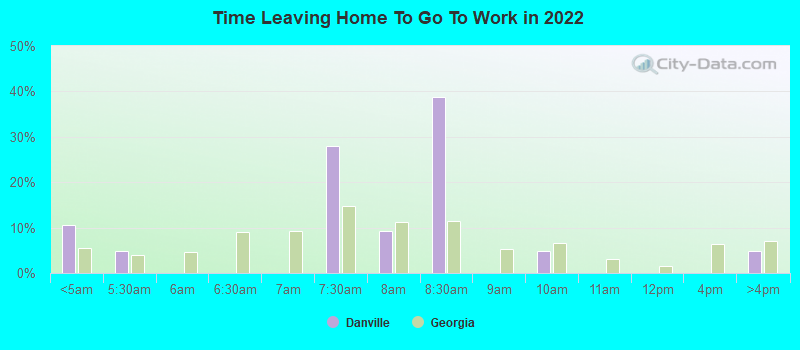
12:00 a.m. to 4:59 a.m.:
| Danville: | 10.5% (4) |
| Georgia: | 5.5% (242,137) |
5:00 a.m. to 5:29 a.m.:
| Danville: | 4.9% (2) |
| Georgia: | 4.0% (175,149) |
7:00 a.m. to 7:29 a.m.:
| Danville: | 27.9% (12) |
| Georgia: | 14.8% (646,529) |
7:30 a.m. to 7:59 a.m.:
| Danville: | 9.3% (4) |
| Georgia: | 11.3% (493,495) |
8:00 a.m. to 8:29 a.m.:
| Danville: | 38.7% (16) |
| Georgia: | 11.6% (504,252) |
9:00 a.m. to 9:59 a.m.:
| Danville: | 4.9% (2) |
| Georgia: | 6.7% (292,455) |
4:00 p.m. to 11:59 p.m.:
| Danville: | 4.8% (2) |
| Georgia: | 6.9% (302,787) |
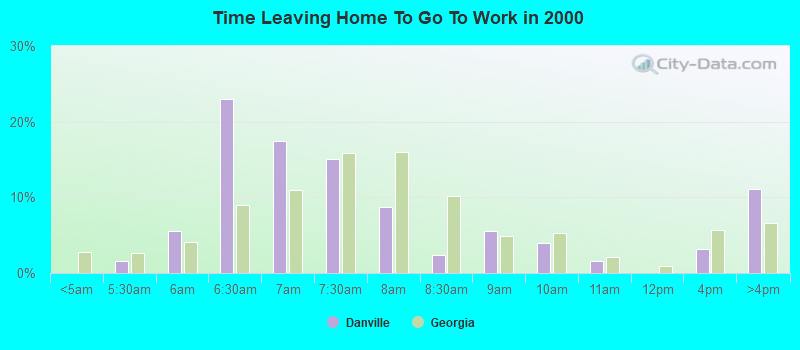
5:30am:
| Danville: | 1.6% (2) |
| Georgia: | 2.7% (102,302) |
6am:
| Danville: | 5.6% (7) |
| Georgia: | 4.1% (156,682) |
6:30am:
| Danville: | 23.0% (29) |
| Georgia: | 9.0% (343,349) |
7am:
| Danville: | 17.5% (22) |
| Georgia: | 11.0% (422,728) |
7:30am:
| Danville: | 15.1% (19) |
| Georgia: | 15.9% (608,777) |
8am:
| Danville: | 8.7% (11) |
| Georgia: | 15.9% (610,869) |
8:30am:
| Danville: | 2.4% (3) |
| Georgia: | 10.2% (391,849) |
9am:
| Danville: | 5.6% (7) |
| Georgia: | 4.9% (187,692) |
10am:
| Danville: | 4.0% (5) |
| Georgia: | 5.3% (204,205) |
11am:
| Danville: | 1.6% (2) |
| Georgia: | 2.1% (79,927) |
4pm:
| Danville: | 3.2% (4) |
| Georgia: | 5.7% (219,434) |
>4pm:
| Danville: | 11.1% (14) |
| Georgia: | 6.6% (253,223) |
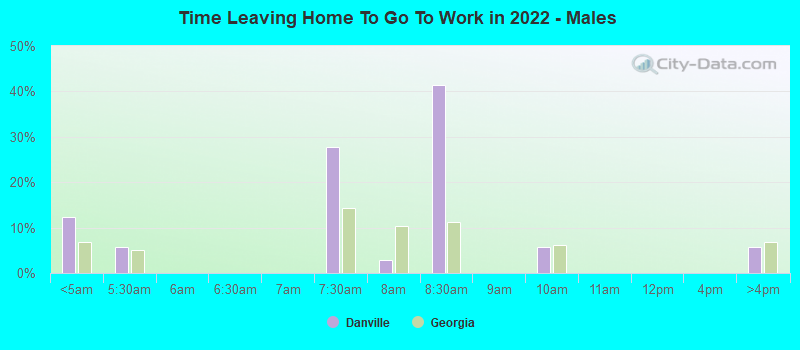
12:00 a.m. to 4:59 a.m. - Males:
| Danville: | 12.3% (4) |
| Georgia: | 6.8% (159,003) |
5:00 a.m. to 5:29 a.m. - Males:
| Danville: | 5.8% (2) |
| Georgia: | 5.1% (118,149) |
7:00 a.m. to 7:29 a.m. - Males:
| Danville: | 27.8% (10) |
| Georgia: | 14.3% (331,758) |
7:30 a.m. to 7:59 a.m. - Males:
| Danville: | 2.8% (1) |
| Georgia: | 10.4% (241,448) |
8:00 a.m. to 8:29 a.m. - Males:
| Danville: | 41.5% (15) |
| Georgia: | 11.2% (261,504) |
9:00 a.m. to 9:59 a.m. - Males:
| Danville: | 5.8% (2) |
| Georgia: | 6.1% (142,843) |
4:00 p.m. to 11:59 p.m. - Males:
| Danville: | 5.8% (2) |
| Georgia: | 6.9% (159,934) |
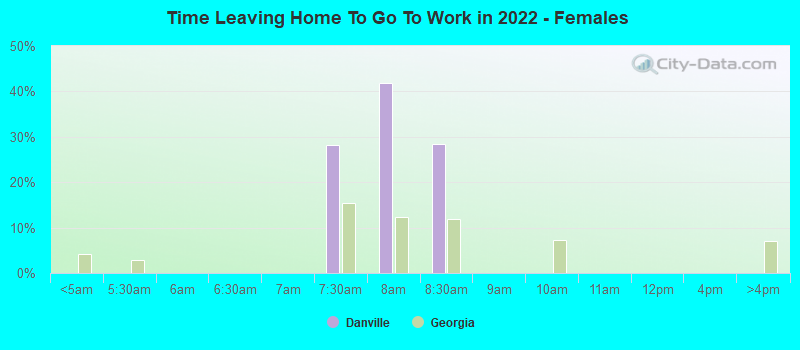
7:00 a.m. to 7:29 a.m. - Females:
| Danville: | 28.1% (2) |
| Georgia: | 15.5% (314,771) |
7:30 a.m. to 7:59 a.m. - Females:
| Danville: | 41.8% (3) |
| Georgia: | 12.4% (252,047) |
8:00 a.m. to 8:29 a.m. - Females:
| Danville: | 28.4% (2) |
| Georgia: | 11.9% (242,748) |
Travel time to work
Percentage of workers working in this county: 14.3%
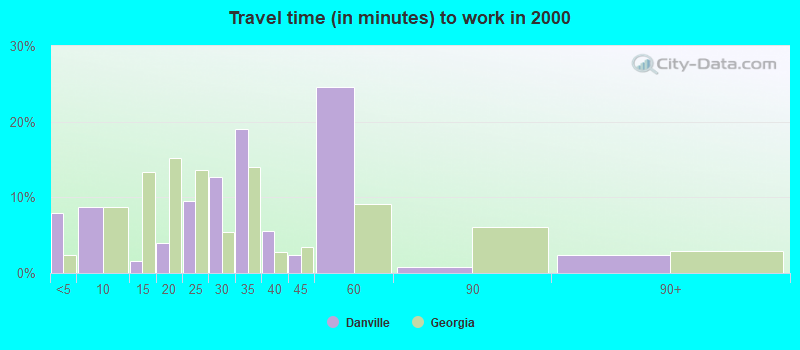
Less than 5 minutes:
| Danville: | 7.9% (10) |
| Georgia: | 2.4% (93,446) |
5 to 9 minutes:
| Danville: | 8.7% (11) |
| Georgia: | 8.7% (334,403) |
10 to 14 minutes:
| Danville: | 1.6% (2) |
| Georgia: | 13.3% (511,628) |
15 to 19 minutes:
| Danville: | 4.0% (5) |
| Georgia: | 15.2% (583,820) |
20 to 24 minutes:
| Danville: | 9.5% (12) |
| Georgia: | 13.6% (519,875) |
25 to 29 minutes:
| Danville: | 12.7% (16) |
| Georgia: | 5.5% (209,374) |
30 to 34 minutes:
| Danville: | 19.0% (24) |
| Georgia: | 14.0% (535,531) |
35 to 39 minutes:
| Danville: | 5.6% (7) |
| Georgia: | 2.8% (108,867) |
40 to 44 minutes:
| Danville: | 2.4% (3) |
| Georgia: | 3.4% (132,121) |
45 to 59 minutes:
| Danville: | 24.6% (31) |
| Georgia: | 9.1% (347,610) |
60 to 89 minutes:
| Danville: | 0.8% (1) |
| Georgia: | 6.1% (234,588) |
90 or more minutes:
| Danville: | 2.4% (3) |
| Georgia: | 2.9% (112,554) |
Means of transportation to work
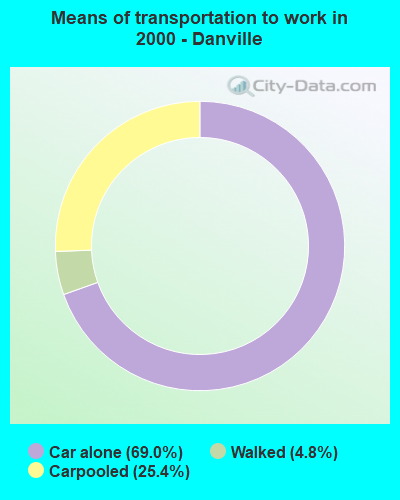
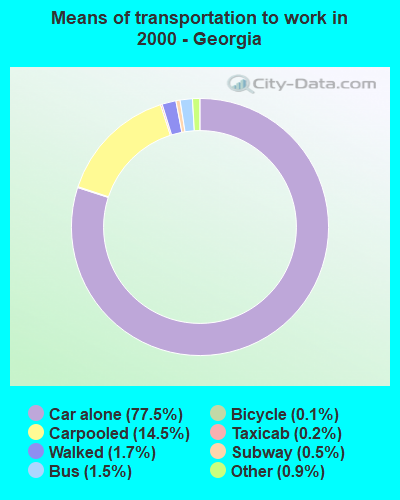
Drove car alone:
| Danville: | 69.0% (87) |
| Georgia: | 77.5% (2,968,910) |
Carpooled:
| Danville: | 25.4% (32) |
| Georgia: | 14.5% (557,062) |
Walked:
| Danville: | 4.8% (6) |
| Georgia: | 1.7% (65,776) |
Private vehicle occupancy
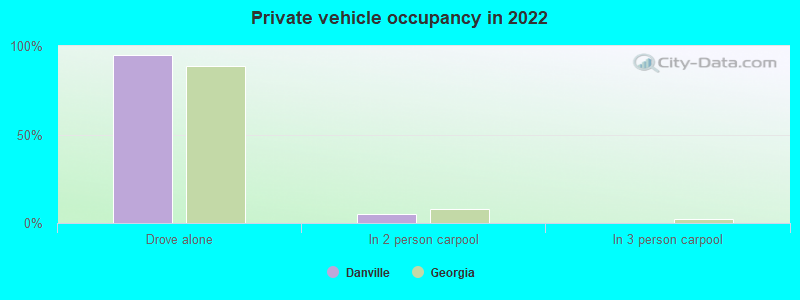
Drove alone:
| Danville: | 94.7% (40) |
| Georgia: | 88.7% (3,677,830) |
In 2 person carpool:
| Danville: | 4.8% (2) |
| Georgia: | 8.0% (330,754) |
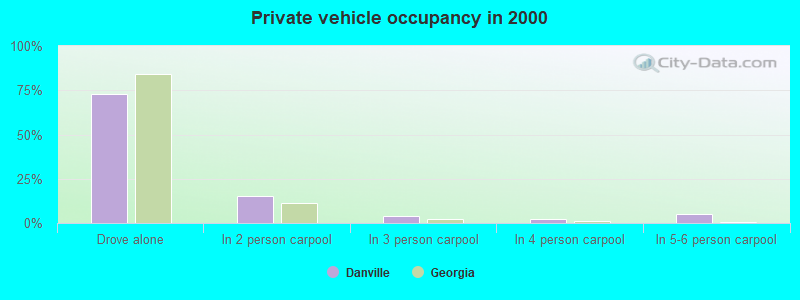
Drove alone:
| Danville: | 73.1% (87) |
| Georgia: | 84.2% (2,968,910) |
In 2 person carpool:
| Danville: | 15.1% (18) |
| Georgia: | 11.5% (406,954) |
In 3 person carpool:
| Danville: | 4.2% (5) |
| Georgia: | 2.5% (87,725) |
In 4 person carpool:
| Danville: | 2.5% (3) |
| Georgia: | 1.0% (34,505) |
In 5-6 person carpool:
| Danville: | 5.0% (6) |
| Georgia: | 0.5% (18,718) |
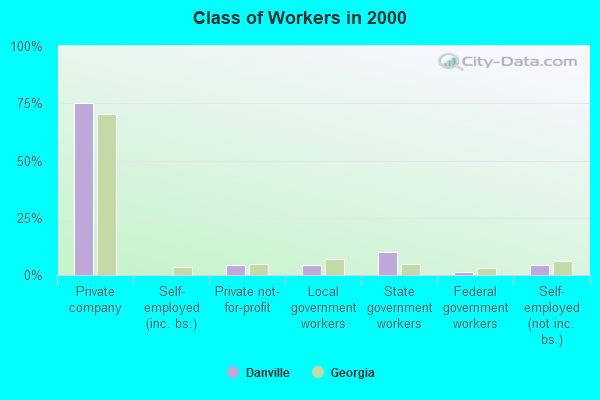
Class of workers
Employee of private company:
| Danville: | 84.8% (41) |
| Georgia: | 68.6% (3,616,681) |
Self-employed in own incorporated business:
| Danville: | 4.3% (2) |
| Georgia: | 4.4% (234,196) |
Local government workers:
| Danville: | 10.9% (5) |
| Georgia: | 7.3% (382,883) |
Employee of private company:
| Danville: | 75.0% (99) |
| Georgia: | 70.5% (2,705,775) |
Private not-for-profit wage and salary workers:
| Danville: | 4.5% (6) |
| Georgia: | 4.8% (185,815) |
Local government workers:
| Danville: | 4.5% (6) |
| Georgia: | 6.9% (265,340) |
State government workers:
| Danville: | 9.8% (13) |
| Georgia: | 5.0% (190,664) |
Federal government workers:
| Danville: | 1.5% (2) |
| Georgia: | 3.1% (118,038) |
Self-employed workers in own not incorporated business:
| Danville: | 4.5% (6) |
| Georgia: | 5.9% (226,595) |
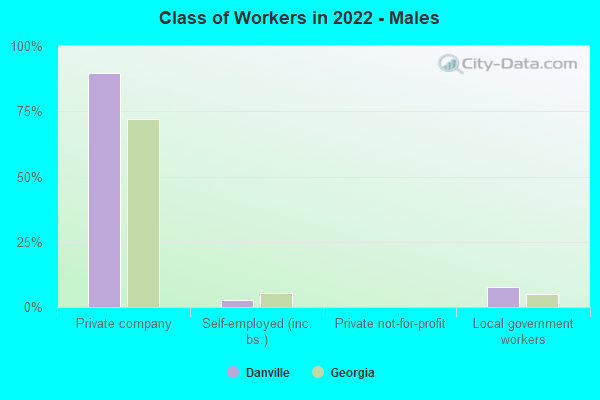
Employee of private company - Males:
| Danville: | 89.7% (36) |
| Georgia: | 71.9% (1,957,505) |
Self-employed in own incorporated business - Males:
| Danville: | 2.6% (1) |
| Georgia: | 5.4% (146,501) |
Local government workers - Males:
| Danville: | 7.7% (3) |
| Georgia: | 5.1% (138,226) |
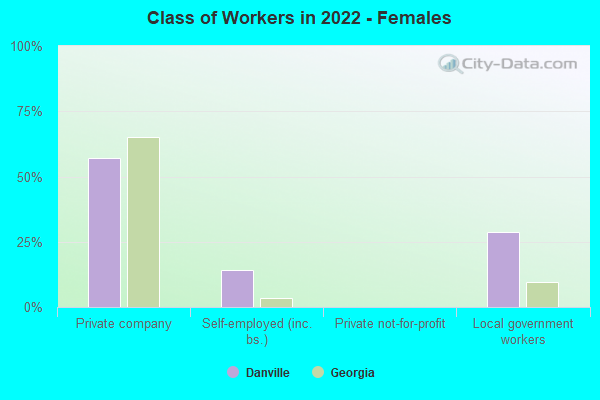
Employee of private company - Females:
| Danville: | 57.1% (4) |
| Georgia: | 65.1% (1,659,176) |
Self-employed in own incorporated business - Females:
| Danville: | 14.3% (1) |
| Georgia: | 3.4% (87,695) |
Local government workers - Females:
| Danville: | 28.6% (2) |
| Georgia: | 9.6% (244,657) |