Work and Jobs in Davenport, Nebraska (NE) Detailed Stats
Data:
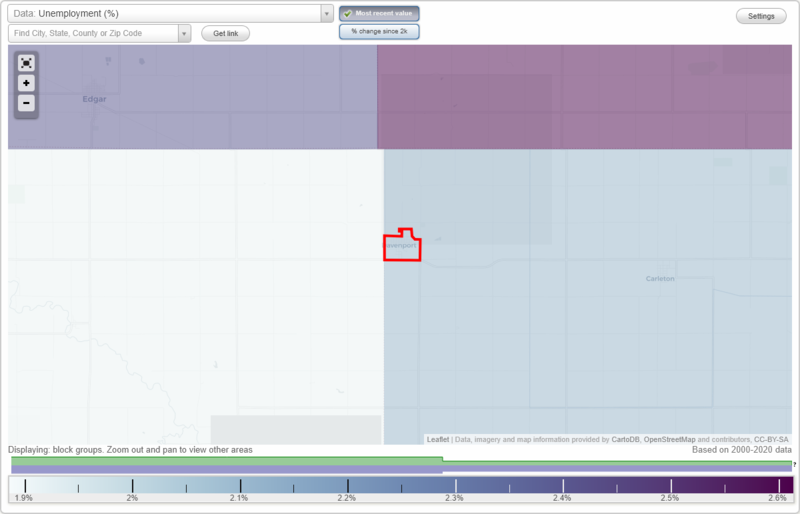
Unemployment (%)
Unemployment (% change since 2000)
Unemployment (%) - White
Unemployment (% change since 2000) - White
Unemployment (%) - Black or African American
Unemployment (% change since 2000) - Black or African American
Unemployment (%) - Asian
Unemployment (% change since 2000) - Asian
Unemployment (%) - Hispanic or Latino
Unemployment (% change since 2000) - Hispanic or Latino
Unemployment (%) - American Indian and Alaska Native
Unemployment (% change since 2000) - American Indian and Alaska Native
Unemployment (%) - Multirace
Unemployment (% change since 2000) - Multirace
Unemployment (%) - Other Race
Unemployment (% change since 2000) - Other Race
Industry diversity
Most Common Industries - Agriculture, forestry, fishing and hunting, and mining (%)
Most Common Industries - Agriculture, forestry, fishing and hunting (%)
Most Common Industries - Mining, quarrying, and oil and gas extraction (%)
Most Common Industries - Construction (%)
Most Common Industries - Manufacturing (%)
Most Common Industries - Wholesale trade (%)
Most Common Industries - Retail trade (%)
Most Common Industries - Transportation and warehousing, and utilities (%)
Most Common Industries - Transportation and warehousing (%)
Most Common Industries - Utilities (%)
Most Common Industries - Information (%)
Most Common Industries - Finance and insurance, and real estate and rental and leasing (%)
Most Common Industries - Finance and insurance (%)
Most Common Industries - Real estate and rental and leasing (%)
Most Common Industries - Professional, scientific, and management, and administrative and waste management services (%)
Most Common Industries - Professional, scientific, and technical services (%)
Most Common Industries - Management of companies and enterprises (%)
Most Common Industries - Administrative and support and waste management services (%)
Most Common Industries - Educational services, and health care and social assistance (%)
Most Common Industries - Educational services (%)
Most Common Industries - Health care and social assistance (%)
Most Common Industries - Arts, entertainment, and recreation, and accommodation and food services (%)
Most Common Industries - Arts, entertainment, and recreation (%)
Most Common Industries - Accommodation and food services (%)
Most Common Industries - Other services, except public administration (%)
Most Common Industries - Public administration (%)
Occupation diversity
Most Common Occupations - Management, business, science, and arts occupations (%)
Most Common Occupations - Management, business, and financial occupations (%)
Most Common Occupations - Management occupations (%)
Most Common Occupations - Business and financial operations occupations (%)
Most Common Occupations - Computer, engineering, and science occupations (%)
Most Common Occupations - Computer and mathematical occupations (%)
Most Common Occupations - Architecture and engineering occupations (%)
Most Common Occupations - Life, physical, and social science occupations (%)
Most Common Occupations - Education, legal, community service, arts, and media occupations (%)
Most Common Occupations - Community and social service occupations (%)
Most Common Occupations - Legal occupations (%)
Most Common Occupations - Education, training, and library occupations (%)
Most Common Occupations - Arts, design, entertainment, sports, and media occupations (%)
Most Common Occupations - Healthcare practitioners and technical occupations (%)
Most Common Occupations - Health diagnosing and treating practitioners and other technical occupations (%)
Most Common Occupations - Health technologists and technicians (%)
Most Common Occupations - Service occupations (%)
Most Common Occupations - Healthcare support occupations (%)
Most Common Occupations - Protective service occupations (%)
Most Common Occupations - Fire fighting and prevention, and other protective service workers including supervisors (%)
Most Common Occupations - Law enforcement workers including supervisors (%)
Most Common Occupations - Food preparation and serving related occupations (%)
Most Common Occupations - Building and grounds cleaning and maintenance occupations (%)
Most Common Occupations - Personal care and service occupations (%)
Most Common Occupations - Sales and office occupations (%)
Most Common Occupations - Sales and related occupations (%)
Most Common Occupations - Office and administrative support occupations (%)
Most Common Occupations - Natural resources, construction, and maintenance occupations (%)
Most Common Occupations - Farming, fishing, and forestry occupations (%)
Most Common Occupations - Construction and extraction occupations (%)
Most Common Occupations - Installation, maintenance, and repair occupations (%)
Most Common Occupations - Production, transportation, and material moving occupations (%)
Most Common Occupations - Production occupations (%)
Most Common Occupations - Transportation occupations (%)
Most Common Occupations - Material moving occupations (%)
Private vehicle occupancy - Drove alone (% change since 2000)
Private vehicle occupancy - Carpooled (%)
Private vehicle occupancy - Carpooled (% change since 2000)
Private vehicle occupancy - In 2-person carpool (%)
Private vehicle occupancy - In 2-person carpool (% change since 2000)
Private vehicle occupancy - In 3-person carpool (%)
Private vehicle occupancy - In 3-person carpool (% change since 2000)
Private vehicle occupancy - In 4-person carpool (%)
Private vehicle occupancy - In 4-person carpool (% change since 2000)
Private vehicle occupancy - In 5- or 6-person carpool (%)
Private vehicle occupancy - In 5- or 6-person carpool (% change since 2000)
Private vehicle occupancy - In 7-or-more-person carpool (%)
Private vehicle occupancy - In 7-or-more-person carpool (% change since 2000)
Time Leaving Home To Go To Work - 12:00 a.m. to 4:59 a.m. (%)
Time Leaving Home To Go To Work - 12:00 a.m. to 4:59 a.m. (% change since 2000)
Time Leaving Home To Go To Work - 5:00 a.m. to 5:59 a.m. (%)
Time Leaving Home To Go To Work - 5:00 a.m. to 5:59 a.m. (% change since 2000)
Time Leaving Home To Go To Work - 6:00 a.m. to 6:59 a.m. (%)
Time Leaving Home To Go To Work - 6:00 a.m. to 6:59 a.m. (% change since 2000)
Time Leaving Home To Go To Work - 7:00 a.m. to 7:59 a.m. (%)
Time Leaving Home To Go To Work - 7:00 a.m. to 7:59 a.m. (% change since 2000)
Time Leaving Home To Go To Work - 8:00 a.m. to 8:59 a.m. (%)
Time Leaving Home To Go To Work - 8:00 a.m. to 8:59 a.m. (% change since 2000)
Time Leaving Home To Go To Work - 9:00 a.m. to 9:59 a.m. (%)
Time Leaving Home To Go To Work - 9:00 a.m. to 9:59 a.m. (% change since 2000)
Time Leaving Home To Go To Work - 10:00 a.m. to 10:59 a.m. (%)
Time Leaving Home To Go To Work - 10:00 a.m. to 10:59 a.m. (% change since 2000)
Time Leaving Home To Go To Work - 11:00 a.m. to 11:59 a.m. (%)
Time Leaving Home To Go To Work - 11:00 a.m. to 11:59 a.m. (% change since 2000)
Time Leaving Home To Go To Work - 12:00 p.m. to 3:59 p.m. (%)
Time Leaving Home To Go To Work - 12:00 p.m. to 3:59 p.m. (% change since 2000)
Time Leaving Home To Go To Work - 4:00 p.m. to 11:59 p.m. (%)
Time Leaving Home To Go To Work - 4:00 p.m. to 11:59 p.m. (% change since 2000)
Class of Workers - Employee of private company (%)
Class of Workers - Employee of private company (% change since 2000)
Class of Workers - Self-employed in own incorporated business (%)
Class of Workers - Self-employed in own incorporated business (% change since 2000)
Class of Workers - Private not-for-profit wage and salary workers (%)
Class of Workers - Private not-for-profit wage and salary workers (% change since 2000)
Class of Workers - Local government workers (%)
Class of Workers - Local government workers (% change since 2000)
Class of Workers - State government workers (%)
Class of Workers - State government workers (% change since 2000)
Class of Workers - Federal government workers (%)
Class of Workers - Federal government workers (% change since 2000)
Class of Workers - Self-employed workers in own not incorporated business and Unpaid family workers (%)
Class of Workers - Self-employed workers in own not incorporated business and Unpaid family workers (% change since 2000)
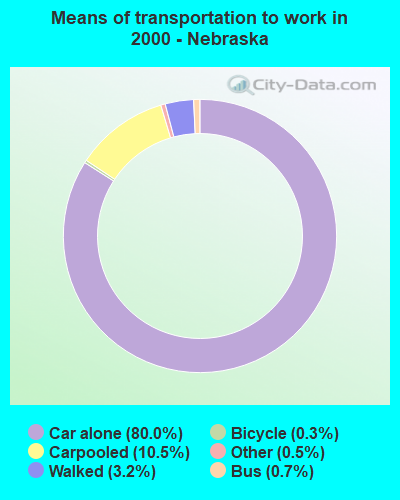
Means of transportation to work - Drove car alone (%)
Means of transportation to work - Drove car alone (% change since 2000)
Means of transportation to work - Carpooled (%)
Means of transportation to work - Carpooled (% change since 2000)
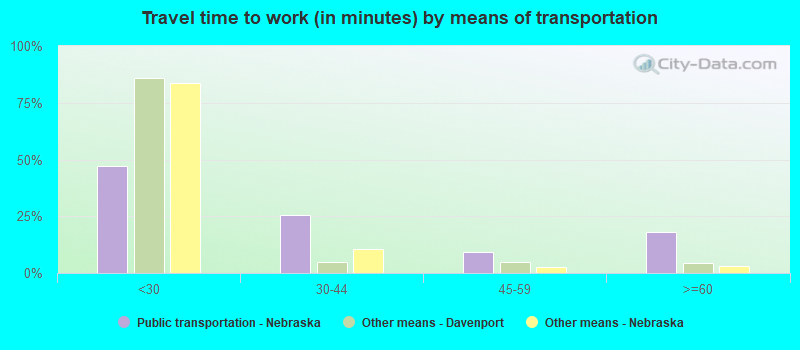
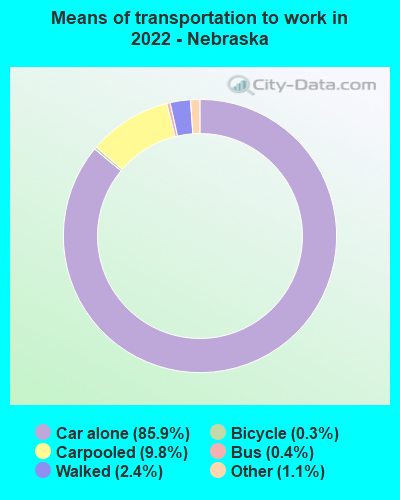
Means of transportation to work - Public transportation (%)
Means of transportation to work - Public transportation (% change since 2000)
Means of transportation to work - Bus or trolley bus (%)
Means of transportation to work - Bus or trolley bus (% change since 2000)
Means of transportation to work - Streetcar or trolley car (%)
Means of transportation to work - Streetcar or trolley car (% change since 2000)
Means of transportation to work - Subway or elevated (%)
Means of transportation to work - Subway or elevated (% change since 2000)
Means of transportation to work - Railroad (%)
Means of transportation to work - Railroad (% change since 2000)
Means of transportation to work - Ferryboat (%)
Means of transportation to work - Ferryboat (% change since 2000)
Means of transportation to work - Taxicab (%)
Means of transportation to work - Taxicab (% change since 2000)
Means of transportation to work - Motorcycle (%)
Means of transportation to work - Motorcycle (% change since 2000)
Means of transportation to work - Bicycle (%)
Means of transportation to work - Bicycle (% change since 2000)
Means of transportation to work - Walked (%)
Means of transportation to work - Walked (% change since 2000)
Means of transportation to work - Other means (%)
Means of transportation to work - Other means (% change since 2000)
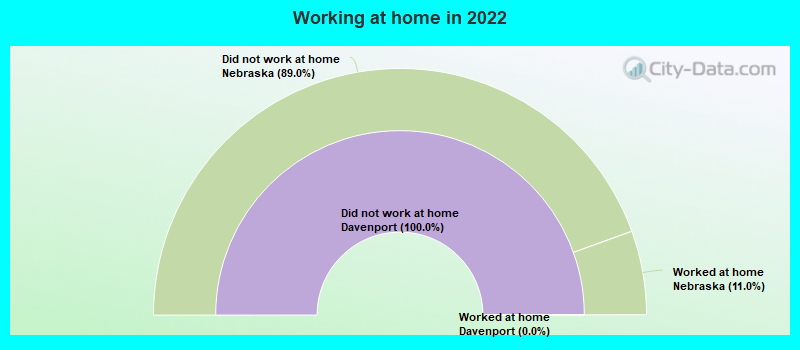
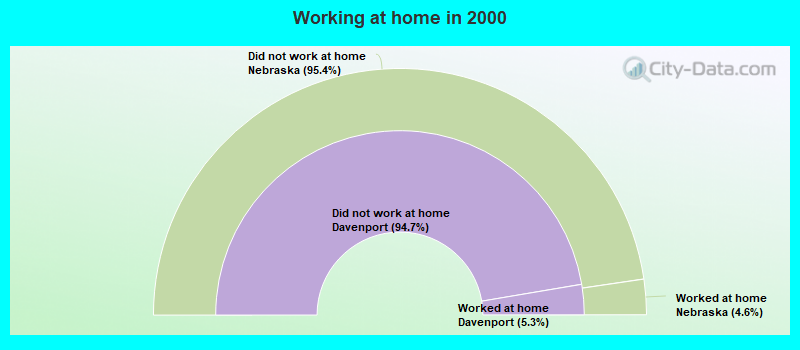
Working at home (%)
Working at home (% change since 2000)
Travel time to work - Less than 5 minutes (%)
Travel time to work - Less than 5 minutes (% change since 2000)
Travel time to work - 5 to 9 minutes (%)
Travel time to work - 5 to 9 minutes (% change since 2000)
Travel time to work - 10 to 19 minutes (%)
Travel time to work - 10 to 19 minutes (% change since 2000)
Travel time to work - 20 to 29 minutes (%)
Travel time to work - 20 to 29 minutes (% change since 2000)
Travel time to work - 30 to 39 minutes (%)
Travel time to work - 30 to 39 minutes (% change since 2000)
Travel time to work - 40 to 59 minutes (%)
Travel time to work - 40 to 59 minutes (% change since 2000)
Travel time to work - 60 to 89 minutes (%)
Travel time to work - 60 to 89 minutes (% change since 2000)
Travel time to work - 90 or more minutes (%)
Travel time to work - 90 or more minutes (% change since 2000)
Latest news about work in Davenport, NE collected exclusively by city-data.com from local newspapers, TV, and radio stations
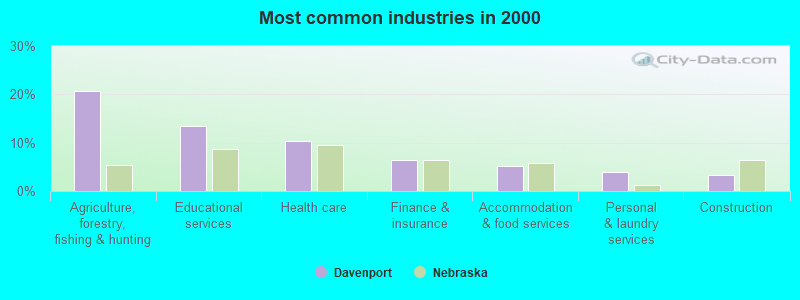
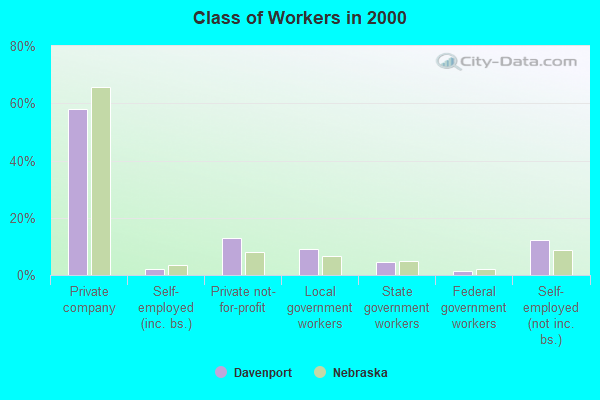
The most common industries in Davenport are: Agriculture, forestry, fishing & hunting (20.6% of civilian employees), Educational services (13.5% of civilian employees), Health care (10.3% of civilian employees). 64.0% of workers work in Thayer County. 58.3% of workers are employees of private companies, which is 10.7% less than the rate of 64.5% across the entire state of Nebraska.
Whole page based on the data from 2000 / 2022 when the population of Davenport, Nebraska was 339 / 346
Most common industries
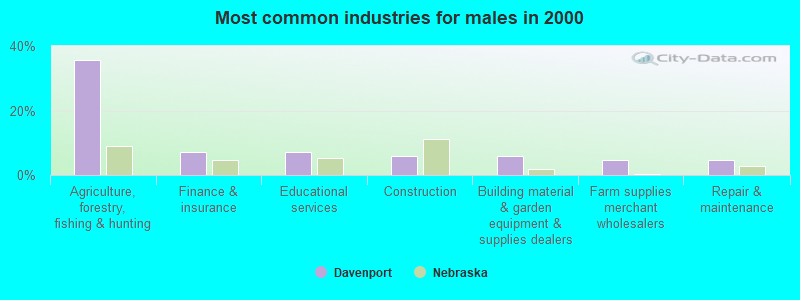
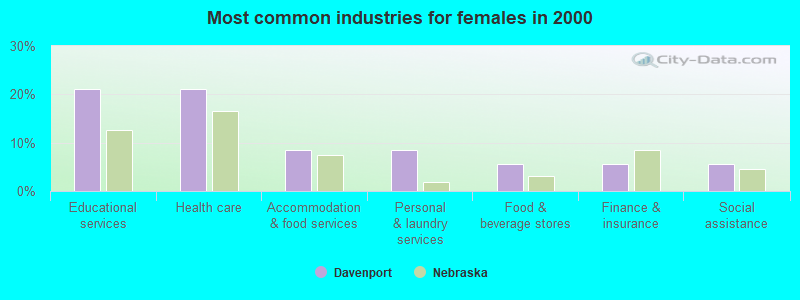
Most common industries Industry All Males Females
Agriculture, forestry, fishing and hunting 20.6% 35.7% 2.8% Educational services 13.5% 7.1% 21.1% Health care 10.3% 1.2% 21.1% Finance and insurance 6.5% 7.1% 5.6% Accommodation and food services 5.2% 2.4% 8.5% Personal and laundry services 3.9% 0.0% 8.5% Construction 3.2% 6.0% 0.0% Building material and garden equipment and supplies dealers 3.2% 6.0% 0.0% Farm supplies merchant wholesalers 2.6% 4.8% 0.0% Food and beverage stores 2.6% 0.0% 5.6% Public administration 2.6% 1.2% 4.2% Social assistance 2.6% 0.0% 5.6% Repair and maintenance 2.6% 4.8% 0.0% Miscellaneous nondurable goods merchant wholesalers 1.9% 3.6% 0.0% Machinery 1.9% 3.6% 0.0% Recyclable material merchant wholesalers 1.9% 3.6% 0.0% Gasoline stations 1.9% 3.6% 0.0% Used merchandise, gift, novelty, and souvenir, and other miscellaneous stores 1.9% 2.4% 1.4% Miscellaneous manufacturing 1.3% 0.0% 2.8% Metal and metal products 1.3% 2.4% 0.0% Computer and electronic products 1.3% 0.0% 2.8% Truck transportation 1.3% 2.4% 0.0% Electronic shopping and mail-order houses 1.3% 0.0% 2.8% Data processing, libraries, and other information services 1.3% 0.0% 2.8% Religious, grantmaking, civic, professional, and similar organizations 1.3% 0.0% 2.8% Metals and minerals, except petroleum, merchant wholesalers 0.6% 1.2% 0.0% U. S. Postal service 0.6% 1.2% 0.0% Administrative and support and waste management services 0.6% 0.0% 1.4%
Unemployment in Davenport Unemployment by race in 2022
Unemployment rate for White non-Hispanic residents 5.0% Males3.8% Females
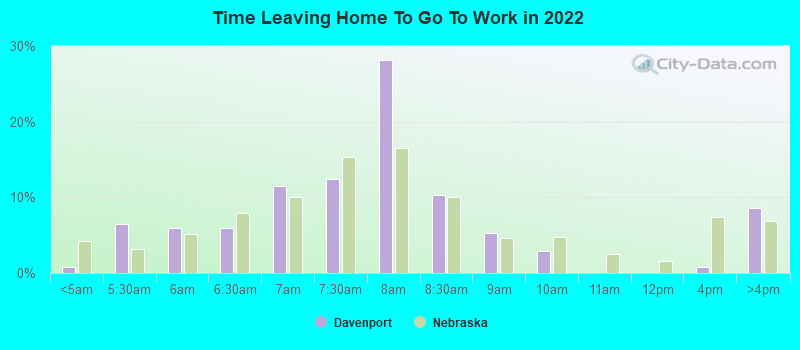
Time leaving home to go to work 12:00 a.m. to 4:59 a.m.: Davenport:
0.8% (1)Nebraska:
4.2% (38,183)
5:00 a.m. to 5:29 a.m.: Davenport:
6.4% (9)Nebraska:
3.1% (28,385)
5:30 a.m. to 5:59 a.m.: Davenport:
6.0% (8)Nebraska:
5.2% (46,864)
6:00 a.m. to 6:29 a.m.: Davenport:
5.9% (8)Nebraska:
8.0% (72,258)
6:30 a.m. to 6:59 a.m.: Davenport:
11.5% (16)Nebraska:
10.1% (91,198)
7:00 a.m. to 7:29 a.m.: Davenport:
12.4% (17)Nebraska:
15.3% (138,295)
7:30 a.m. to 7:59 a.m.: Davenport:
28.1% (39)Nebraska:
16.5% (149,772)
8:00 a.m. to 8:29 a.m.: Davenport:
10.3% (14)Nebraska:
10.1% (91,591)
8:30 a.m. to 8:59 a.m.: Davenport:
5.3% (7)Nebraska:
4.6% (41,546)
9:00 a.m. to 9:59 a.m.: Davenport:
2.9% (4)Nebraska:
4.7% (42,721)
12:00 p.m. to 3:59 p.m.: Davenport:
0.7% (1)Nebraska:
7.4% (66,627)
4:00 p.m. to 11:59 p.m.: Davenport:
8.5% (12)Nebraska:
6.8% (61,867)
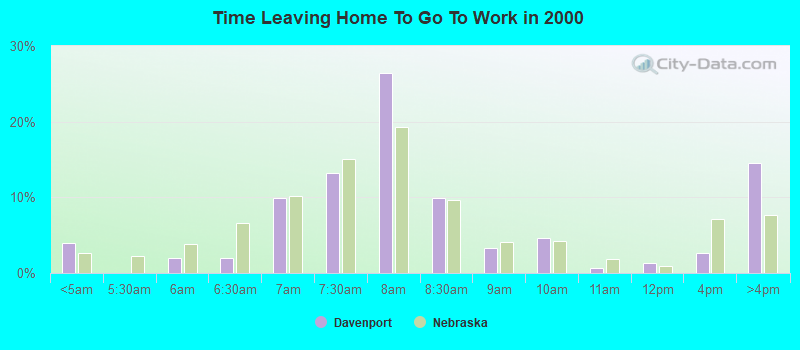
<5am: Davenport:
4.0% (6)Nebraska:
2.6% (22,860)
6am: Davenport:
2.0% (3)Nebraska:
3.8% (33,408)
6:30am: Davenport:
2.0% (3)Nebraska:
6.6% (57,307)
7am: Davenport:
9.9% (15)Nebraska:
10.2% (89,341)
7:30am: Davenport:
13.2% (20)Nebraska:
15.0% (131,291)
8am: Davenport:
26.5% (40)Nebraska:
19.3% (168,546)
8:30am: Davenport:
9.9% (15)Nebraska:
9.6% (83,777)
9am: Davenport:
3.3% (5)Nebraska:
4.1% (36,098)
10am: Davenport:
4.6% (7)Nebraska:
4.2% (36,918)
11am: Davenport:
0.7% (1)Nebraska:
1.9% (16,466)
12pm: Davenport:
1.3% (2)Nebraska:
1.0% (8,370)
4pm: Davenport:
2.6% (4)Nebraska:
7.1% (61,933)
>4pm: Davenport:
14.6% (22)Nebraska:
7.6% (66,396)
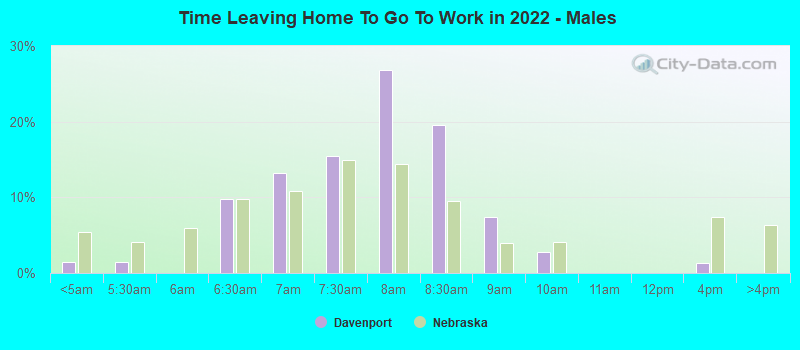
12:00 a.m. to 4:59 a.m. - Males: Davenport:
1.4% (1)Nebraska:
5.4% (26,753)
5:00 a.m. to 5:29 a.m. - Males: Davenport:
1.4% (1)Nebraska:
4.1% (19,987)
6:00 a.m. to 6:29 a.m. - Males: Davenport:
9.7% (7)Nebraska:
9.8% (48,295)
6:30 a.m. to 6:59 a.m. - Males: Davenport:
13.3% (10)Nebraska:
10.9% (53,520)
7:00 a.m. to 7:29 a.m. - Males: Davenport:
15.5% (12)Nebraska:
14.9% (73,333)
7:30 a.m. to 7:59 a.m. - Males: Davenport:
26.8% (20)Nebraska:
14.4% (71,022)
8:00 a.m. to 8:29 a.m. - Males: Davenport:
19.5% (15)Nebraska:
9.5% (46,797)
8:30 a.m. to 8:59 a.m. - Males: Davenport:
7.4% (6)Nebraska:
4.0% (19,823)
9:00 a.m. to 9:59 a.m. - Males: Davenport:
2.7% (2)Nebraska:
4.1% (20,069)
12:00 p.m. to 3:59 p.m. - Males: Davenport:
1.4% (1)Nebraska:
7.4% (36,723)
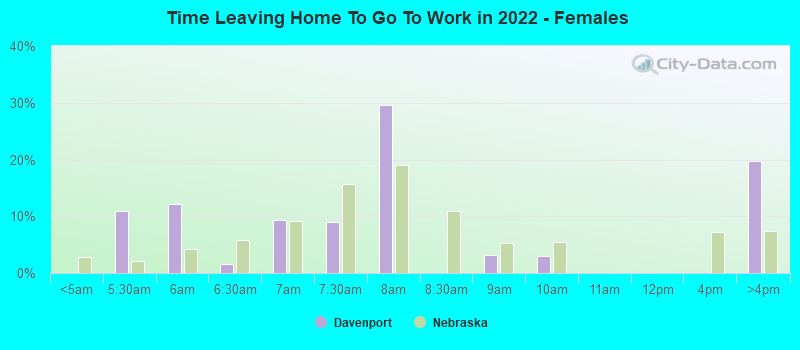
5:00 a.m. to 5:29 a.m. - Females: Davenport:
11.0% (7)Nebraska:
2.0% (8,398)
5:30 a.m. to 5:59 a.m. - Females: Davenport:
12.2% (8)Nebraska:
4.2% (17,501)
6:00 a.m. to 6:29 a.m. - Females: Davenport:
1.5% (1)Nebraska:
5.8% (23,963)
6:30 a.m. to 6:59 a.m. - Females: Davenport:
9.3% (6)Nebraska:
9.1% (37,678)
7:00 a.m. to 7:29 a.m. - Females: Davenport:
8.9% (6)Nebraska:
15.7% (64,962)
7:30 a.m. to 7:59 a.m. - Females: Davenport:
29.6% (19)Nebraska:
19.1% (78,750)
8:30 a.m. to 8:59 a.m. - Females: Davenport:
3.2% (2)Nebraska:
5.3% (21,723)
9:00 a.m. to 9:59 a.m. - Females: Davenport:
3.1% (2)Nebraska:
5.5% (22,652)
4:00 p.m. to 11:59 p.m. - Females: Davenport:
19.8% (12)Nebraska:
7.5% (30,802)
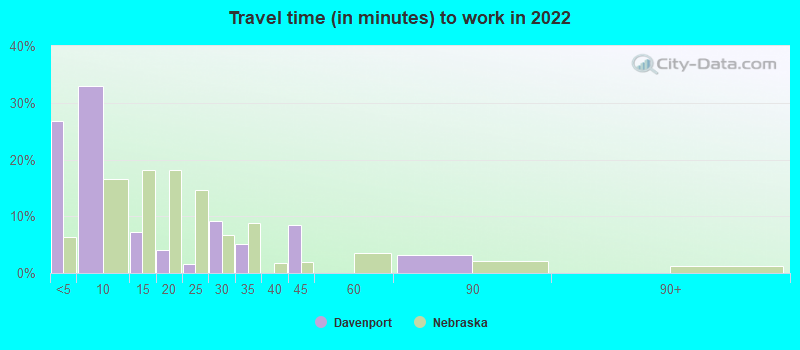
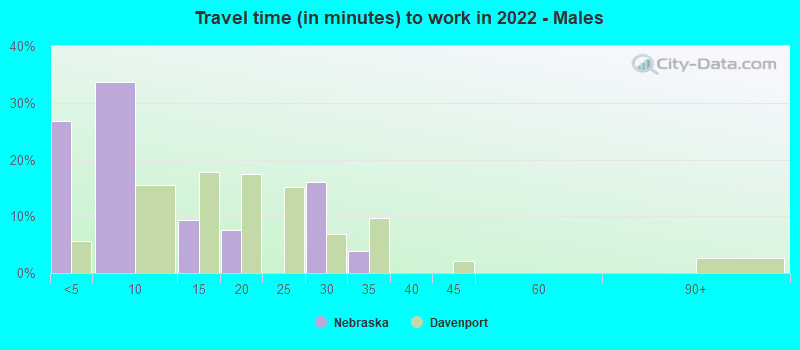
Travel time to work Percentage of workers working in this county: 64.0%
Less than 5 minutes: Davenport:
26.8% (53)Nebraska:
6.4% (59,189)
5 to 9 minutes: Davenport:
33.0% (65)Nebraska:
16.6% (153,547)
10 to 14 minutes: Davenport:
7.3% (14)Nebraska:
18.1% (167,984)
15 to 19 minutes: Davenport:
4.0% (8)Nebraska:
18.1% (167,434)
20 to 24 minutes: Davenport:
1.5% (3)Nebraska:
14.7% (136,206)
25 to 29 minutes: Davenport:
9.2% (18)Nebraska:
6.7% (62,426)
30 to 34 minutes: Davenport:
5.1% (10)Nebraska:
8.8% (81,730)
40 to 44 minutes: Davenport:
8.5% (17)Nebraska:
1.9% (17,347)
60 to 89 minutes: Davenport:
3.2% (6)Nebraska:
2.2% (19,917)
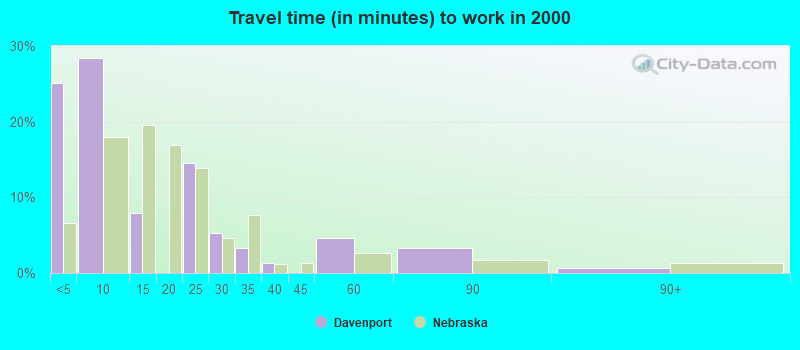
Less than 5 minutes: Davenport:
25.2% (38)Nebraska:
6.6% (57,839)
5 to 9 minutes: Davenport:
28.5% (43)Nebraska:
18.0% (156,837)
10 to 14 minutes: Davenport:
7.9% (12)Nebraska:
19.5% (170,281)
20 to 24 minutes: Davenport:
14.6% (22)Nebraska:
13.9% (121,568)
25 to 29 minutes: Davenport:
5.3% (8)Nebraska:
4.6% (39,900)
30 to 34 minutes: Davenport:
3.3% (5)Nebraska:
7.7% (67,161)
35 to 39 minutes: Davenport:
1.3% (2)Nebraska:
1.1% (9,881)
45 to 59 minutes: Davenport:
4.6% (7)Nebraska:
2.7% (23,190)
60 to 89 minutes: Davenport:
3.3% (5)Nebraska:
1.8% (15,536)
90 or more minutes: Davenport:
0.7% (1)Nebraska:
1.3% (11,214)
Less than 5 minutes - Males: Davenport:
26.8% (28)Nebraska:
5.7% (28,922)
5 to 9 minutes - Males: Davenport:
33.6% (35)Nebraska:
15.4% (78,072)
10 to 14 minutes - Males: Davenport:
9.4% (10)Nebraska:
17.7% (89,764)
15 to 19 minutes - Males: Davenport:
7.7% (8)Nebraska:
17.4% (88,229)
25 to 29 minutes - Males: Davenport:
16.0% (16)Nebraska:
6.8% (34,510)
30 to 34 minutes - Males: Davenport:
3.9% (4)Nebraska:
9.7% (49,106)
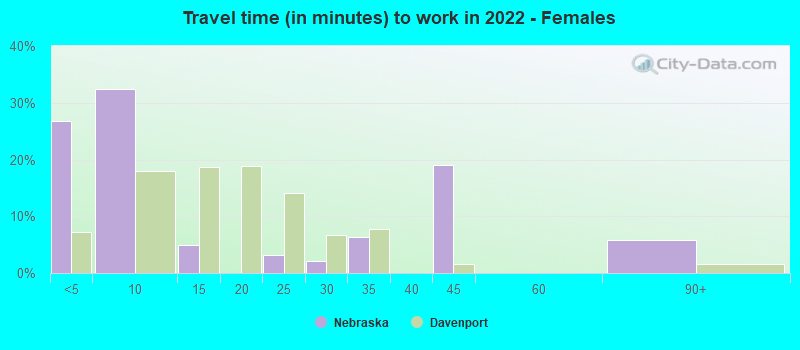
Less than 5 minutes - Females: Davenport:
26.7% (25)Nebraska:
7.2% (30,267)
5 to 9 minutes - Females: Davenport:
32.4% (30)Nebraska:
18.0% (75,475)
10 to 14 minutes - Females: Davenport:
5.0% (5)Nebraska:
18.6% (78,220)
20 to 24 minutes - Females: Davenport:
3.1% (3)Nebraska:
14.1% (59,347)
25 to 29 minutes - Females: Davenport:
2.1% (2)Nebraska:
6.7% (27,916)
30 to 34 minutes - Females: Davenport:
6.3% (6)Nebraska:
7.8% (32,624)
40 to 44 minutes - Females: Davenport:
19.0% (18)Nebraska:
1.6% (6,821)
60 to 89 minutes - Females: Davenport:
5.9% (5)Nebraska:
1.6% (6,698)
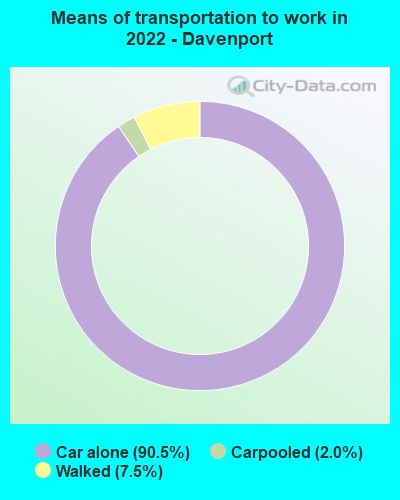
Means of transportation to work Drove car alone: Davenport:
90.5% (184)Nebraska:
85.9% (356,725)
Carpooled: Davenport:
2.0% (4)Nebraska:
9.8% (46,948)
Walked: Davenport:
7.5% (15)Nebraska:
2.4% (9,848)
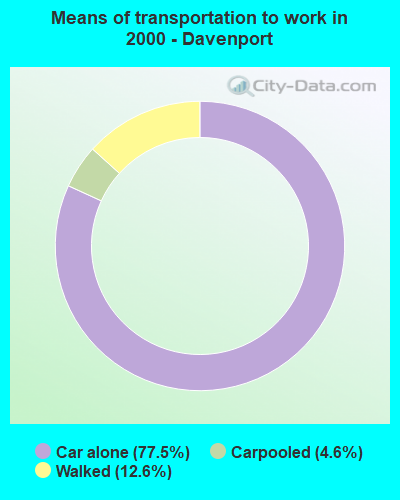
Drove car alone: Davenport:
77.5% (117)Nebraska:
80.0% (698,680)
Carpooled: Davenport:
4.6% (7)Nebraska:
10.5% (91,901)
Walked: Davenport:
12.6% (19)Nebraska:
3.2% (28,003)
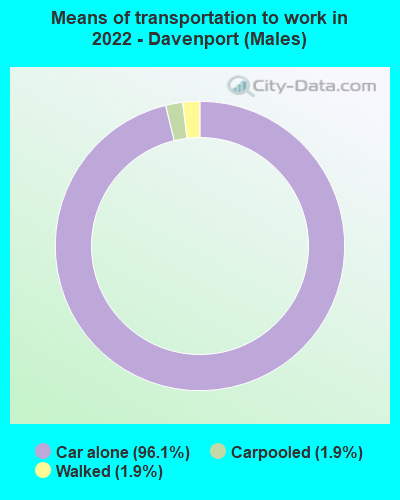
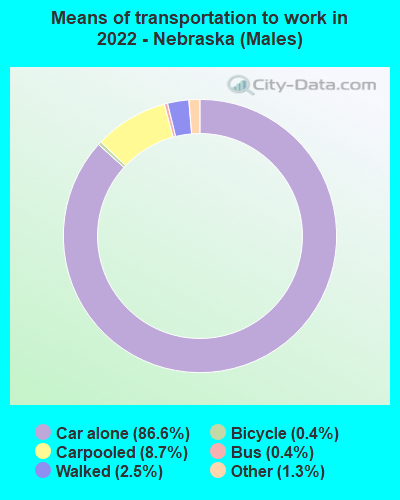
Drove car alone - Males: Davenport:
96.1% (101)Nebraska:
86.6% (356,725)
Carpooled - Males: Davenport:
1.9% (2)Nebraska:
8.7% (46,948)
Walked - Males: Davenport:
1.9% (2)Nebraska:
2.5% (9,848)
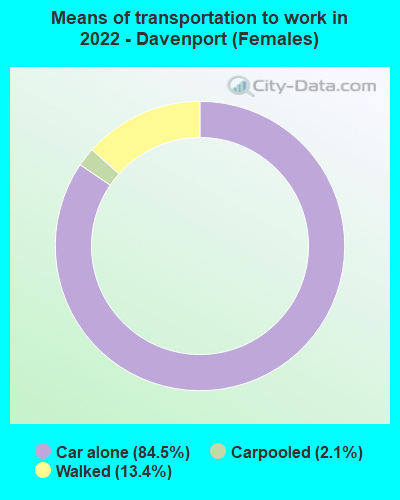
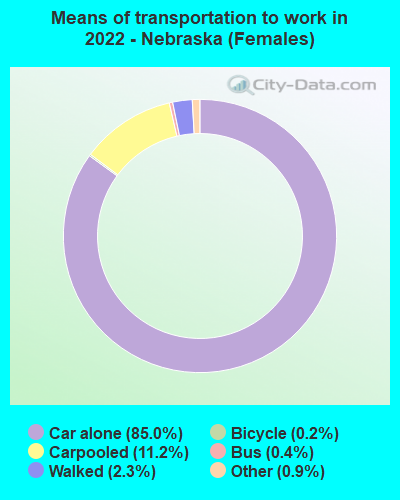
Drove car alone - Females: Davenport:
84.5% (82)Nebraska:
85.0% (356,725)
Carpooled - Females: Davenport:
2.1% (2)Nebraska:
11.2% (46,948)
Walked - Females: Davenport:
13.4% (13)Nebraska:
2.3% (9,848)
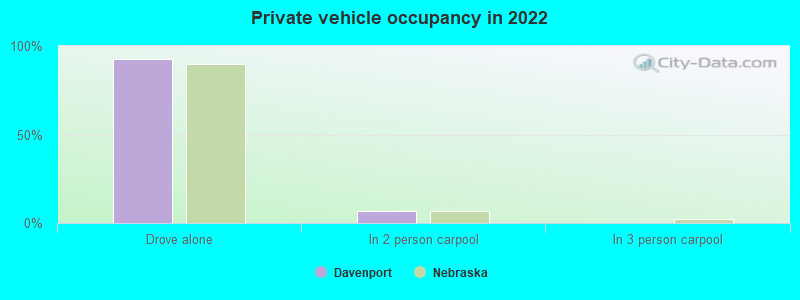
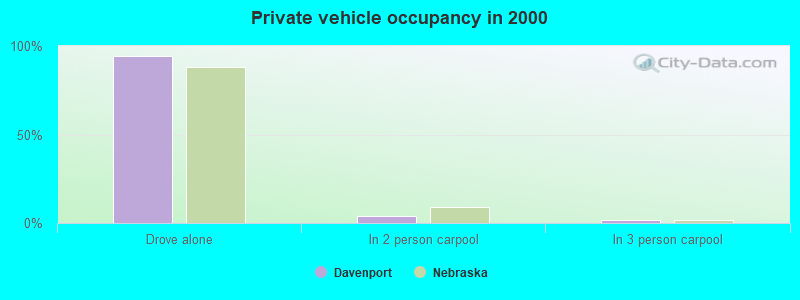
Private vehicle occupancy Drove alone: Davenport:
92.5% (102)Nebraska:
89.8% (776,747)
In 2 person carpool: Davenport:
6.8% (7)Nebraska:
6.9% (59,818)
Drove alone: Davenport:
94.4% (117)Nebraska:
88.4% (698,680)
In 2 person carpool: Davenport:
4.0% (5)Nebraska:
9.2% (72,443)
In 3 person carpool: Davenport:
1.6% (2)Nebraska:
1.6% (12,650)
Class of workers
Employee of private company: Davenport:
58.3% (82)Nebraska:
64.5% (661,579)
Self-employed in own incorporated business: Davenport:
3.6% (5)Nebraska:
4.2% (43,524)
Private not-for-profit wage and salary workers: Davenport:
14.4% (20)Nebraska:
9.4% (96,798)
Local government workers: Davenport:
5.8% (8)Nebraska:
8.3% (85,057)
State government workers: Davenport:
4.3% (6)Nebraska:
4.6% (46,694)
Federal government workers: Davenport:
3.6% (5)Nebraska:
2.3% (23,964)
Self-employed workers in own not incorporated business: Davenport:
7.9% (11)Nebraska:
6.4% (65,214)
Unpaid family workers: Davenport:
2.2% (3)Nebraska:
0.2% (2,279)
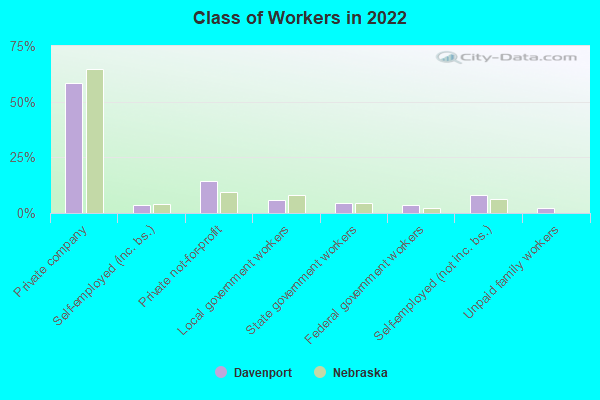
Employee of private company: Davenport:
58.1% (90)Nebraska:
65.6% (575,647)
Self-employed in own incorporated business: Davenport:
1.9% (3)Nebraska:
3.4% (30,129)
Private not-for-profit wage and salary workers: Davenport:
12.9% (20)Nebraska:
8.0% (70,608)
Local government workers: Davenport:
9.0% (14)Nebraska:
6.6% (57,943)
State government workers: Davenport:
4.5% (7)Nebraska:
4.9% (43,368)
Federal government workers: Davenport:
1.3% (2)Nebraska:
2.1% (18,848)
Self-employed workers in own not incorporated business: Davenport:
12.3% (19)Nebraska:
8.7% (76,150)
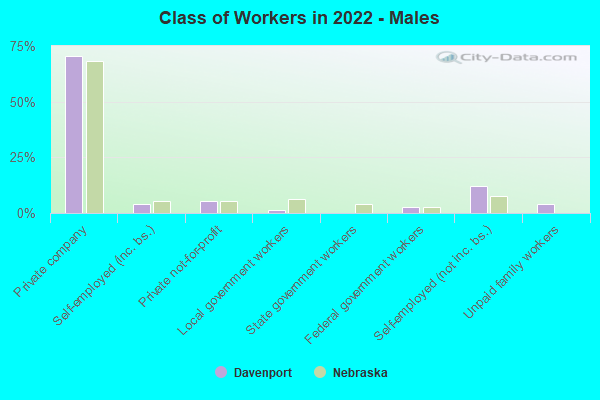
Employee of private company - Males: Davenport:
70.7% (53)Nebraska:
68.3% (373,179)
Self-employed in own incorporated business - Males: Davenport:
4.0% (3)Nebraska:
5.3% (28,970)
Private not-for-profit wage and salary workers - Males: Davenport:
5.3% (4)Nebraska:
5.5% (30,321)
Local government workers - Males: Davenport:
1.3% (1)Nebraska:
6.4% (35,192)
Federal government workers - Males: Davenport:
2.7% (2)Nebraska:
2.5% (13,587)
Self-employed workers in own not incorporated business - Males: Davenport:
12.0% (9)Nebraska:
7.7% (42,200)
Unpaid family workers - Males: Davenport:
4.0% (3)Nebraska:
0.2% (1,191)
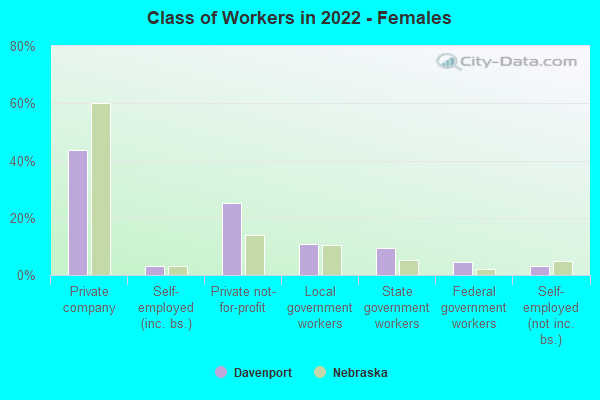
Employee of private company - Females: Davenport:
43.8% (28)Nebraska:
60.2% (288,400)
Self-employed in own incorporated business - Females: Davenport:
3.1% (2)Nebraska:
3.0% (14,554)
Private not-for-profit wage and salary workers - Females: Davenport:
25.0% (16)Nebraska:
13.9% (66,477)
Local government workers - Females: Davenport:
10.9% (7)Nebraska:
10.4% (49,865)
State government workers - Females: Davenport:
9.4% (6)Nebraska:
5.2% (24,992)
Federal government workers - Females: Davenport:
4.7% (3)Nebraska:
2.2% (10,377)
Self-employed workers in own not incorporated business - Females: Davenport:
3.1% (2)Nebraska:
4.8% (23,014)