Work and Jobs in Durham, North Carolina (NC) Detailed Stats
Occupations, Industries, Unemployment, Workers, Commute
Settings
X


Recent posts about work in Durham, North Carolina on our local forum with over 2,400,000 registered users:

Latest news about work in Durham, NC collected exclusively by city-data.com from local newspapers, TV, and radio stations
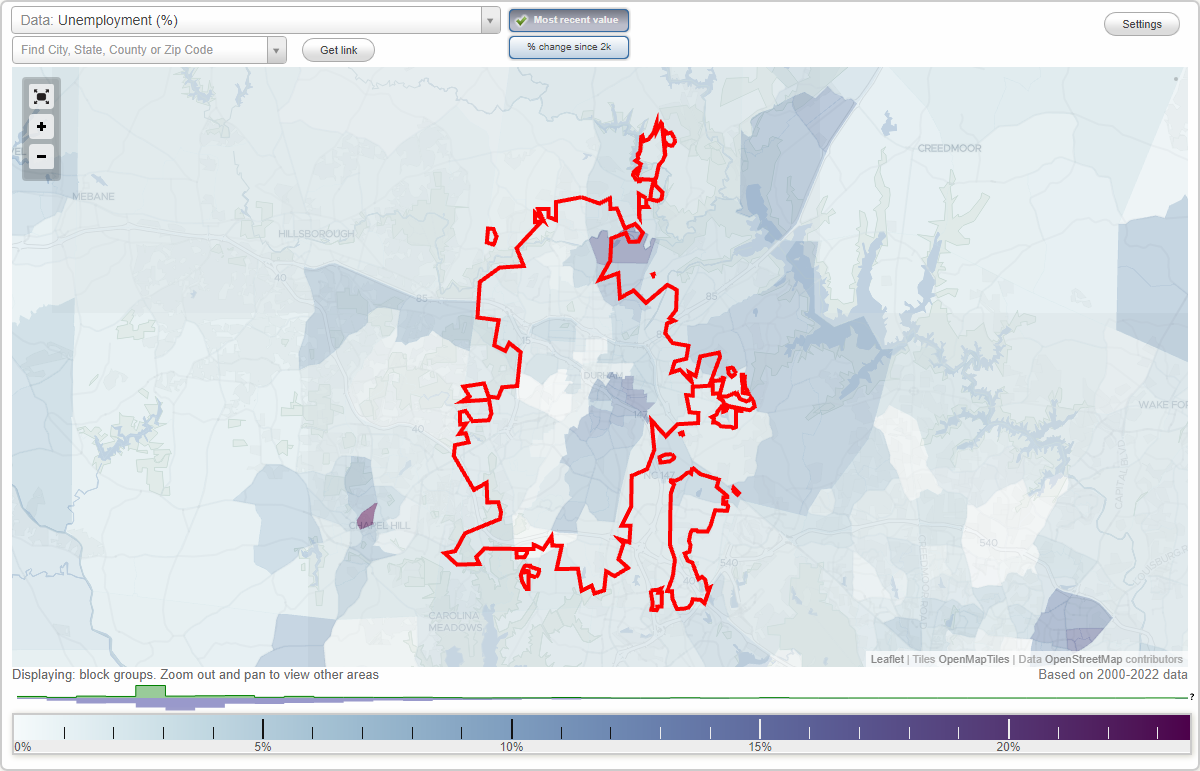
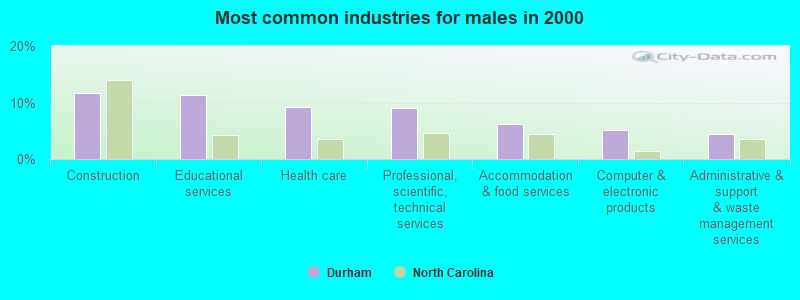
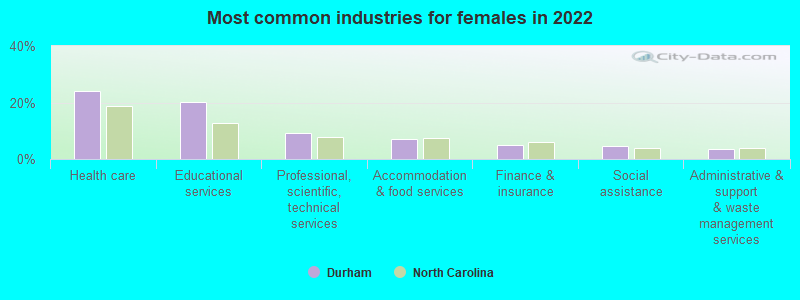
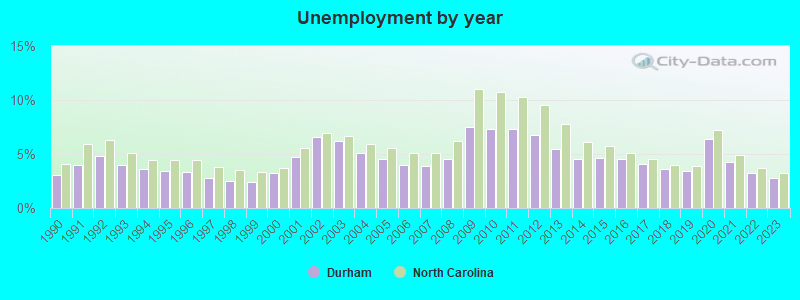
The unemployment rate in 2023 in Durham, NC was 2.8%, which was 14.3% less than the unemployment rate of 3.2% across the entire state of North Carolina. Compared to the unemployment rate of 5.5% in 2013, this represents a decrease of 96.4%. According to 2022 data, the most common industries in Durham are: Educational services (17.4% of civilian employees), Health care (17.3% of civilian employees), Professional, scientific, technical services (9.9% of civilian employees). 77.0% of workers work in Durham County and 22.5% of all workers work at home. 61.3% of workers are employees of private companies, which is 12.1% less than the rate of 68.7% across the entire state of North Carolina.
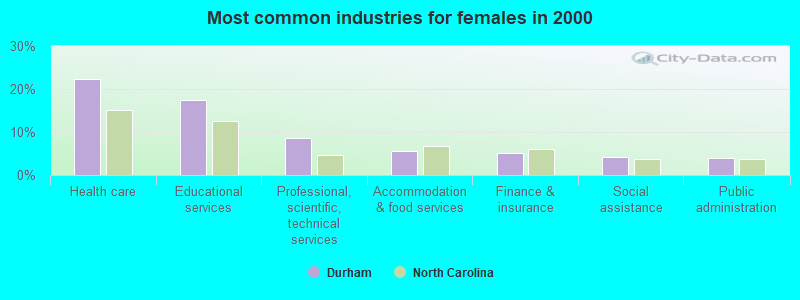
Whole page based on the data from 2000 / 2022 when the population of Durham, North Carolina was 187,035 / 291,844
Whole page based on the data from 2000 / 2022 when the population of Durham, North Carolina was 187,035 / 291,844
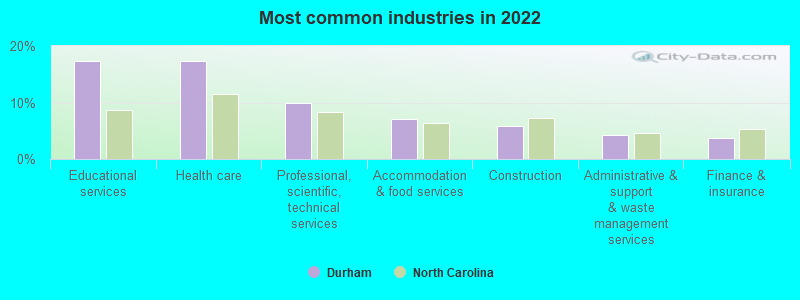
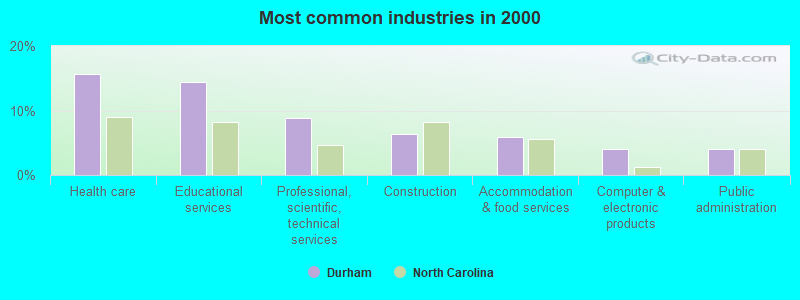
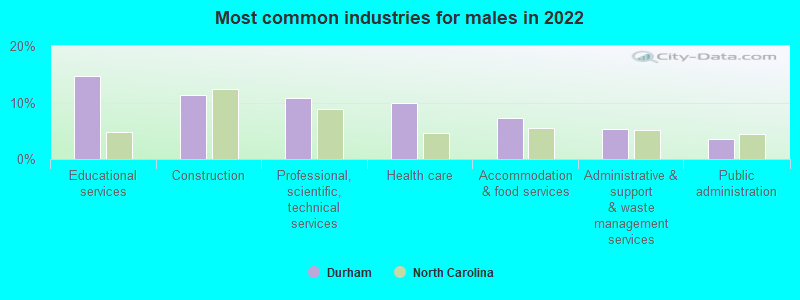
Most common industries
Most common industries | Most common industries | |||||
|---|---|---|---|---|---|---|
Industry | All | Males | Females | All | Males | Females |
| Educational services | 17.4% (23,381) | 14.7% (9,523) | 20.0% (13,858) | 14.3% (13,586) | 11.3% (5,433) | 17.5% (8,153) |
| Health care | 17.3% (23,199) | 9.9% (6,445) | 24.2% (16,754) | 15.7% (14,848) | 9.2% (4,451) | 22.3% (10,397) |
| Professional, scientific, and technical services | 9.9% (13,316) | 10.8% (6,984) | 9.1% (6,332) | 8.8% (8,306) | 9.0% (4,355) | 8.5% (3,951) |
| Accommodation and food services | 7.2% (9,596) | 7.2% (4,683) | 7.1% (4,913) | 5.9% (5,599) | 6.2% (2,968) | 5.7% (2,631) |
| Construction | 5.8% (7,760) | 11.3% (7,327) | 0.6% (433) | 6.4% (6,023) | 11.6% (5,598) | 0.9% (425) |
| Administrative and support and waste management services | 4.3% (5,787) | 5.3% (3,413) | 3.4% (2,374) | 3.6% (3,416) | 4.3% (2,091) | 2.8% (1,325) |
| Finance and insurance | 3.8% (5,059) | 2.5% (1,626) | 5.0% (3,433) | 3.9% (3,732) | 2.8% (1,339) | 5.1% (2,393) |
| Public administration | 3.3% (4,391) | 3.5% (2,254) | 3.1% (2,137) | 4.0% (3,813) | 4.0% (1,926) | 4.1% (1,887) |
| Social assistance | 2.8% (3,766) | 1.0% (659) | 4.5% (3,107) | 2.4% (2,296) | 0.6% (295) | 4.3% (2,001) |
| Religious, grantmaking, civic, professional, and similar organizations | 2.1% (2,804) | 2.4% (1,568) | 1.8% (1,236) | 1.6% (1,479) | 1.4% (666) | 1.7% (813) |
| Department and other general merchandise stores | 1.6% (2,203) | 1.4% (939) | 1.8% (1,264) | 1.3% (1,213) | 0.8% (380) | 1.8% (833) |
| Chemicals | 1.6% (2,189) | 2.4% (1,555) | 0.9% (634) | 1.8% (1,701) | 1.7% (838) | 1.9% (863) |
| Real estate and rental and leasing | 1.6% (2,090) | 1.9% (1,239) | 1.2% (851) | 1.7% (1,643) | 1.9% (909) | 1.6% (734) |
| Personal and laundry services | 1.5% (2,036) | 1.0% (620) | 2.0% (1,416) | 1.3% (1,217) | 1.1% (522) | 1.5% (695) |
| Arts, entertainment, and recreation | 1.4% (1,914) | 1.6% (1,047) | 1.3% (867) | 1.4% (1,317) | 1.5% (699) | 1.3% (618) |
| Clothing and accessories, including shoe, stores | 1.2% (1,589) | 0.6% (361) | 1.8% (1,228) | 0.6% (534) | 0.4% (169) | 0.8% (365) |
| Food and beverage stores | 1.1% (1,523) | 1.2% (748) | 1.1% (775) | 1.5% (1,415) | 1.7% (826) | 1.3% (589) |
| Other transportation, and support activities, and couriers | 1.1% (1,461) | 1.5% (976) | 0.7% (485) | 0.9% (883) | 1.5% (704) | 0.4% (179) |
| Broadcasting and telecommunications | 1.1% (1,432) | 1.5% (942) | 0.7% (490) | 2.2% (2,053) | 2.2% (1,044) | 2.2% (1,009) |
| Computer and electronic products | 1.0% (1,393) | 1.4% (938) | 0.7% (455) | 4.1% (3,851) | 5.2% (2,491) | 2.9% (1,360) |
| Publishing, and motion picture and sound recording industries | 0.9% (1,181) | 1.0% (635) | 0.8% (546) | 1.1% (1,017) | 1.1% (549) | 1.0% (468) |
| Repair and maintenance | 0.8% (1,064) | 1.4% (892) | 0.2% (172) | 1.0% (939) | 1.8% (869) | 0.2% (70) |
| Utilities | 0.6% (832) | 1.1% (695) | 0.2% (137) | 0.5% (490) | 0.7% (350) | 0.3% (140) |
| U. S. Postal service | 0.6% (789) | 0.8% (513) | 0.4% (276) | 0.5% (500) | 0.7% (341) | 0.3% (159) |
| Furniture and home furnishings, and household appliance stores | 0.5% (732) | 0.5% (322) | 0.6% (410) | 0.5% (436) | 0.6% (308) | 0.3% (128) |
| Truck transportation | 0.5% (681) | 1.0% (626) | 0.1% (55) | 0.7% (670) | 1.2% (588) | 0.2% (82) |
| Radio, TV, and computer stores | 0.5% (641) | 0.8% (504) | 0.2% (137) | 0.8% (754) | 1.0% (496) | 0.6% (258) |
| Building material and garden equipment and supplies dealers | 0.5% (636) | 0.8% (495) | 0.2% (141) | 0.4% (408) | 0.6% (301) | 0.2% (107) |
| Professional and commercial equipment and supplies merchant wholesalers | 0.5% (618) | 0.4% (277) | 0.5% (341) | 0.2% (210) | 0.3% (148) | 0.1% (62) |
| Miscellaneous manufacturing | 0.4% (582) | 0.5% (353) | 0.3% (229) | 0.8% (761) | 0.8% (387) | 0.8% (374) |
| Motor vehicle and parts dealers | 0.4% (562) | 0.6% (377) | 0.3% (185) | 0.7% (665) | 1.2% (595) | 0.2% (70) |
| Agriculture, forestry, fishing and hunting | 0.4% (514) | 0.6% (407) | 0.2% (107) | 0.2% (199) | 0.2% (103) | 0.2% (96) |
| Transportation equipment | 0.4% (500) | 0.7% (432) | 0.1% (68) | 0.3% (328) | 0.6% (282) | 0.1% (46) |
| Private households | 0.3% (436) | 0.0% (30) | 0.6% (406) | 0.3% (329) | 0.1% (60) | 0.6% (269) |
| Data processing, libraries, and other information services | 0.3% (413) | 0.1% (75) | 0.5% (338) | 0.8% (764) | 0.7% (343) | 0.9% (421) |
| Groceries and related products merchant wholesalers | 0.3% (396) | 0.6% (359) | 0.1% (37) | 0.2% (199) | 0.3% (168) | 0.1% (31) |
| Pharmacies and drug stores | 0.3% (386) | 0.3% (171) | 0.3% (215) | 0.5% (514) | 0.5% (217) | 0.6% (297) |
| Gasoline stations | 0.3% (374) | 0.3% (221) | 0.2% (153) | 0.1% (128) | 0.1% (65) | 0.1% (63) |
| Other direct selling establishments | 0.3% (350) | 0.2% (151) | 0.3% (199) | 0.4% (372) | 0.4% (200) | 0.4% (172) |
| Drugs, sundries, and chemical and allied products merchant wholesalers | 0.3% (342) | 0.3% (186) | 0.2% (156) | 0.2% (189) | 0.3% (126) | 0.1% (63) |
| Textile mills and textile products | 0.2% (311) | 0.4% (264) | 0.1% (47) | 0.5% (437) | 0.4% (193) | 0.5% (244) |
| Beverage and tobacco products | 0.2% (296) | 0.5% (296) | 0.0% (0) | 0.4% (333) | 0.6% (266) | 0.1% (67) |
| Used merchandise, gift, novelty, and souvenir, and other miscellaneous stores | 0.2% (294) | 0.2% (161) | 0.2% (133) | 0.2% (222) | 0.2% (84) | 0.3% (138) |
| Miscellaneous nondurable goods merchant wholesalers | 0.2% (292) | 0.2% (141) | 0.2% (151) | 0.2% (218) | 0.3% (168) | 0.1% (50) |
| Air transportation | 0.2% (279) | 0.1% (73) | 0.3% (206) | 0.4% (409) | 0.6% (293) | 0.2% (116) |
| Printing and related support activities | 0.2% (264) | 0.2% (99) | 0.2% (165) | 0.3% (287) | 0.4% (204) | 0.2% (83) |
| Machinery | 0.2% (230) | 0.2% (148) | 0.1% (82) | 0.2% (206) | 0.2% (105) | 0.2% (101) |
| Sporting goods, camera, and hobby and toy stores | 0.2% (215) | 0.3% (178) | 0.1% (37) | 0.1% (136) | 0.2% (75) | 0.1% (61) |
| Nonmetallic mineral products | 0.2% (210) | 0.2% (109) | 0.1% (101) | 0.1% (130) | 0.2% (93) | 0.1% (37) |
| Food | 0.2% (209) | 0.1% (42) | 0.2% (167) | 0.4% (335) | 0.5% (224) | 0.2% (111) |
| Apparel | 0.2% (205) | 0.0% (0) | 0.3% (205) | 0.2% (161) | 0.1% (30) | 0.3% (131) |
| Warehousing and storage | 0.1% (193) | 0.2% (139) | 0.1% (54) | 0.1% (76) | 0.1% (71) | 0.0% (5) |
| Hardware, plumbing and heating equipment, and supplies merchant wholesalers | 0.1% (192) | 0.3% (192) | 0.0% (0) | 0.1% (62) | 0.1% (53) | 0.0% (9) |
| Health and personal care, except drug, stores | 0.1% (159) | 0.1% (53) | 0.2% (106) | 0.2% (163) | 0.1% (50) | 0.2% (113) |
| Book stores and news dealers | 0.1% (147) | 0.1% (73) | 0.1% (74) | 0.1% (139) | 0.1% (61) | 0.2% (78) |
| Music stores | 0.1% (143) | 0.2% (143) | 0.0% (0) | 0.1% (118) | 0.2% (84) | 0.1% (34) |
| Electrical equipment, appliances, and components | 0.1% (132) | 0.2% (132) | 0.0% (0) | 0.3% (284) | 0.5% (231) | 0.1% (53) |
| Wood products | 0.1% (129) | 0.2% (109) | 0.0% (20) | 0.2% (230) | 0.5% (223) | 0.0% (7) |
| Machinery, equipment, and supplies merchant wholesalers | 0.1% (121) | 0.2% (121) | 0.0% (0) | 0.1% (114) | 0.2% (84) | 0.1% (30) |
| Metal and metal products | 0.1% (104) | 0.1% (93) | 0.0% (11) | 0.3% (268) | 0.5% (232) | 0.1% (36) |
| Office supplies and stationery stores | 0.1% (103) | 0.1% (82) | 0.0% (21) | 0.1% (86) | 0.1% (52) | 0.1% (34) |
| Electronic shopping and mail-order houses | 0.1% (94) | 0.1% (52) | 0.1% (42) | 0.1% (99) | 0.1% (57) | 0.1% (42) |
| Lumber and other construction materials merchant wholesalers | 0.1% (94) | 0.1% (94) | 0.0% (0) | 0.1% (74) | 0.2% (74) | 0.0% (0) |
| Furniture and related product manufacturing | 0.1% (88) | 0.1% (88) | 0.0% (0) | 0.3% (307) | 0.4% (214) | 0.2% (93) |
| Paper and paper products merchant wholesalers | 0.1% (82) | 0.1% (82) | 0.0% (0) | 0.1% (131) | 0.1% (60) | 0.2% (71) |
| Plastics and rubber products | 0.0% (60) | 0.1% (39) | 0.0% (21) | 0.2% (149) | 0.2% (90) | 0.1% (59) |
| Paper | 0.0% (50) | 0.0% (21) | 0.0% (29) | 0.1% (81) | 0.1% (66) | 0.0% (15) |
| Recyclable material merchant wholesalers | 0.0% (31) | 0.0% (31) | 0.0% (0) | 0.1% (51) | 0.1% (51) | 0.0% (0) |
| Furniture and home furnishing merchant wholesalers | 0.0% (27) | 0.0% (27) | 0.0% (0) | 0.1% (70) | 0.1% (52) | 0.0% (18) |
| Electrical and electronic goods merchant wholesalers | 0.0% (16) | 0.0% (16) | 0.0% (0) | 0.1% (104) | 0.2% (99) | 0.0% (5) |
| Alcoholic beverages merchant wholesalers | 0.0% (0) | 0.0% (0) | 0.0% (0) | 0.1% (76) | 0.2% (76) | 0.0% (0) |
Unemployment in Durham
- Unemployment by race in 2022
- Unemployment rate for White non-Hispanic residents
- 2.1%Males
- 2.4%Females
- Unemployment rate for Black residents
- 4.8%Males
- 2.7%Females
- Unemployment rate for Asian residents
- 8.6%Males
- 1.3%Females
- Unemployment rate for other race residents
- 1.3%Males
- 1.9%Females
- Unemployment rate for two or more race residents
- 3.5%Males
- 2.2%Females
- Unemployment rate for Hispanic or Latino residents
- 1.5%Males
- 2.5%Females
- Unemployment by race in 2000
- Unemployment rate for White non-Hispanic residents
- 2.7%Males
- 2.4%Females
- Unemployment rate for Black residents
- 9.3%Males
- 8.6%Females
- Unemployment rate for American Indian and Alaska Native residents
- 7.1%Females
- Unemployment rate for Asian residents
- 2.5%Males
- 4.1%Females
- Unemployment rate for other race residents
- 8.8%Males
- 10.5%Females
- Unemployment rate for two or more race residents
- 3.8%Males
- 6.2%Females
- Unemployment rate for Hispanic or Latino residents
- 7.2%Males
- 9.3%Females
Unemployment in 2023:
| Durham: | 2.8% |
| North Carolina: | 3.2% |
Unemployment in 2022:
| Durham: | 3.2% |
| North Carolina: | 3.7% |
Unemployment in 2021:
| Durham: | 4.3% |
| North Carolina: | 4.9% |
Unemployment in 2020:
| Durham: | 6.4% |
| North Carolina: | 7.2% |
Unemployment in 2019:
| Durham: | 3.4% |
| North Carolina: | 3.9% |
Unemployment in 2018:
| Durham: | 3.6% |
| North Carolina: | 4.0% |
Unemployment in 2017:
| Durham: | 4.1% |
| North Carolina: | 4.5% |
Unemployment in 2016:
| Durham: | 4.5% |
| North Carolina: | 5.1% |
Unemployment in 2015:
| Durham: | 4.6% |
| North Carolina: | 5.7% |
Unemployment in 2014:
| Durham: | 4.5% |
| North Carolina: | 6.1% |
Unemployment in 2013:
| Durham: | 5.5% |
| North Carolina: | 7.8% |
Unemployment in 2012:
| Durham: | 6.8% |
| North Carolina: | 9.5% |
Unemployment in 2011:
| Durham: | 7.3% |
| North Carolina: | 10.3% |
Unemployment in 2010:
| Durham: | 7.3% |
| North Carolina: | 10.7% |
Unemployment in 2009:
| Durham: | 7.5% |
| North Carolina: | 11.0% |
Unemployment in 2008:
| Durham: | 4.5% |
| North Carolina: | 6.2% |
Unemployment in 2007:
| Durham: | 3.9% |
| North Carolina: | 5.1% |
Unemployment in 2006:
| Durham: | 4.0% |
| North Carolina: | 5.1% |
Unemployment in 2005:
| Durham: | 4.5% |
| North Carolina: | 5.6% |
Unemployment in 2004:
| Durham: | 5.1% |
| North Carolina: | 5.9% |
Unemployment in 2003:
| Durham: | 6.2% |
| North Carolina: | 6.7% |
Unemployment in 2002:
| Durham: | 6.6% |
| North Carolina: | 6.9% |
Unemployment in 2001:
| Durham: | 4.7% |
| North Carolina: | 5.6% |
Unemployment in 2000:
| Durham: | 3.2% |
| North Carolina: | 3.7% |
Unemployment in 1999:
| Durham: | 2.4% |
| North Carolina: | 3.3% |
Unemployment in 1998:
| Durham: | 2.5% |
| North Carolina: | 3.5% |
Unemployment in 1997:
| Durham: | 2.8% |
| North Carolina: | 3.8% |
Unemployment in 1996:
| Durham: | 3.3% |
| North Carolina: | 4.4% |
Unemployment in 1995:
| Durham: | 3.4% |
| North Carolina: | 4.4% |
Unemployment in 1994:
| Durham: | 3.6% |
| North Carolina: | 4.4% |
Unemployment in 1993:
| Durham: | 4.0% |
| North Carolina: | 5.1% |
Unemployment in 1992:
| Durham: | 4.8% |
| North Carolina: | 6.3% |
Unemployment in 1991:
| Durham: | 4.0% |
| North Carolina: | 5.9% |
Unemployment in 1990:
| Durham: | 3.1% |
| North Carolina: | 4.1% |
Time leaving home to go to work
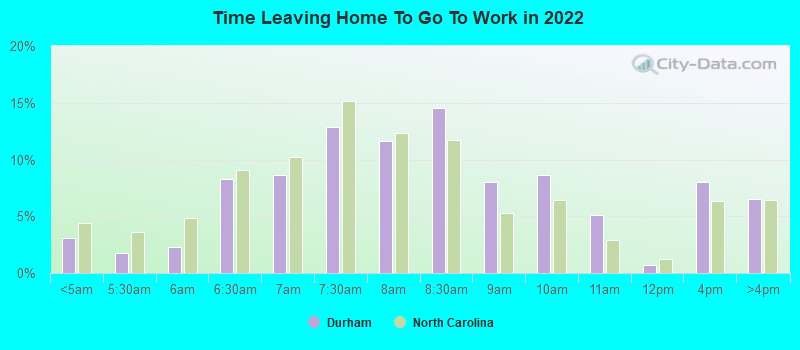
12:00 a.m. to 4:59 a.m.:
| Durham: | 3.1% (3,857) |
| North Carolina: | 4.4% (189,118) |
5:00 a.m. to 5:29 a.m.:
| Durham: | 1.7% (2,172) |
| North Carolina: | 3.6% (155,036) |
5:30 a.m. to 5:59 a.m.:
| Durham: | 2.3% (2,855) |
| North Carolina: | 4.9% (208,473) |
6:00 a.m. to 6:29 a.m.:
| Durham: | 8.3% (10,339) |
| North Carolina: | 9.1% (388,428) |
6:30 a.m. to 6:59 a.m.:
| Durham: | 8.7% (10,874) |
| North Carolina: | 10.2% (434,376) |
7:00 a.m. to 7:29 a.m.:
| Durham: | 12.9% (16,142) |
| North Carolina: | 15.2% (646,838) |
7:30 a.m. to 7:59 a.m.:
| Durham: | 11.6% (14,524) |
| North Carolina: | 12.3% (526,912) |
8:00 a.m. to 8:29 a.m.:
| Durham: | 14.6% (18,253) |
| North Carolina: | 11.8% (501,854) |
8:30 a.m. to 8:59 a.m.:
| Durham: | 8.0% (10,002) |
| North Carolina: | 5.3% (224,334) |
9:00 a.m. to 9:59 a.m.:
| Durham: | 8.7% (10,872) |
| North Carolina: | 6.4% (274,055) |
10:00 a.m. to 10:59 a.m.:
| Durham: | 5.1% (6,378) |
| North Carolina: | 2.9% (122,523) |
11:00 a.m. to 11:59 a.m.:
| Durham: | 0.7% (891) |
| North Carolina: | 1.2% (52,678) |
12:00 p.m. to 3:59 p.m.:
| Durham: | 8.0% (10,027) |
| North Carolina: | 6.3% (269,639) |
4:00 p.m. to 11:59 p.m.:
| Durham: | 6.5% (8,126) |
| North Carolina: | 6.4% (273,318) |
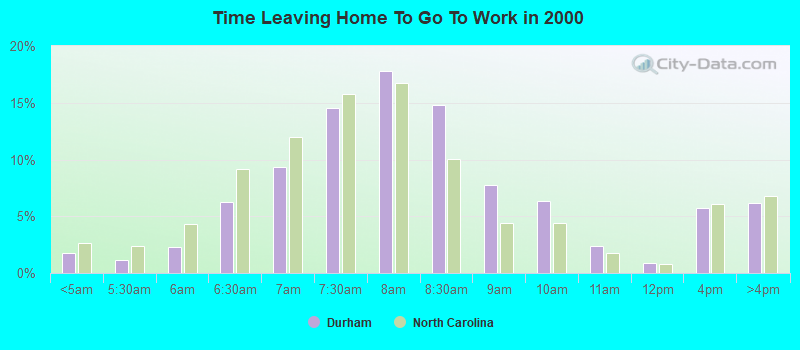
<5am:
| Durham: | 1.8% (1,633) |
| North Carolina: | 2.6% (100,622) |
5:30am:
| Durham: | 1.2% (1,101) |
| North Carolina: | 2.4% (92,195) |
6am:
| Durham: | 2.3% (2,146) |
| North Carolina: | 4.3% (165,079) |
6:30am:
| Durham: | 6.2% (5,816) |
| North Carolina: | 9.2% (352,565) |
7am:
| Durham: | 9.3% (8,660) |
| North Carolina: | 12.0% (460,363) |
7:30am:
| Durham: | 14.5% (13,524) |
| North Carolina: | 15.8% (606,151) |
8am:
| Durham: | 17.8% (16,536) |
| North Carolina: | 16.7% (642,254) |
8:30am:
| Durham: | 14.8% (13,806) |
| North Carolina: | 10.0% (383,802) |
9am:
| Durham: | 7.8% (7,248) |
| North Carolina: | 4.4% (169,515) |
10am:
| Durham: | 6.3% (5,905) |
| North Carolina: | 4.4% (167,594) |
11am:
| Durham: | 2.4% (2,232) |
| North Carolina: | 1.8% (67,524) |
12pm:
| Durham: | 0.9% (849) |
| North Carolina: | 0.8% (30,822) |
4pm:
| Durham: | 5.8% (5,352) |
| North Carolina: | 6.1% (234,783) |
>4pm:
| Durham: | 6.2% (5,759) |
| North Carolina: | 6.8% (261,553) |
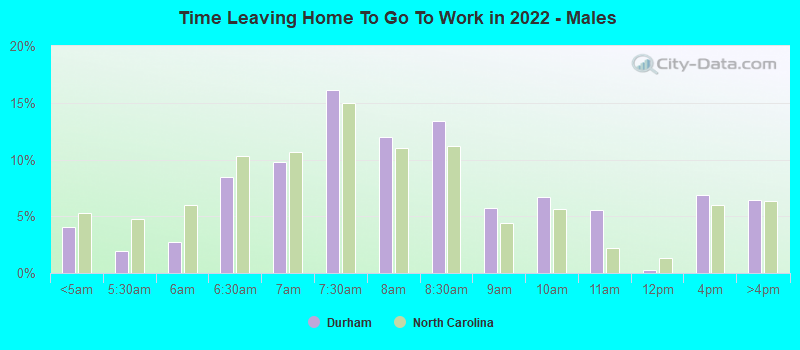
12:00 a.m. to 4:59 a.m. - Males:
| Durham: | 4.0% (2,493) |
| North Carolina: | 5.3% (121,573) |
5:00 a.m. to 5:29 a.m. - Males:
| Durham: | 1.9% (1,185) |
| North Carolina: | 4.7% (108,205) |
5:30 a.m. to 5:59 a.m. - Males:
| Durham: | 2.8% (1,713) |
| North Carolina: | 6.0% (137,395) |
6:00 a.m. to 6:29 a.m. - Males:
| Durham: | 8.5% (5,268) |
| North Carolina: | 10.3% (235,709) |
6:30 a.m. to 6:59 a.m. - Males:
| Durham: | 9.8% (6,050) |
| North Carolina: | 10.6% (243,188) |
7:00 a.m. to 7:29 a.m. - Males:
| Durham: | 16.1% (10,009) |
| North Carolina: | 15.0% (341,869) |
7:30 a.m. to 7:59 a.m. - Males:
| Durham: | 12.0% (7,417) |
| North Carolina: | 11.0% (251,123) |
8:00 a.m. to 8:29 a.m. - Males:
| Durham: | 13.4% (8,284) |
| North Carolina: | 11.1% (254,788) |
8:30 a.m. to 8:59 a.m. - Males:
| Durham: | 5.8% (3,576) |
| North Carolina: | 4.4% (100,206) |
9:00 a.m. to 9:59 a.m. - Males:
| Durham: | 6.7% (4,159) |
| North Carolina: | 5.6% (128,082) |
10:00 a.m. to 10:59 a.m. - Males:
| Durham: | 5.5% (3,416) |
| North Carolina: | 2.2% (51,058) |
11:00 a.m. to 11:59 a.m. - Males:
| Durham: | 0.2% (150) |
| North Carolina: | 1.3% (30,745) |
12:00 p.m. to 3:59 p.m. - Males:
| Durham: | 6.9% (4,268) |
| North Carolina: | 6.0% (136,913) |
4:00 p.m. to 11:59 p.m. - Males:
| Durham: | 6.5% (4,006) |
| North Carolina: | 6.3% (144,489) |
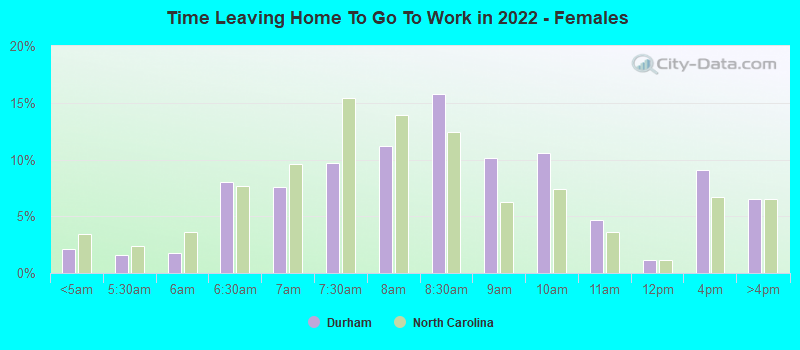
12:00 a.m. to 4:59 a.m. - Females:
| Durham: | 2.2% (1,364) |
| North Carolina: | 3.4% (67,545) |
5:00 a.m. to 5:29 a.m. - Females:
| Durham: | 1.6% (987) |
| North Carolina: | 2.4% (46,831) |
5:30 a.m. to 5:59 a.m. - Females:
| Durham: | 1.8% (1,142) |
| North Carolina: | 3.6% (71,078) |
6:00 a.m. to 6:29 a.m. - Females:
| Durham: | 8.0% (5,071) |
| North Carolina: | 7.7% (152,719) |
6:30 a.m. to 6:59 a.m. - Females:
| Durham: | 7.6% (4,824) |
| North Carolina: | 9.6% (191,188) |
7:00 a.m. to 7:29 a.m. - Females:
| Durham: | 9.7% (6,133) |
| North Carolina: | 15.4% (304,969) |
7:30 a.m. to 7:59 a.m. - Females:
| Durham: | 11.2% (7,107) |
| North Carolina: | 13.9% (275,789) |
8:00 a.m. to 8:29 a.m. - Females:
| Durham: | 15.7% (9,969) |
| North Carolina: | 12.5% (247,066) |
8:30 a.m. to 8:59 a.m. - Females:
| Durham: | 10.1% (6,426) |
| North Carolina: | 6.3% (124,128) |
9:00 a.m. to 9:59 a.m. - Females:
| Durham: | 10.6% (6,713) |
| North Carolina: | 7.4% (145,973) |
10:00 a.m. to 10:59 a.m. - Females:
| Durham: | 4.7% (2,962) |
| North Carolina: | 3.6% (71,465) |
11:00 a.m. to 11:59 a.m. - Females:
| Durham: | 1.2% (741) |
| North Carolina: | 1.1% (21,933) |
12:00 p.m. to 3:59 p.m. - Females:
| Durham: | 9.1% (5,759) |
| North Carolina: | 6.7% (132,726) |
4:00 p.m. to 11:59 p.m. - Females:
| Durham: | 6.5% (4,120) |
| North Carolina: | 6.5% (128,829) |
Travel time to work
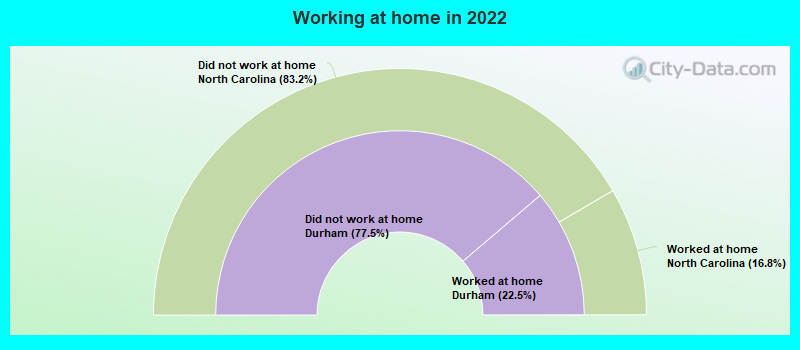
Percentage of workers working in this county: 77.0%
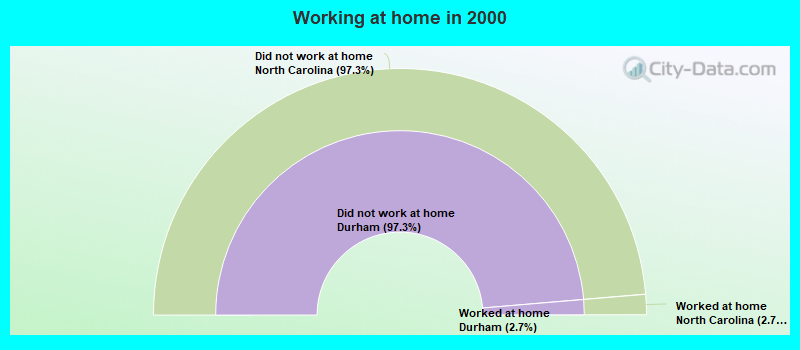
Number of people working at home: 36,328 (22.5% of all workers)
Daytime population change due to commuting: +27,102 (+14.5%)
Workers who live and work in this city: 59,296 (63.7%)
Number of people working at home: 36,328 (22.5% of all workers)
Daytime population change due to commuting: +27,102 (+14.5%)
Workers who live and work in this city: 59,296 (63.7%)
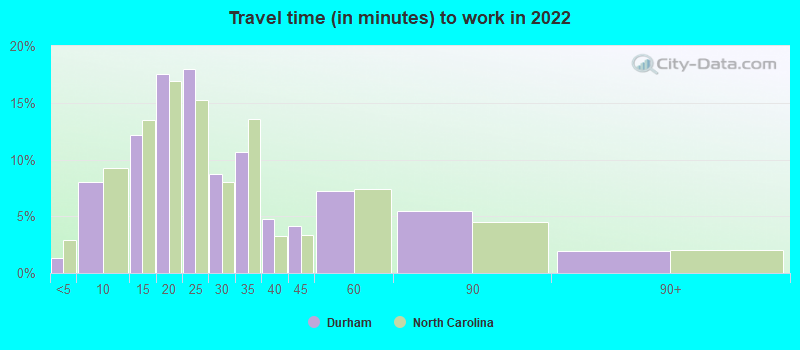
Less than 5 minutes:
| Durham: | 1.3% (2,070) |
| North Carolina: | 2.9% (123,504) |
5 to 9 minutes:
| Durham: | 8.0% (12,625) |
| North Carolina: | 9.3% (396,810) |
10 to 14 minutes:
| Durham: | 12.2% (19,156) |
| North Carolina: | 13.5% (575,735) |
15 to 19 minutes:
| Durham: | 17.6% (27,637) |
| North Carolina: | 16.9% (723,265) |
20 to 24 minutes:
| Durham: | 18.0% (28,280) |
| North Carolina: | 15.3% (652,177) |
25 to 29 minutes:
| Durham: | 8.7% (13,734) |
| North Carolina: | 8.0% (343,459) |
30 to 34 minutes:
| Durham: | 10.7% (16,832) |
| North Carolina: | 13.6% (578,522) |
35 to 39 minutes:
| Durham: | 4.8% (7,530) |
| North Carolina: | 3.3% (140,555) |
40 to 44 minutes:
| Durham: | 4.1% (6,470) |
| North Carolina: | 3.3% (142,520) |
45 to 59 minutes:
| Durham: | 7.2% (11,382) |
| North Carolina: | 7.4% (315,151) |
60 to 89 minutes:
| Durham: | 5.5% (8,627) |
| North Carolina: | 4.5% (190,000) |
90 or more minutes:
| Durham: | 1.9% (3,020) |
| North Carolina: | 2.0% (87,225) |
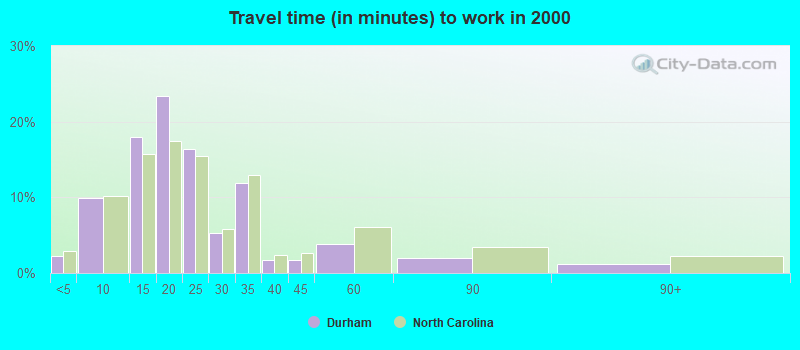
Less than 5 minutes:
| Durham: | 2.2% (2,087) |
| North Carolina: | 2.9% (112,337) |
5 to 9 minutes:
| Durham: | 9.9% (9,196) |
| North Carolina: | 10.2% (391,604) |
10 to 14 minutes:
| Durham: | 17.9% (16,673) |
| North Carolina: | 15.7% (604,412) |
15 to 19 minutes:
| Durham: | 23.4% (21,811) |
| North Carolina: | 17.5% (670,644) |
20 to 24 minutes:
| Durham: | 16.4% (15,261) |
| North Carolina: | 15.5% (592,941) |
25 to 29 minutes:
| Durham: | 5.2% (4,878) |
| North Carolina: | 5.9% (225,523) |
30 to 34 minutes:
| Durham: | 11.9% (11,118) |
| North Carolina: | 12.9% (496,268) |
35 to 39 minutes:
| Durham: | 1.7% (1,550) |
| North Carolina: | 2.4% (92,870) |
40 to 44 minutes:
| Durham: | 1.7% (1,575) |
| North Carolina: | 2.6% (100,049) |
45 to 59 minutes:
| Durham: | 3.8% (3,515) |
| North Carolina: | 6.1% (233,614) |
60 to 89 minutes:
| Durham: | 2.0% (1,823) |
| North Carolina: | 3.4% (129,556) |
90 or more minutes:
| Durham: | 1.2% (1,080) |
| North Carolina: | 2.2% (85,004) |
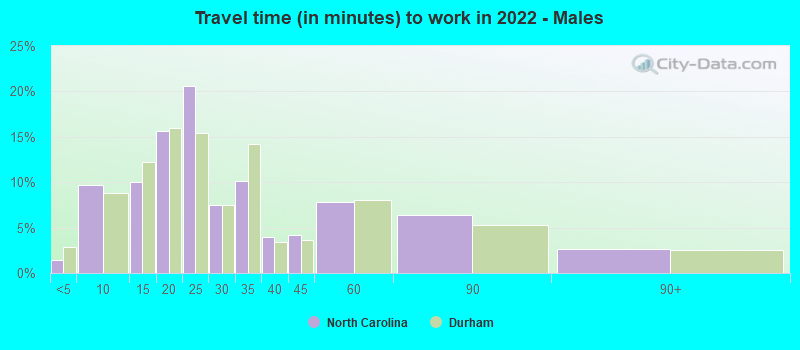
Less than 5 minutes - Males:
| Durham: | 1.4% (1,132) |
| North Carolina: | 2.9% (65,799) |
5 to 9 minutes - Males:
| Durham: | 9.7% (7,737) |
| North Carolina: | 8.8% (199,821) |
10 to 14 minutes - Males:
| Durham: | 10.0% (7,992) |
| North Carolina: | 12.2% (278,460) |
15 to 19 minutes - Males:
| Durham: | 15.7% (12,487) |
| North Carolina: | 16.0% (364,564) |
20 to 24 minutes - Males:
| Durham: | 20.6% (16,434) |
| North Carolina: | 15.4% (351,926) |
25 to 29 minutes - Males:
| Durham: | 7.4% (5,930) |
| North Carolina: | 7.5% (171,897) |
30 to 34 minutes - Males:
| Durham: | 10.1% (8,065) |
| North Carolina: | 14.2% (322,968) |
35 to 39 minutes - Males:
| Durham: | 3.9% (3,136) |
| North Carolina: | 3.4% (78,251) |
40 to 44 minutes - Males:
| Durham: | 4.2% (3,371) |
| North Carolina: | 3.7% (84,002) |
45 to 59 minutes - Males:
| Durham: | 7.8% (6,242) |
| North Carolina: | 8.1% (184,192) |
60 to 89 minutes - Males:
| Durham: | 6.4% (5,108) |
| North Carolina: | 5.3% (121,589) |
90 or more minutes - Males:
| Durham: | 2.6% (2,112) |
| North Carolina: | 2.5% (57,455) |
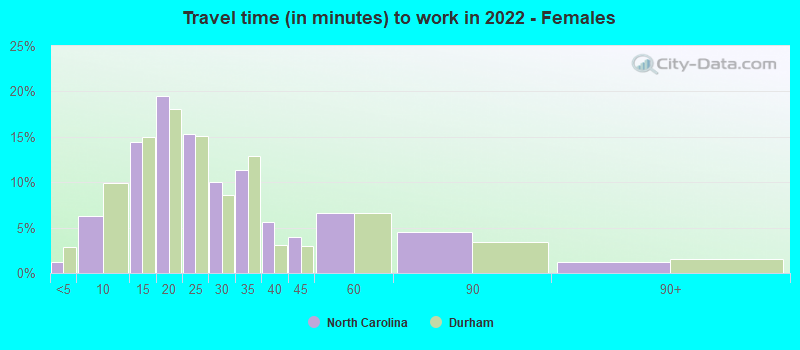
Less than 5 minutes - Females:
| Durham: | 1.2% (938) |
| North Carolina: | 2.9% (57,705) |
5 to 9 minutes - Females:
| Durham: | 6.3% (4,888) |
| North Carolina: | 9.9% (196,989) |
10 to 14 minutes - Females:
| Durham: | 14.4% (11,164) |
| North Carolina: | 15.0% (297,275) |
15 to 19 minutes - Females:
| Durham: | 19.5% (15,150) |
| North Carolina: | 18.0% (358,701) |
20 to 24 minutes - Females:
| Durham: | 15.3% (11,846) |
| North Carolina: | 15.1% (300,251) |
25 to 29 minutes - Females:
| Durham: | 10.1% (7,804) |
| North Carolina: | 8.6% (171,562) |
30 to 34 minutes - Females:
| Durham: | 11.3% (8,767) |
| North Carolina: | 12.9% (255,554) |
35 to 39 minutes - Females:
| Durham: | 5.7% (4,394) |
| North Carolina: | 3.1% (62,304) |
40 to 44 minutes - Females:
| Durham: | 4.0% (3,099) |
| North Carolina: | 2.9% (58,518) |
45 to 59 minutes - Females:
| Durham: | 6.6% (5,140) |
| North Carolina: | 6.6% (130,959) |
60 to 89 minutes - Females:
| Durham: | 4.5% (3,519) |
| North Carolina: | 3.4% (68,411) |
90 or more minutes - Females:
| Durham: | 1.2% (908) |
| North Carolina: | 1.5% (29,770) |
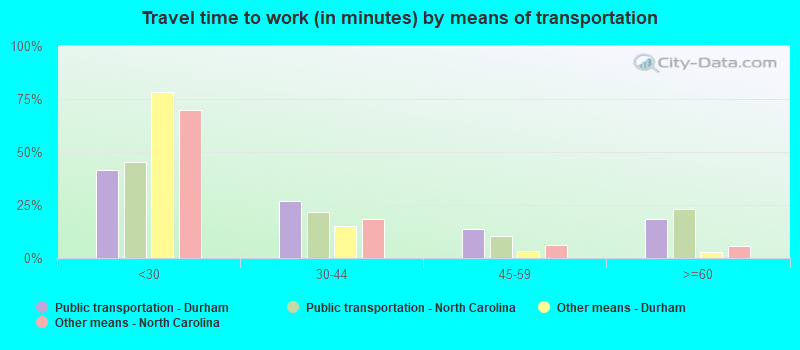
Means of transportation to work
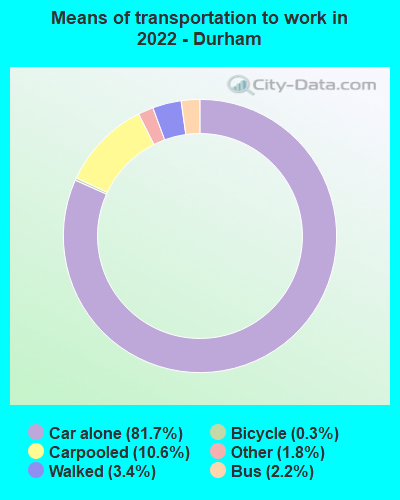
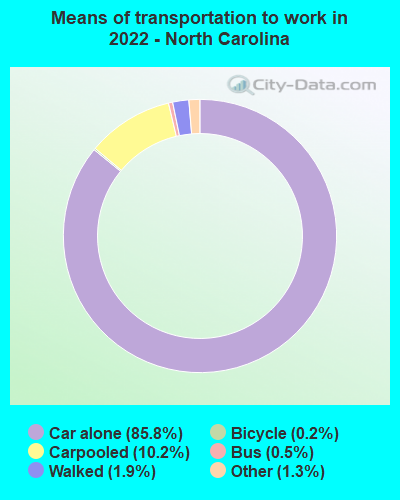
Drove car alone:
| Durham: | 81.7% (128,606) |
| North Carolina: | 85.8% (1,703,704) |
Carpooled:
| Durham: | 10.6% (16,627) |
| North Carolina: | 10.2% (206,652) |
Bus:
| Durham: | 2.2% (3,418) |
| North Carolina: | 0.5% (12,114) |
Bicycle:
| Durham: | 0.3% (525) |
| North Carolina: | 0.2% (2,420) |
Walked:
| Durham: | 3.4% (5,388) |
| North Carolina: | 1.9% (34,898) |
Other means:
| Durham: | 1.8% (2,799) |
| North Carolina: | 1.3% (26,476) |
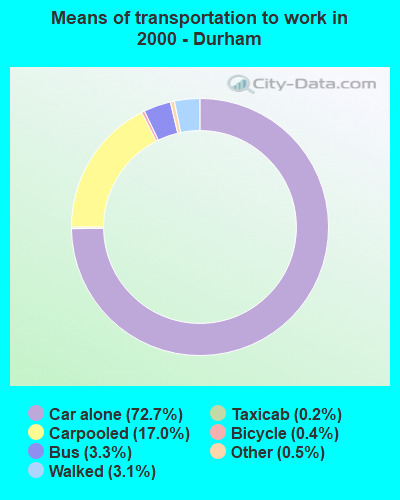
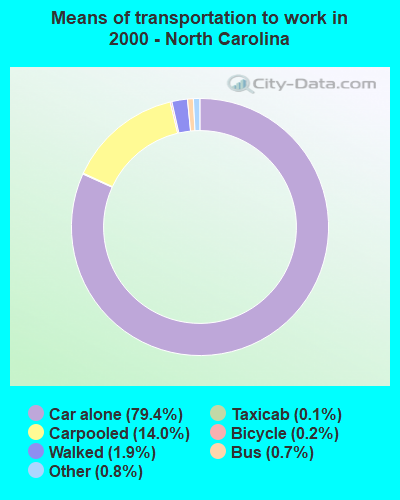
Drove car alone:
| Durham: | 72.7% (67,661) |
| North Carolina: | 79.4% (3,046,666) |
Carpooled:
| Durham: | 17.0% (15,830) |
| North Carolina: | 14.0% (538,264) |
Bus or trolley bus:
| Durham: | 3.3% (3,056) |
| North Carolina: | 0.7% (28,053) |
Subway or elevated:
| Durham: | 0.0% (16) |
| North Carolina: | 0.0% (526) |
Railroad:
| Durham: | 0.0% (6) |
| North Carolina: | 0.0% (481) |
Taxicab:
| Durham: | 0.2% (197) |
| North Carolina: | 0.1% (5,087) |
Motorcycle:
| Durham: | 0.1% (81) |
| North Carolina: | 0.1% (3,610) |
Bicycle:
| Durham: | 0.4% (385) |
| North Carolina: | 0.2% (6,840) |
Walked:
| Durham: | 3.1% (2,881) |
| North Carolina: | 1.9% (74,147) |
Other means:
| Durham: | 0.5% (454) |
| North Carolina: | 0.8% (30,492) |
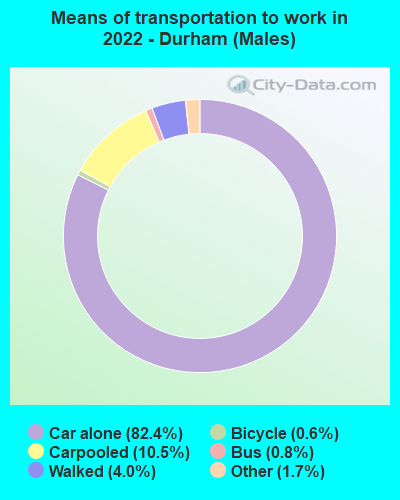
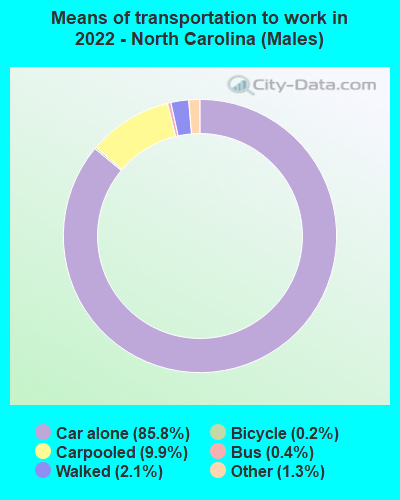
Drove car alone - Males:
| Durham: | 82.4% (65,730) |
| North Carolina: | 85.8% (1,703,704) |
Carpooled - Males:
| Durham: | 10.5% (8,343) |
| North Carolina: | 9.9% (206,652) |
Bus - Males:
| Durham: | 0.8% (677) |
| North Carolina: | 0.4% (12,114) |
Bicycle - Males:
| Durham: | 0.6% (473) |
| North Carolina: | 0.2% (2,420) |
Walked - Males:
| Durham: | 4.0% (3,157) |
| North Carolina: | 2.1% (34,898) |
Other means - Males:
| Durham: | 1.7% (1,366) |
| North Carolina: | 1.3% (26,476) |
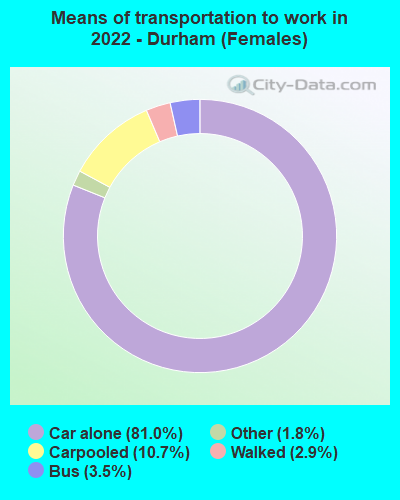
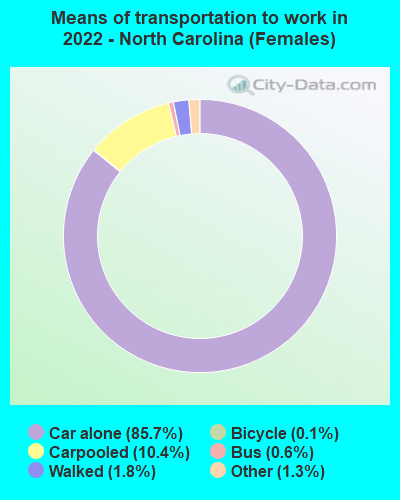
Drove car alone - Females:
| Durham: | 81.0% (62,876) |
| North Carolina: | 85.7% (1,703,704) |
Carpooled - Females:
| Durham: | 10.7% (8,284) |
| North Carolina: | 10.4% (206,652) |
Bus - Females:
| Durham: | 3.5% (2,741) |
| North Carolina: | 0.6% (12,114) |
Bicycle - Females:
| Durham: | 0.1% (52) |
| North Carolina: | 0.1% (2,420) |
Walked - Females:
| Durham: | 2.9% (2,231) |
| North Carolina: | 1.8% (34,898) |
Other means - Females:
| Durham: | 1.8% (1,433) |
| North Carolina: | 1.3% (26,476) |
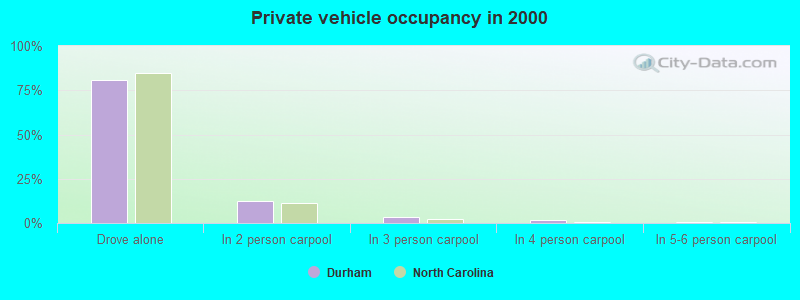
Private vehicle occupancy
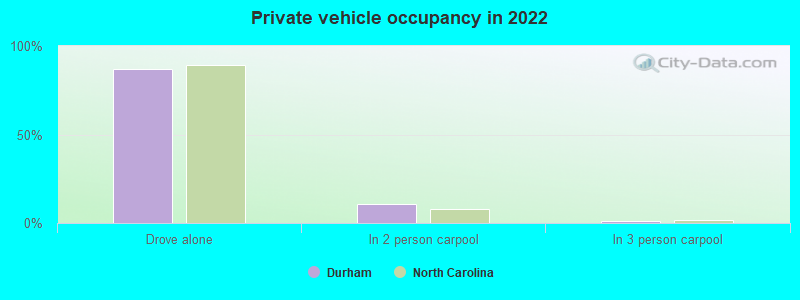
Drove alone:
| Durham: | 86.9% (99,185) |
| North Carolina: | 89.4% (3,653,753) |
In 2 person carpool:
| Durham: | 10.7% (12,176) |
| North Carolina: | 7.9% (322,832) |
In 3 person carpool:
| Durham: | 1.3% (1,454) |
| North Carolina: | 1.7% (71,192) |
In 4 person carpool:
| Durham: | 0.7% (798) |
| North Carolina: | 0.6% (23,321) |
In 5-6 person carpool:
| Durham: | 0.2% (186) |
| North Carolina: | 0.3% (12,230) |
In 7+ person carpool:
| Durham: | 0.3% (287) |
| North Carolina: | 0.1% (5,036) |
Drove alone:
| Durham: | 81.0% (67,661) |
| North Carolina: | 85.0% (3,046,666) |
In 2 person carpool:
| Durham: | 12.5% (10,396) |
| North Carolina: | 11.2% (400,358) |
In 3 person carpool:
| Durham: | 3.6% (3,003) |
| North Carolina: | 2.3% (81,334) |
In 4 person carpool:
| Durham: | 1.8% (1,479) |
| North Carolina: | 0.8% (30,152) |
In 5-6 person carpool:
| Durham: | 0.8% (662) |
| North Carolina: | 0.5% (16,868) |
In 7+ person carpool:
| Durham: | 0.3% (290) |
| North Carolina: | 0.3% (9,552) |
Class of workers
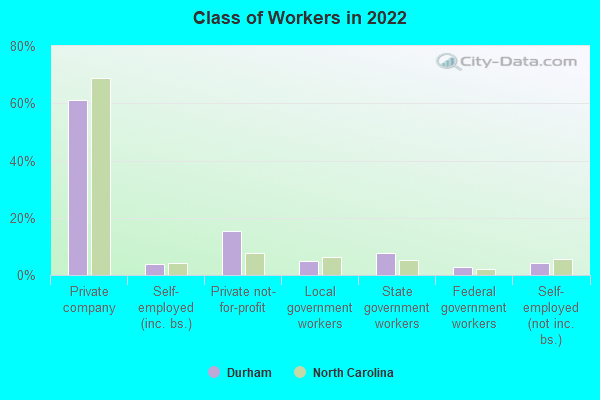
Employee of private company:
| Durham: | 61.3% (101,003) |
| North Carolina: | 68.7% (3,529,512) |
Self-employed in own incorporated business:
| Durham: | 3.9% (6,441) |
| North Carolina: | 4.3% (219,659) |
Private not-for-profit wage and salary workers:
| Durham: | 15.3% (25,143) |
| North Carolina: | 7.6% (387,891) |
Local government workers:
| Durham: | 5.0% (8,223) |
| North Carolina: | 6.2% (319,736) |
State government workers:
| Durham: | 7.6% (12,458) |
| North Carolina: | 5.1% (261,863) |
Federal government workers:
| Durham: | 2.8% (4,557) |
| North Carolina: | 2.2% (110,569) |
Self-employed workers in own not incorporated business:
| Durham: | 4.2% (6,972) |
| North Carolina: | 5.8% (295,305) |
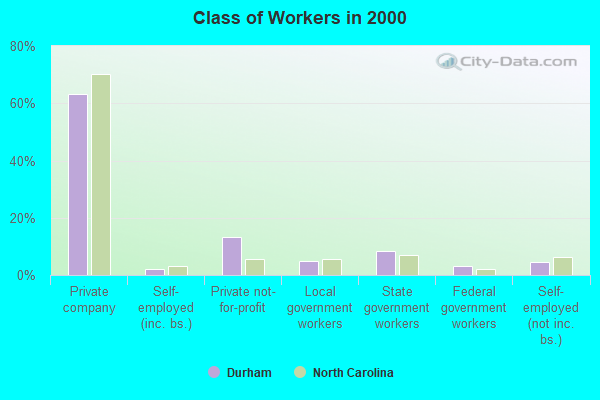
Employee of private company:
| Durham: | 63.2% (59,884) |
| North Carolina: | 70.1% (2,681,729) |
Self-employed in own incorporated business:
| Durham: | 2.0% (1,911) |
| North Carolina: | 3.2% (122,691) |
Private not-for-profit wage and salary workers:
| Durham: | 13.2% (12,545) |
| North Carolina: | 5.5% (208,520) |
Local government workers:
| Durham: | 4.9% (4,641) |
| North Carolina: | 5.6% (213,936) |
State government workers:
| Durham: | 8.6% (8,098) |
| North Carolina: | 6.8% (261,070) |
Federal government workers:
| Durham: | 3.2% (3,044) |
| North Carolina: | 2.1% (81,224) |
Self-employed workers in own not incorporated business:
| Durham: | 4.6% (4,320) |
| North Carolina: | 6.4% (245,017) |
Unpaid family workers:
| Durham: | 0.3% (262) |
| North Carolina: | 0.3% (10,554) |
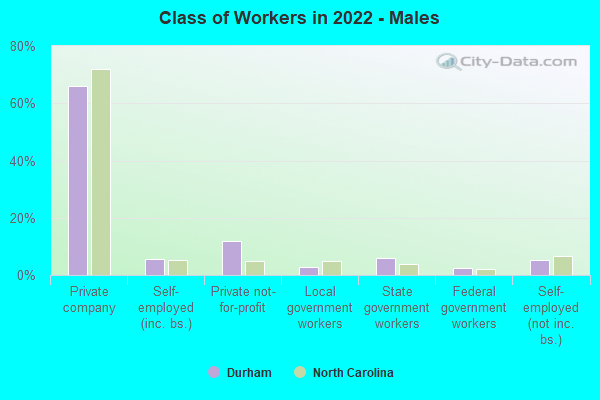
Employee of private company - Males:
| Durham: | 66.0% (53,259) |
| North Carolina: | 71.9% (1,904,075) |
Self-employed in own incorporated business - Males:
| Durham: | 5.6% (4,479) |
| North Carolina: | 5.4% (142,074) |
Private not-for-profit wage and salary workers - Males:
| Durham: | 11.8% (9,485) |
| North Carolina: | 5.0% (133,324) |
Local government workers - Males:
| Durham: | 3.0% (2,388) |
| North Carolina: | 4.7% (125,235) |
State government workers - Males:
| Durham: | 5.9% (4,781) |
| North Carolina: | 3.8% (101,113) |
Federal government workers - Males:
| Durham: | 2.5% (2,016) |
| North Carolina: | 2.2% (56,949) |
Self-employed workers in own not incorporated business - Males:
| Durham: | 5.3% (4,268) |
| North Carolina: | 6.8% (179,491) |
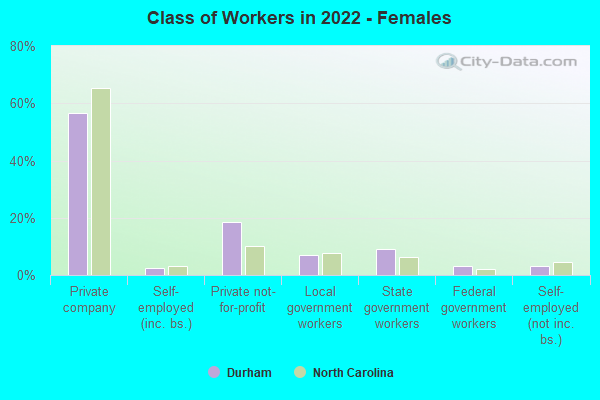
Employee of private company - Females:
| Durham: | 56.8% (47,744) |
| North Carolina: | 65.3% (1,625,437) |
Self-employed in own incorporated business - Females:
| Durham: | 2.3% (1,962) |
| North Carolina: | 3.1% (77,585) |
Private not-for-profit wage and salary workers - Females:
| Durham: | 18.6% (15,658) |
| North Carolina: | 10.2% (254,567) |
Local government workers - Females:
| Durham: | 6.9% (5,835) |
| North Carolina: | 7.8% (194,501) |
State government workers - Females:
| Durham: | 9.1% (7,677) |
| North Carolina: | 6.5% (160,750) |
Federal government workers - Females:
| Durham: | 3.0% (2,541) |
| North Carolina: | 2.2% (53,620) |
Self-employed workers in own not incorporated business - Females:
| Durham: | 3.2% (2,704) |
| North Carolina: | 4.7% (115,814) |