Latest news about work in Georgetown, CA collected exclusively by city-data.com from local newspapers, TV, and radio stations
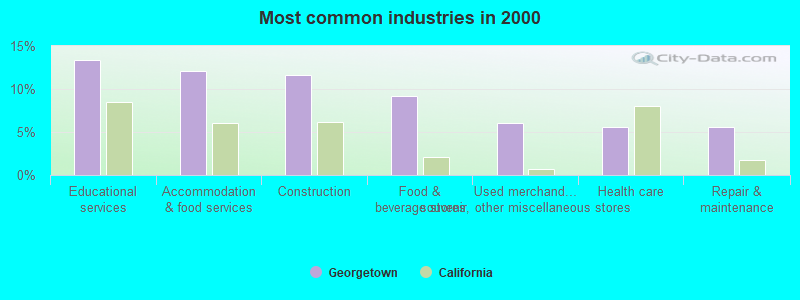
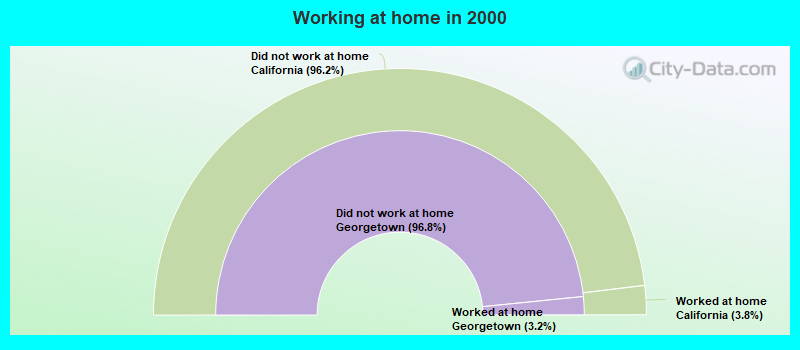
The most common industries in Georgetown are: Educational services (13.3% of civilian employees), Accommodation & food services (12.1% of civilian employees), Construction (11.6% of civilian employees). 55.3% of workers work in El Dorado County and 2.2% of all workers work at home. 66.5% of workers are employees of private companies, which is about the same as the rate of 66.5% across the entire state of California.
Whole page based on the data from 2000 / 2022 when the population of Georgetown, California was 962 / 2,558
Most common industries
Most common industries
Industry
All
Males
Females
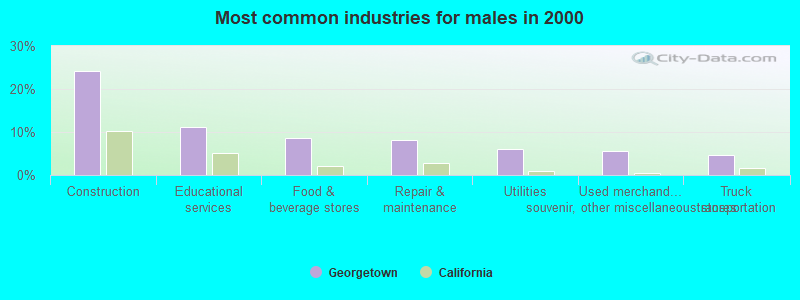
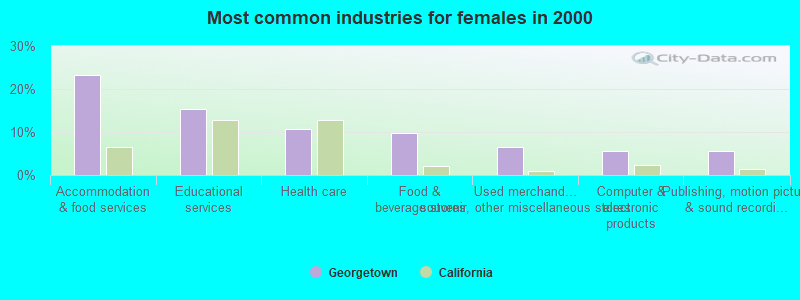
Educational services
13.3% (55)
11.1% (22)
15.3% (33)
Accommodation and food services
12.1% (50)
0.0% (0)
23.3% (50)
Construction
11.6% (48)
24.2% (48)
0.0% (0)
Food and beverage stores
9.2% (38)
8.6% (17)
9.8% (21)
Used merchandise, gift, novelty, and souvenir, and other miscellaneous stores
6.1% (25)
5.6% (11)
6.5% (14)
Health care
5.6% (23)
0.0% (0)
10.7% (23)
Repair and maintenance
5.6% (23)
8.1% (16)
3.3% (7)
Utilities
4.8% (20)
6.1% (12)
3.7% (8)
Publishing, and motion picture and sound recording industries
4.1% (17)
2.5% (5)
5.6% (12)
Arts, entertainment, and recreation
3.9% (16)
4.0% (8)
3.7% (8)
Computer and electronic products
2.9% (12)
0.0% (0)
5.6% (12)
Furniture and related product manufacturing
2.2% (9)
0.0% (0)
4.2% (9)
Truck transportation
2.2% (9)
4.5% (9)
0.0% (0)
Personal and laundry services
2.2% (9)
4.5% (9)
0.0% (0)
Lumber and other construction materials merchant wholesalers
1.9% (8)
4.0% (8)
0.0% (0)
Building material and garden equipment and supplies dealers
1.7% (7)
3.5% (7)
0.0% (0)
Rail transportation
1.7% (7)
3.5% (7)
0.0% (0)
Finance and insurance
1.7% (7)
3.5% (7)
0.0% (0)
Textile mills and textile products
1.5% (6)
0.0% (0)
2.8% (6)
Public administration
1.5% (6)
3.0% (6)
0.0% (0)
Broadcasting and telecommunications
1.5% (6)
3.0% (6)
0.0% (0)
Real estate and rental and leasing
1.5% (6)
0.0% (0)
2.8% (6)
Professional, scientific, and technical services
1.5% (6)
0.0% (0)
2.8% (6)
Unemployment in Georgetown
Unemployment by race in 2022
Unemployment rate for White non-Hispanic residents
18.3%Males
8.5%Females
Unemployment by race in 2000
Unemployment rate for White non-Hispanic residents
10.3%Males
9.8%Females
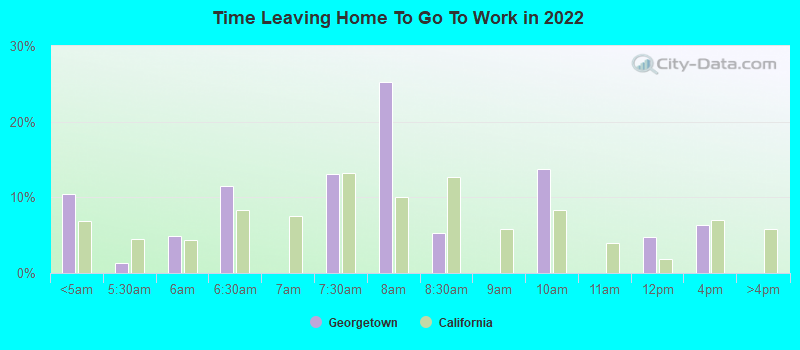
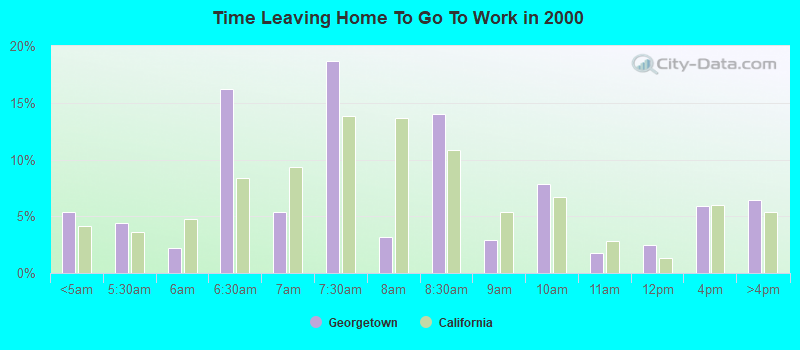
Time leaving home to go to work
12:00 a.m. to 4:59 a.m.:
Georgetown:
10.5% (67)
California:
6.8% (1,050,902)
5:00 a.m. to 5:29 a.m.:
Georgetown:
1.3% (8)
California:
4.5% (692,772)
5:30 a.m. to 5:59 a.m.:
Georgetown:
4.8% (31)
California:
4.3% (665,475)
6:00 a.m. to 6:29 a.m.:
Georgetown:
11.4% (73)
California:
8.3% (1,273,588)
7:00 a.m. to 7:29 a.m.:
Georgetown:
13.1% (84)
California:
13.2% (2,027,702)
7:30 a.m. to 7:59 a.m.:
Georgetown:
25.2% (162)
California:
10.1% (1,550,402)
8:00 a.m. to 8:29 a.m.:
Georgetown:
5.3% (34)
California:
12.7% (1,953,986)
9:00 a.m. to 9:59 a.m.:
Georgetown:
13.8% (88)
California:
8.4% (1,288,499)
11:00 a.m. to 11:59 a.m.:
Georgetown:
4.8% (31)
California:
1.8% (280,975)
12:00 p.m. to 3:59 p.m.:
Georgetown:
6.3% (40)
California:
7.0% (1,075,505)
<5am:
Georgetown:
5.4% (22)
California:
4.2% (606,086)
5:30am:
Georgetown:
4.4% (18)
California:
3.6% (523,209)
6am:
Georgetown:
2.2% (9)
California:
4.8% (692,256)
6:30am:
Georgetown:
16.2% (66)
California:
8.4% (1,216,867)
7am:
Georgetown:
5.4% (22)
California:
9.4% (1,362,830)
7:30am:
Georgetown:
18.7% (76)
California:
13.8% (2,006,950)
8am:
Georgetown:
3.2% (13)
California:
13.7% (1,986,831)
8:30am:
Georgetown:
14.0% (57)
California:
10.9% (1,577,815)
9am:
Georgetown:
2.9% (12)
California:
5.4% (778,152)
10am:
Georgetown:
7.9% (32)
California:
6.7% (972,355)
11am:
Georgetown:
1.7% (7)
California:
2.9% (414,479)
12pm:
Georgetown:
2.5% (10)
California:
1.3% (189,005)
4pm:
Georgetown:
5.9% (24)
California:
6.0% (865,284)
>4pm:
Georgetown:
6.4% (26)
California:
5.3% (776,167)
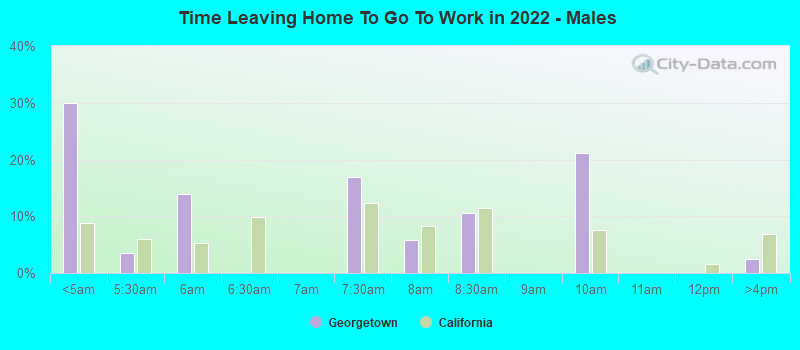
12:00 a.m. to 4:59 a.m. - Males:
Georgetown:
29.9% (73)
California:
8.7% (747,612)
5:00 a.m. to 5:29 a.m. - Males:
Georgetown:
3.5% (8)
California:
6.0% (509,420)
5:30 a.m. to 5:59 a.m. - Males:
Georgetown:
13.9% (34)
California:
5.2% (448,269)
7:00 a.m. to 7:29 a.m. - Males:
Georgetown:
16.9% (41)
California:
12.4% (1,058,532)
7:30 a.m. to 7:59 a.m. - Males:
Georgetown:
5.8% (14)
California:
8.2% (702,727)
8:00 a.m. to 8:29 a.m. - Males:
Georgetown:
10.6% (26)
California:
11.5% (984,538)
9:00 a.m. to 9:59 a.m. - Males:
Georgetown:
21.1% (51)
California:
7.7% (655,038)
12:00 p.m. to 3:59 p.m. - Males:
Georgetown:
2.4% (6)
California:
7.0% (594,847)
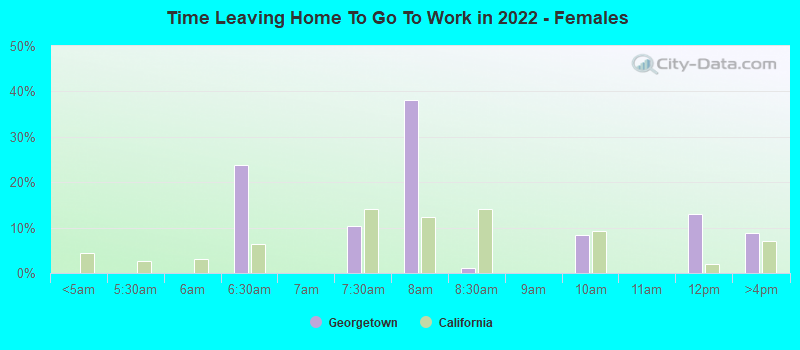
6:00 a.m. to 6:29 a.m. - Females:
Georgetown:
23.8% (96)
California:
6.3% (430,647)
7:00 a.m. to 7:29 a.m. - Females:
Georgetown:
10.4% (42)
California:
14.1% (969,170)
7:30 a.m. to 7:59 a.m. - Females:
Georgetown:
38.1% (154)
California:
12.4% (847,675)
8:00 a.m. to 8:29 a.m. - Females:
Georgetown:
1.1% (5)
California:
14.1% (969,448)
9:00 a.m. to 9:59 a.m. - Females:
Georgetown:
8.4% (34)
California:
9.2% (633,461)
11:00 a.m. to 11:59 a.m. - Females:
Georgetown:
13.0% (53)
California:
2.0% (139,355)
12:00 p.m. to 3:59 p.m. - Females:
Georgetown:
8.7% (35)
California:
7.0% (480,658)
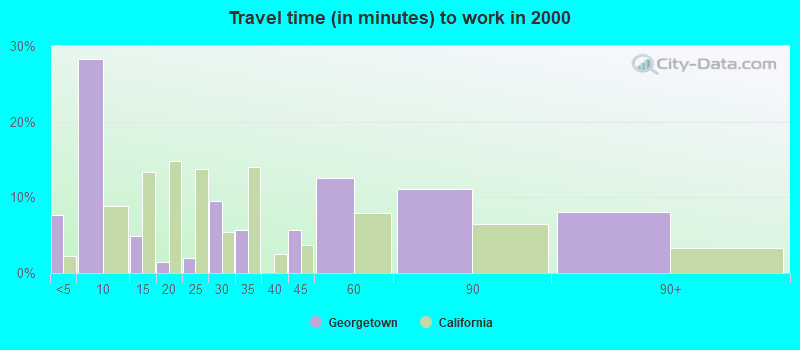
Travel time to work
Percentage of workers working in this county: 55.3% Number of people working at home: 15 (2.2% of all workers)
Less than 5 minutes:
Georgetown:
7.6% (31)
California:
2.2% (324,703)
5 to 9 minutes:
Georgetown:
28.3% (115)
California:
8.8% (1,280,443)
10 to 14 minutes:
Georgetown:
4.9% (20)
California:
13.3% (1,930,263)
15 to 19 minutes:
Georgetown:
1.5% (6)
California:
14.9% (2,157,970)
20 to 24 minutes:
Georgetown:
2.0% (8)
California:
13.8% (2,004,060)
25 to 29 minutes:
Georgetown:
9.6% (39)
California:
5.4% (782,241)
30 to 34 minutes:
Georgetown:
5.7% (23)
California:
13.9% (2,025,657)
40 to 44 minutes:
Georgetown:
5.7% (23)
California:
3.6% (528,043)
45 to 59 minutes:
Georgetown:
12.5% (51)
California:
7.9% (1,151,598)
60 to 89 minutes:
Georgetown:
11.1% (45)
California:
6.4% (933,123)
90 or more minutes:
Georgetown:
8.1% (33)
California:
3.3% (483,698)
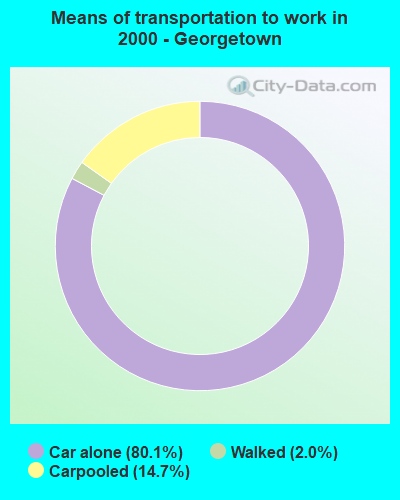
Means of transportation to work
Drove car alone:
Georgetown:
80.1% (326)
California:
71.8% (10,432,462)
Carpooled:
Georgetown:
14.7% (60)
California:
14.5% (2,113,313)
Walked:
Georgetown:
2.0% (8)
California:
2.9% (414,581)
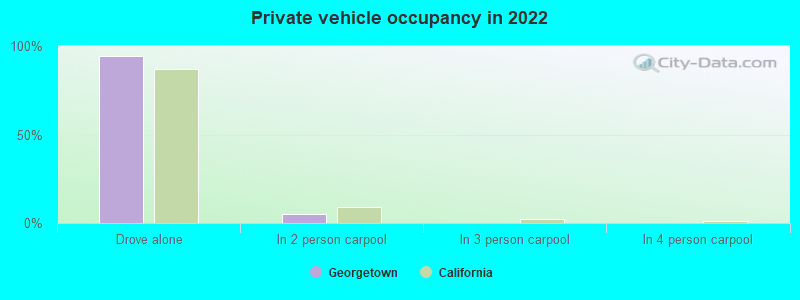
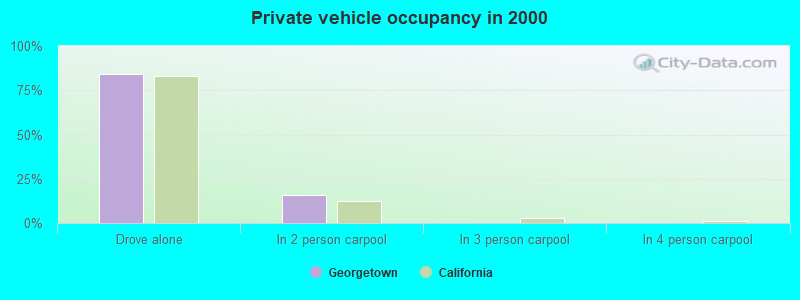
Private vehicle occupancy
Drove alone:
Georgetown:
94.3% (571)
California:
86.9% (12,187,486)
In 2 person carpool:
Georgetown:
5.1% (31)
California:
9.2% (1,295,561)
Drove alone:
Georgetown:
84.5% (326)
California:
83.2% (10,432,462)
In 2 person carpool:
Georgetown:
15.5% (60)
California:
12.5% (1,564,905)
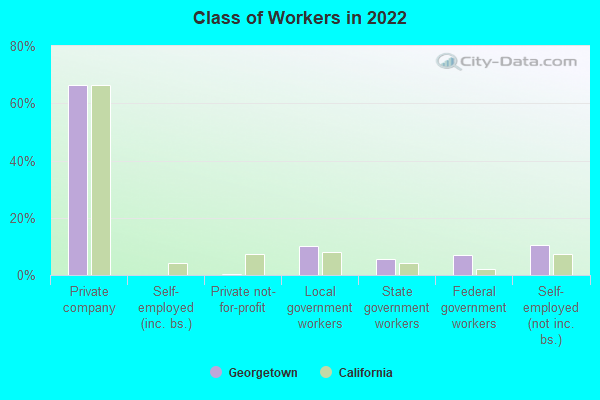
Class of workers
Employee of private company:
Georgetown:
66.5% (466)
California:
66.5% (12,596,030)
Private not-for-profit wage and salary workers:
Georgetown:
0.4% (3)
California:
7.5% (1,417,407)
Local government workers:
Georgetown:
10.0% (70)
California:
8.2% (1,547,056)
State government workers:
Georgetown:
5.7% (40)
California:
4.1% (780,915)
Federal government workers:
Georgetown:
6.8% (48)
California:
2.0% (369,858)
Self-employed workers in own not incorporated business:
Georgetown:
10.6% (74)
California:
7.4% (1,410,735)
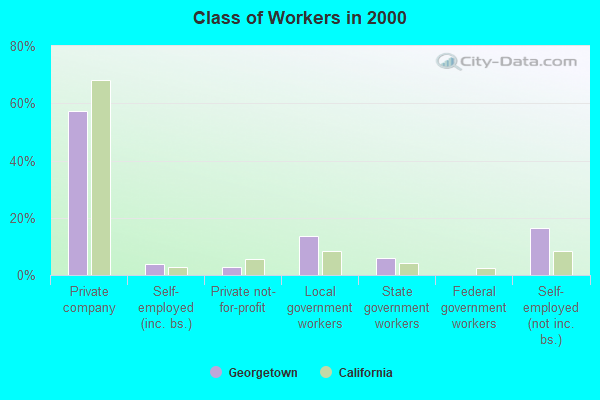
Employee of private company:
Georgetown:
57.4% (237)
California:
68.0% (10,009,465)
Self-employed in own incorporated business:
Georgetown:
3.9% (16)
California:
2.7% (402,392)
Private not-for-profit wage and salary workers:
Georgetown:
2.7% (11)
California:
5.7% (845,536)
Local government workers:
Georgetown:
13.6% (56)
California:
8.3% (1,218,764)
State government workers:
Georgetown:
6.1% (25)
California:
4.0% (594,953)
Self-employed workers in own not incorporated business:
Georgetown:
16.5% (68)
California:
8.5% (1,249,530)
Employee of private company - Males:
Georgetown:
60.1% (161)
California:
70.3% (7,191,252)
Local government workers - Males:
Georgetown:
12.5% (34)
California:
6.0% (610,331)
State government workers - Males:
Georgetown:
13.3% (36)
California:
3.4% (343,636)
Self-employed workers in own not incorporated business - Males:
Georgetown:
14.1% (38)
California:
8.1% (824,359)
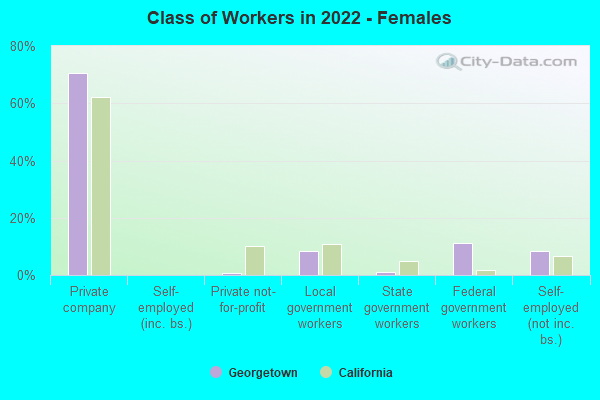
Employee of private company - Females:
Georgetown:
70.4% (305)
California:
62.0% (5,404,778)
Private not-for-profit wage and salary workers - Females:
Georgetown:
0.7% (3)
California:
10.2% (888,285)
Local government workers - Females:
Georgetown:
8.5% (37)
California:
10.8% (936,725)
State government workers - Females:
Georgetown:
0.9% (4)
California:
5.0% (437,279)
Federal government workers - Females:
Georgetown:
11.0% (48)
California:
1.8% (159,984)
Self-employed workers in own not incorporated business - Females:
Georgetown:
8.5% (37)
California:
6.7% (586,376)
Discuss Georgetown, California (CA) on our hugely popular California forum.