Work and Jobs in Holiday Lakes, Ohio (OH) Detailed Stats
Data:
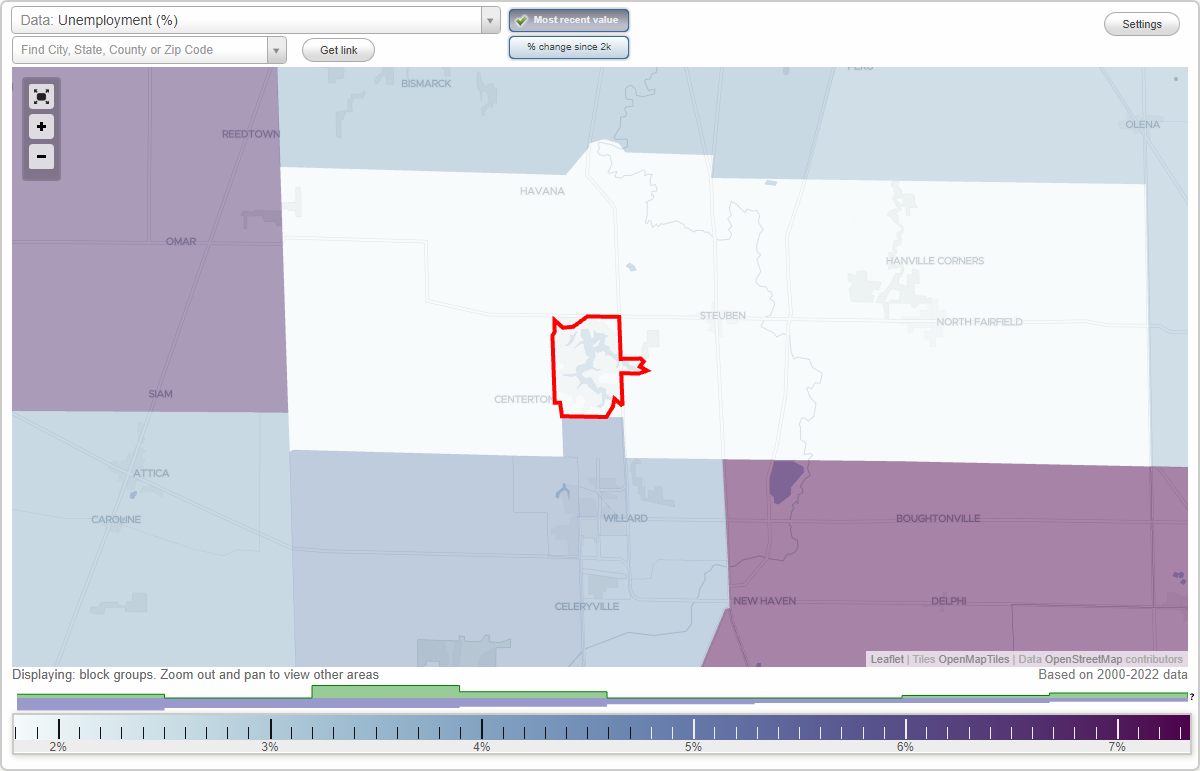
Unemployment (%)
Unemployment (% change since 2000)
Unemployment (%) - White
Unemployment (% change since 2000) - White
Unemployment (%) - Black or African American
Unemployment (% change since 2000) - Black or African American
Unemployment (%) - Asian
Unemployment (% change since 2000) - Asian
Unemployment (%) - Hispanic or Latino
Unemployment (% change since 2000) - Hispanic or Latino
Unemployment (%) - American Indian and Alaska Native
Unemployment (% change since 2000) - American Indian and Alaska Native
Unemployment (%) - Multirace
Unemployment (% change since 2000) - Multirace
Unemployment (%) - Other Race
Unemployment (% change since 2000) - Other Race
Industry diversity
Most Common Industries - Agriculture, forestry, fishing and hunting, and mining (%)
Most Common Industries - Agriculture, forestry, fishing and hunting (%)
Most Common Industries - Mining, quarrying, and oil and gas extraction (%)
Most Common Industries - Construction (%)
Most Common Industries - Manufacturing (%)
Most Common Industries - Wholesale trade (%)
Most Common Industries - Retail trade (%)
Most Common Industries - Transportation and warehousing, and utilities (%)
Most Common Industries - Transportation and warehousing (%)
Most Common Industries - Utilities (%)
Most Common Industries - Information (%)
Most Common Industries - Finance and insurance, and real estate and rental and leasing (%)
Most Common Industries - Finance and insurance (%)
Most Common Industries - Real estate and rental and leasing (%)
Most Common Industries - Professional, scientific, and management, and administrative and waste management services (%)
Most Common Industries - Professional, scientific, and technical services (%)
Most Common Industries - Management of companies and enterprises (%)
Most Common Industries - Administrative and support and waste management services (%)
Most Common Industries - Educational services, and health care and social assistance (%)
Most Common Industries - Educational services (%)
Most Common Industries - Health care and social assistance (%)
Most Common Industries - Arts, entertainment, and recreation, and accommodation and food services (%)
Most Common Industries - Arts, entertainment, and recreation (%)
Most Common Industries - Accommodation and food services (%)
Most Common Industries - Other services, except public administration (%)
Most Common Industries - Public administration (%)
Occupation diversity
Most Common Occupations - Management, business, science, and arts occupations (%)
Most Common Occupations - Management, business, and financial occupations (%)
Most Common Occupations - Management occupations (%)
Most Common Occupations - Business and financial operations occupations (%)
Most Common Occupations - Computer, engineering, and science occupations (%)
Most Common Occupations - Computer and mathematical occupations (%)
Most Common Occupations - Architecture and engineering occupations (%)
Most Common Occupations - Life, physical, and social science occupations (%)
Most Common Occupations - Education, legal, community service, arts, and media occupations (%)
Most Common Occupations - Community and social service occupations (%)
Most Common Occupations - Legal occupations (%)
Most Common Occupations - Education, training, and library occupations (%)
Most Common Occupations - Arts, design, entertainment, sports, and media occupations (%)
Most Common Occupations - Healthcare practitioners and technical occupations (%)
Most Common Occupations - Health diagnosing and treating practitioners and other technical occupations (%)
Most Common Occupations - Health technologists and technicians (%)
Most Common Occupations - Service occupations (%)
Most Common Occupations - Healthcare support occupations (%)
Most Common Occupations - Protective service occupations (%)
Most Common Occupations - Fire fighting and prevention, and other protective service workers including supervisors (%)
Most Common Occupations - Law enforcement workers including supervisors (%)
Most Common Occupations - Food preparation and serving related occupations (%)
Most Common Occupations - Building and grounds cleaning and maintenance occupations (%)
Most Common Occupations - Personal care and service occupations (%)
Most Common Occupations - Sales and office occupations (%)
Most Common Occupations - Sales and related occupations (%)
Most Common Occupations - Office and administrative support occupations (%)
Most Common Occupations - Natural resources, construction, and maintenance occupations (%)
Most Common Occupations - Farming, fishing, and forestry occupations (%)
Most Common Occupations - Construction and extraction occupations (%)
Most Common Occupations - Installation, maintenance, and repair occupations (%)
Most Common Occupations - Production, transportation, and material moving occupations (%)
Most Common Occupations - Production occupations (%)
Most Common Occupations - Transportation occupations (%)
Most Common Occupations - Material moving occupations (%)
Private vehicle occupancy - Drove alone (% change since 2000)
Private vehicle occupancy - Carpooled (%)
Private vehicle occupancy - Carpooled (% change since 2000)
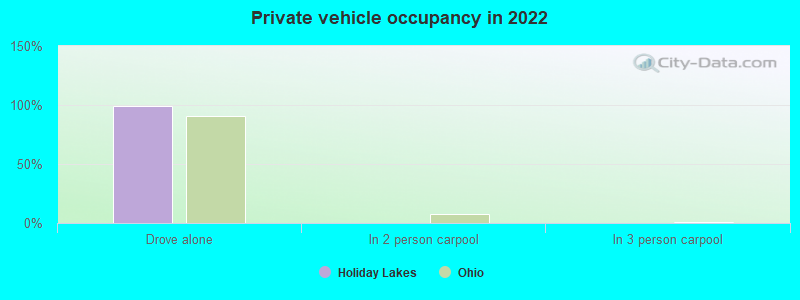
Private vehicle occupancy - In 2-person carpool (%)
Private vehicle occupancy - In 2-person carpool (% change since 2000)
Private vehicle occupancy - In 3-person carpool (%)
Private vehicle occupancy - In 3-person carpool (% change since 2000)
Private vehicle occupancy - In 4-person carpool (%)
Private vehicle occupancy - In 4-person carpool (% change since 2000)
Private vehicle occupancy - In 5- or 6-person carpool (%)
Private vehicle occupancy - In 5- or 6-person carpool (% change since 2000)
Private vehicle occupancy - In 7-or-more-person carpool (%)
Private vehicle occupancy - In 7-or-more-person carpool (% change since 2000)
Time Leaving Home To Go To Work - 12:00 a.m. to 4:59 a.m. (%)
Time Leaving Home To Go To Work - 12:00 a.m. to 4:59 a.m. (% change since 2000)
Time Leaving Home To Go To Work - 5:00 a.m. to 5:59 a.m. (%)
Time Leaving Home To Go To Work - 5:00 a.m. to 5:59 a.m. (% change since 2000)
Time Leaving Home To Go To Work - 6:00 a.m. to 6:59 a.m. (%)
Time Leaving Home To Go To Work - 6:00 a.m. to 6:59 a.m. (% change since 2000)
Time Leaving Home To Go To Work - 7:00 a.m. to 7:59 a.m. (%)
Time Leaving Home To Go To Work - 7:00 a.m. to 7:59 a.m. (% change since 2000)
Time Leaving Home To Go To Work - 8:00 a.m. to 8:59 a.m. (%)
Time Leaving Home To Go To Work - 8:00 a.m. to 8:59 a.m. (% change since 2000)
Time Leaving Home To Go To Work - 9:00 a.m. to 9:59 a.m. (%)
Time Leaving Home To Go To Work - 9:00 a.m. to 9:59 a.m. (% change since 2000)
Time Leaving Home To Go To Work - 10:00 a.m. to 10:59 a.m. (%)
Time Leaving Home To Go To Work - 10:00 a.m. to 10:59 a.m. (% change since 2000)
Time Leaving Home To Go To Work - 11:00 a.m. to 11:59 a.m. (%)
Time Leaving Home To Go To Work - 11:00 a.m. to 11:59 a.m. (% change since 2000)
Time Leaving Home To Go To Work - 12:00 p.m. to 3:59 p.m. (%)
Time Leaving Home To Go To Work - 12:00 p.m. to 3:59 p.m. (% change since 2000)
Time Leaving Home To Go To Work - 4:00 p.m. to 11:59 p.m. (%)
Time Leaving Home To Go To Work - 4:00 p.m. to 11:59 p.m. (% change since 2000)
Class of Workers - Employee of private company (%)
Class of Workers - Employee of private company (% change since 2000)
Class of Workers - Self-employed in own incorporated business (%)
Class of Workers - Self-employed in own incorporated business (% change since 2000)
Class of Workers - Private not-for-profit wage and salary workers (%)
Class of Workers - Private not-for-profit wage and salary workers (% change since 2000)
Class of Workers - Local government workers (%)
Class of Workers - Local government workers (% change since 2000)
Class of Workers - State government workers (%)
Class of Workers - State government workers (% change since 2000)
Class of Workers - Federal government workers (%)
Class of Workers - Federal government workers (% change since 2000)
Class of Workers - Self-employed workers in own not incorporated business and Unpaid family workers (%)
Class of Workers - Self-employed workers in own not incorporated business and Unpaid family workers (% change since 2000)
Means of transportation to work - Drove car alone (%)
Means of transportation to work - Drove car alone (% change since 2000)
Means of transportation to work - Carpooled (%)
Means of transportation to work - Carpooled (% change since 2000)
Means of transportation to work - Public transportation (%)
Means of transportation to work - Public transportation (% change since 2000)
Means of transportation to work - Bus or trolley bus (%)
Means of transportation to work - Bus or trolley bus (% change since 2000)
Means of transportation to work - Streetcar or trolley car (%)
Means of transportation to work - Streetcar or trolley car (% change since 2000)
Means of transportation to work - Subway or elevated (%)
Means of transportation to work - Subway or elevated (% change since 2000)
Means of transportation to work - Railroad (%)
Means of transportation to work - Railroad (% change since 2000)
Means of transportation to work - Ferryboat (%)
Means of transportation to work - Ferryboat (% change since 2000)
Means of transportation to work - Taxicab (%)
Means of transportation to work - Taxicab (% change since 2000)
Means of transportation to work - Motorcycle (%)
Means of transportation to work - Motorcycle (% change since 2000)
Means of transportation to work - Bicycle (%)
Means of transportation to work - Bicycle (% change since 2000)
Means of transportation to work - Walked (%)
Means of transportation to work - Walked (% change since 2000)
Means of transportation to work - Other means (%)
Means of transportation to work - Other means (% change since 2000)
Working at home (%)
Working at home (% change since 2000)
Travel time to work - Less than 5 minutes (%)
Travel time to work - Less than 5 minutes (% change since 2000)
Travel time to work - 5 to 9 minutes (%)
Travel time to work - 5 to 9 minutes (% change since 2000)
Travel time to work - 10 to 19 minutes (%)
Travel time to work - 10 to 19 minutes (% change since 2000)
Travel time to work - 20 to 29 minutes (%)
Travel time to work - 20 to 29 minutes (% change since 2000)
Travel time to work - 30 to 39 minutes (%)
Travel time to work - 30 to 39 minutes (% change since 2000)
Travel time to work - 40 to 59 minutes (%)
Travel time to work - 40 to 59 minutes (% change since 2000)
Travel time to work - 60 to 89 minutes (%)
Travel time to work - 60 to 89 minutes (% change since 2000)
Travel time to work - 90 or more minutes (%)
Travel time to work - 90 or more minutes (% change since 2000)
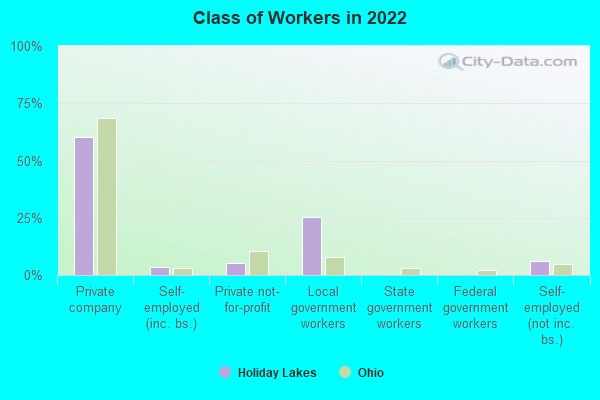
67.9% of workers work in Huron County and 5.1% of all workers work at home. 60.2% of workers are employees of private companies, which is 14.1% less than the rate of 68.7% across the entire state of Ohio.
Whole page based on the data from 2000 / 2022 when the population of Holiday Lakes, Ohio was 749 / 699
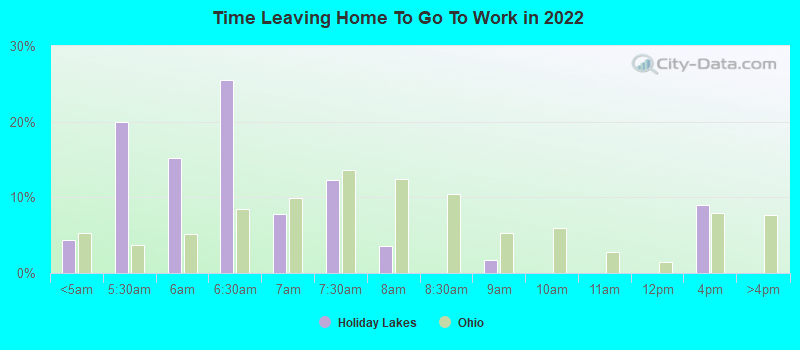
Time leaving home to go to work 12:00 a.m. to 4:59 a.m.: Holiday Lakes:
4.3% (18)Ohio:
5.3% (258,840)
5:00 a.m. to 5:29 a.m.: Holiday Lakes:
20.0% (84)Ohio:
3.7% (180,829)
5:30 a.m. to 5:59 a.m.: Holiday Lakes:
15.2% (64)Ohio:
5.1% (251,854)
6:00 a.m. to 6:29 a.m.: Holiday Lakes:
25.5% (107)Ohio:
8.5% (417,801)
6:30 a.m. to 6:59 a.m.: Holiday Lakes:
7.9% (33)Ohio:
9.9% (486,025)
7:00 a.m. to 7:29 a.m.: Holiday Lakes:
12.3% (52)Ohio:
13.7% (672,711)
7:30 a.m. to 7:59 a.m.: Holiday Lakes:
3.6% (15)Ohio:
12.5% (613,737)
8:30 a.m. to 8:59 a.m.: Holiday Lakes:
1.7% (7)Ohio:
5.3% (263,044)
12:00 p.m. to 3:59 p.m.: Holiday Lakes:
9.0% (38)Ohio:
7.9% (388,951)
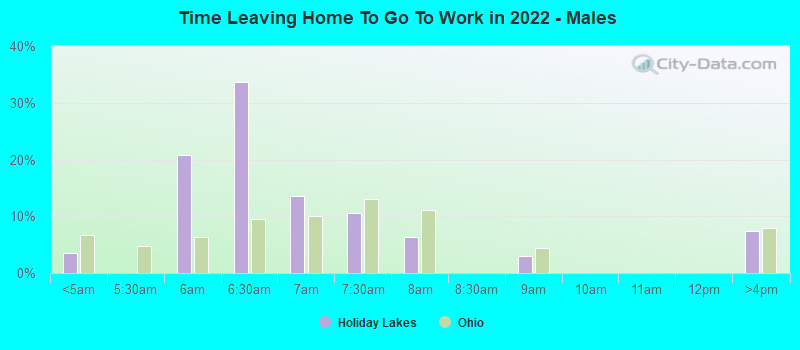
12:00 a.m. to 4:59 a.m. - Males: Holiday Lakes:
3.5% (8)Ohio:
6.6% (173,940)
5:30 a.m. to 5:59 a.m. - Males: Holiday Lakes:
20.8% (50)Ohio:
6.4% (166,812)
6:00 a.m. to 6:29 a.m. - Males: Holiday Lakes:
33.7% (81)Ohio:
9.6% (251,733)
6:30 a.m. to 6:59 a.m. - Males: Holiday Lakes:
13.6% (32)Ohio:
10.1% (265,336)
7:00 a.m. to 7:29 a.m. - Males: Holiday Lakes:
10.6% (25)Ohio:
13.0% (341,660)
7:30 a.m. to 7:59 a.m. - Males: Holiday Lakes:
6.4% (15)Ohio:
11.1% (291,258)
8:30 a.m. to 8:59 a.m. - Males: Holiday Lakes:
3.0% (7)Ohio:
4.5% (117,235)
12:00 p.m. to 3:59 p.m. - Males: Holiday Lakes:
7.3% (18)Ohio:
8.0% (209,869)
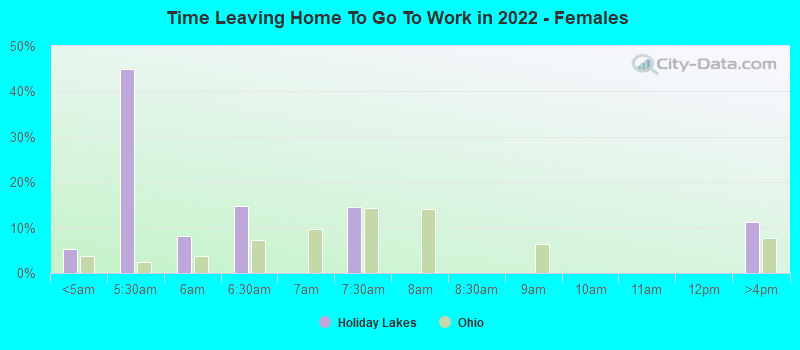
12:00 a.m. to 4:59 a.m. - Females: Holiday Lakes:
5.4% (10)Ohio:
3.7% (84,900)
5:00 a.m. to 5:29 a.m. - Females: Holiday Lakes:
45.0% (81)Ohio:
2.4% (55,937)
5:30 a.m. to 5:59 a.m. - Females: Holiday Lakes:
8.1% (15)Ohio:
3.7% (85,042)
6:00 a.m. to 6:29 a.m. - Females: Holiday Lakes:
14.6% (26)Ohio:
7.2% (166,068)
7:00 a.m. to 7:29 a.m. - Females: Holiday Lakes:
14.5% (26)Ohio:
14.4% (331,051)
12:00 p.m. to 3:59 p.m. - Females: Holiday Lakes:
11.3% (20)Ohio:
7.8% (179,082)
Private vehicle occupancy Drove alone: Holiday Lakes:
99.4% (409)Ohio:
90.6% (4,234,485)
Class of workers
Employee of private company: Holiday Lakes:
60.2% (276)Ohio:
68.7% (3,956,340)
Self-employed in own incorporated business: Holiday Lakes:
3.3% (15)Ohio:
3.1% (178,089)
Private not-for-profit wage and salary workers: Holiday Lakes:
5.3% (24)Ohio:
10.3% (592,258)
Local government workers: Holiday Lakes:
25.2% (116)Ohio:
7.8% (451,488)
Self-employed workers in own not incorporated business: Holiday Lakes:
6.0% (27)Ohio:
5.0% (288,846)
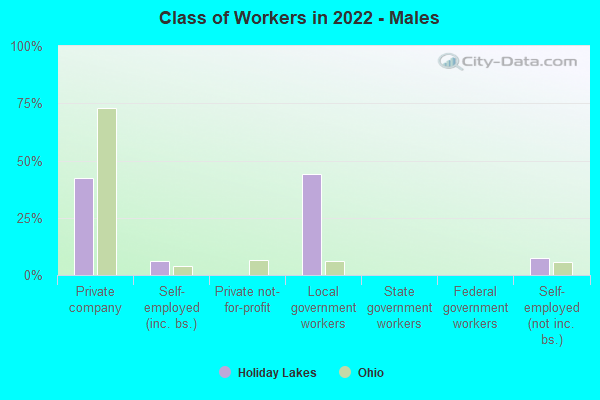
Employee of private company - Males: Holiday Lakes:
42.4% (104)Ohio:
72.8% (2,192,687)
Self-employed in own incorporated business - Males: Holiday Lakes:
6.2% (15)Ohio:
3.9% (118,807)
Local government workers - Males: Holiday Lakes:
44.0% (108)Ohio:
6.0% (180,747)
Self-employed workers in own not incorporated business - Males: Holiday Lakes:
7.4% (18)Ohio:
5.8% (175,472)
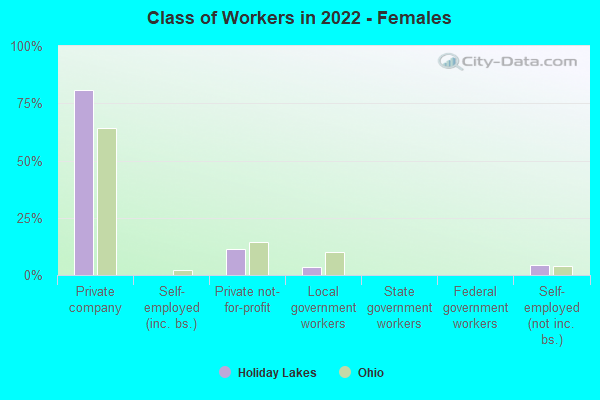
Employee of private company - Females: Holiday Lakes:
80.9% (171)Ohio:
64.1% (1,763,653)
Private not-for-profit wage and salary workers - Females: Holiday Lakes:
11.5% (24)Ohio:
14.3% (394,201)
Local government workers - Females: Holiday Lakes:
3.3% (7)Ohio:
9.8% (270,741)
Self-employed workers in own not incorporated business - Females: Holiday Lakes:
4.3% (9)Ohio:
4.1% (113,374)