Work and Jobs in Home Garden, California (CA) Detailed Stats
Occupations, Industries, Unemployment, Workers, Commute
Settings
X


Discuss Home Garden, California work on our local forum with over 2,400,000 registered users
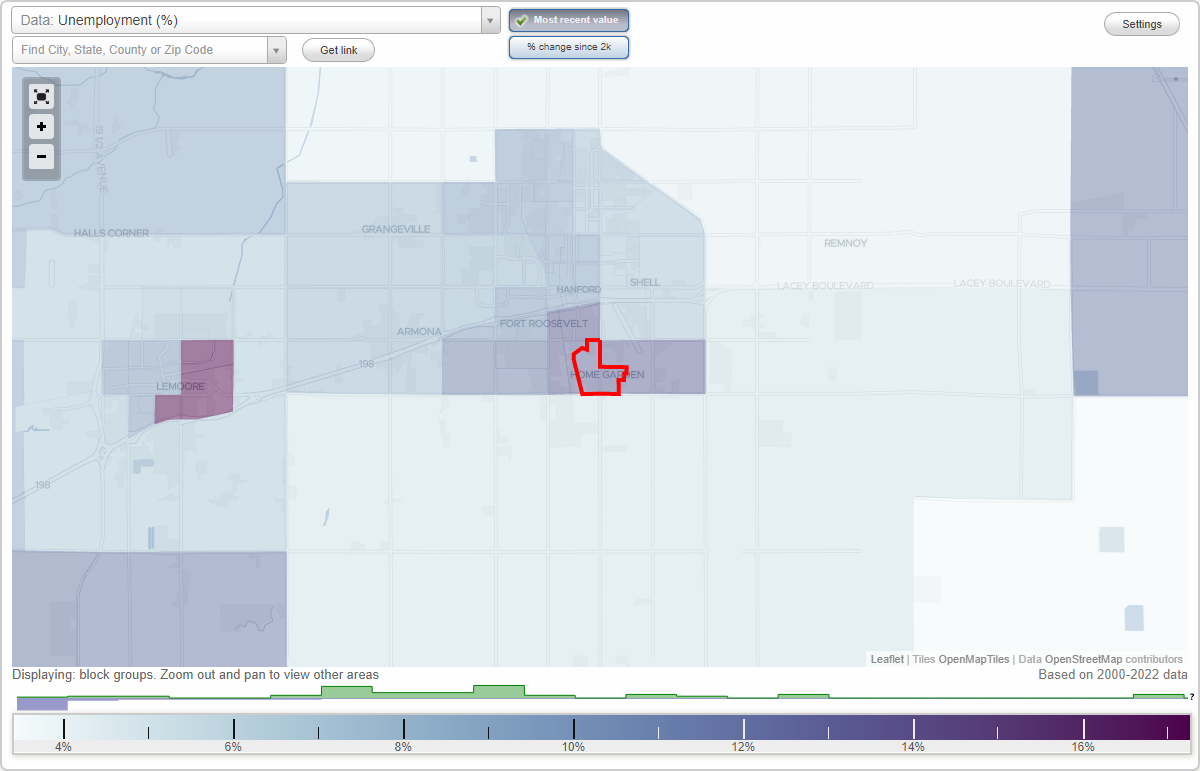
The most common industries in Home Garden are: Accommodation & food services (12.4% of civilian employees), Agriculture, forestry, fishing & hunting (11.6% of civilian employees), Administrative & support & waste management services (8.4% of civilian employees). 82.0% of workers work in Kings County and 1.2% of all workers work at home. 82.6% of workers are employees of private companies, which is 19.5% greater than the rate of 66.5% across the entire state of California.
Whole page based on the data from 2000 / 2022 when the population of Home Garden, California was 1,702 / 1,516
Whole page based on the data from 2000 / 2022 when the population of Home Garden, California was 1,702 / 1,516
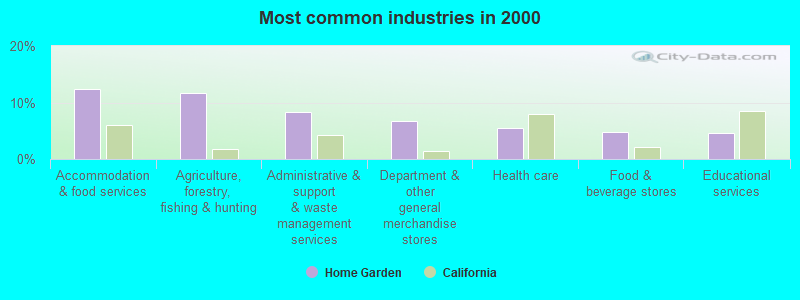
Most common industries
Most common industries | |||
|---|---|---|---|
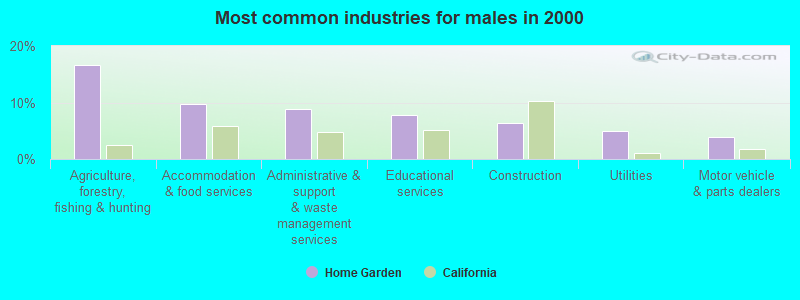
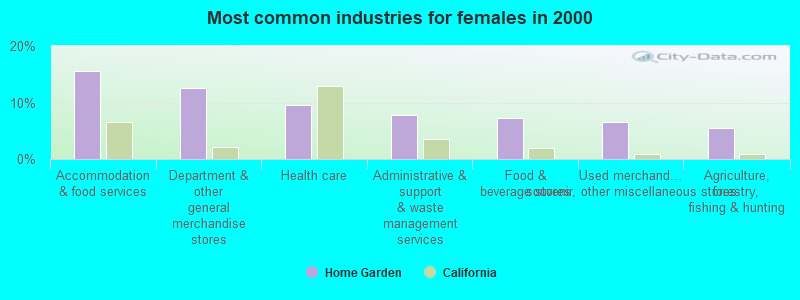
Industry | All | Males | Females |
| Accommodation and food services | 12.4% (46) | 9.8% (20) | 15.7% (26) |
| Agriculture, forestry, fishing and hunting | 11.6% (43) | 16.7% (34) | 5.4% (9) |
| Administrative and support and waste management services | 8.4% (31) | 8.8% (18) | 7.8% (13) |
| Department and other general merchandise stores | 6.8% (25) | 2.0% (4) | 12.7% (21) |
| Health care | 5.4% (20) | 2.0% (4) | 9.6% (16) |
| Food and beverage stores | 4.9% (18) | 2.9% (6) | 7.2% (12) |
| Educational services | 4.6% (17) | 7.8% (16) | 0.6% (1) |
| Construction | 3.5% (13) | 6.4% (13) | 0.0% (0) |
| Other transportation, and support activities, and couriers | 3.2% (12) | 2.9% (6) | 3.6% (6) |
| Public administration | 3.2% (12) | 1.5% (3) | 5.4% (9) |
| Used merchandise, gift, novelty, and souvenir, and other miscellaneous stores | 3.0% (11) | 0.0% (0) | 6.6% (11) |
| Utilities | 2.7% (10) | 4.9% (10) | 0.0% (0) |
| Arts, entertainment, and recreation | 2.7% (10) | 2.5% (5) | 3.0% (5) |
| Miscellaneous manufacturing | 2.4% (9) | 0.0% (0) | 5.4% (9) |
| Motor vehicle and parts dealers | 2.2% (8) | 3.9% (8) | 0.0% (0) |
| Truck transportation | 2.2% (8) | 3.9% (8) | 0.0% (0) |
| Warehousing and storage | 1.9% (7) | 3.4% (7) | 0.0% (0) |
| Groceries and related products merchant wholesalers | 1.9% (7) | 0.0% (0) | 4.2% (7) |
| Printing and related support activities | 1.9% (7) | 3.4% (7) | 0.0% (0) |
| Office supplies and stationery stores | 1.6% (6) | 0.0% (0) | 3.6% (6) |
| Retail florists | 1.4% (5) | 2.5% (5) | 0.0% (0) |
| Professional, scientific, and technical services | 1.4% (5) | 2.5% (5) | 0.0% (0) |
| Book stores and news dealers | 1.4% (5) | 2.5% (5) | 0.0% (0) |
| Real estate and rental and leasing | 1.1% (4) | 0.0% (0) | 2.4% (4) |
| Plastics and rubber products | 1.1% (4) | 2.0% (4) | 0.0% (0) |
| Food | 1.1% (4) | 0.0% (0) | 2.4% (4) |
| Religious, grantmaking, civic, professional, and similar organizations | 1.1% (4) | 0.0% (0) | 2.4% (4) |
| Textile mills and textile products | 0.8% (3) | 1.5% (3) | 0.0% (0) |
| Finance and insurance | 0.8% (3) | 1.5% (3) | 0.0% (0) |
| Farm supplies merchant wholesalers | 0.8% (3) | 1.5% (3) | 0.0% (0) |
| Professional and commercial equipment and supplies merchant wholesalers | 0.8% (3) | 1.5% (3) | 0.0% (0) |
| Miscellaneous nondurable goods merchant wholesalers | 0.5% (2) | 0.0% (0) | 1.2% (2) |
| Apparel | 0.5% (2) | 1.0% (2) | 0.0% (0) |
| Repair and maintenance | 0.5% (2) | 1.0% (2) | 0.0% (0) |
| Private households | 0.3% (1) | 0.0% (0) | 0.6% (1) |
Unemployment in Home Garden
- Unemployment by race in 2022
- Unemployment rate for Black residents
- 4.4%Males
- Unemployment rate for other race residents
- 1.3%Males
- 10.2%Females
- Unemployment rate for two or more race residents
- 5.4%Males
- 21.8%Females
- Unemployment rate for Hispanic or Latino residents
- 3.7%Males
- 21.1%Females
- Unemployment by race in 2000
- Unemployment rate for White non-Hispanic residents
- 31.2%Males
- 23.6%Females
- Unemployment rate for Black residents
- 13.6%Males
- 6.2%Females
- Unemployment rate for other race residents
- 51.4%Males
- 22.2%Females
- Unemployment rate for two or more race residents
- 30.8%Males
- 30.4%Females
- Unemployment rate for Hispanic or Latino residents
- 48.0%Males
- 23.4%Females
Time leaving home to go to work
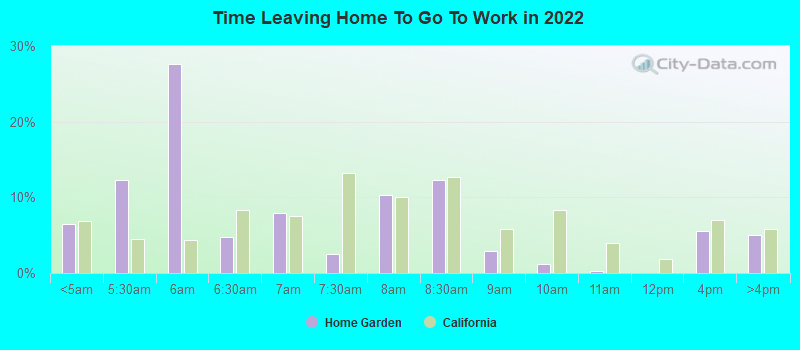
12:00 a.m. to 4:59 a.m.:
| Home Garden: | 6.5% (33) |
| California: | 6.8% (1,050,902) |
5:00 a.m. to 5:29 a.m.:
| Home Garden: | 12.3% (62) |
| California: | 4.5% (692,772) |
5:30 a.m. to 5:59 a.m.:
| Home Garden: | 27.7% (140) |
| California: | 4.3% (665,475) |
6:00 a.m. to 6:29 a.m.:
| Home Garden: | 4.8% (24) |
| California: | 8.3% (1,273,588) |
6:30 a.m. to 6:59 a.m.:
| Home Garden: | 7.9% (40) |
| California: | 7.5% (1,156,338) |
7:00 a.m. to 7:29 a.m.:
| Home Garden: | 2.5% (13) |
| California: | 13.2% (2,027,702) |
7:30 a.m. to 7:59 a.m.:
| Home Garden: | 10.4% (53) |
| California: | 10.1% (1,550,402) |
8:00 a.m. to 8:29 a.m.:
| Home Garden: | 12.3% (62) |
| California: | 12.7% (1,953,986) |
8:30 a.m. to 8:59 a.m.:
| Home Garden: | 2.9% (15) |
| California: | 5.8% (890,950) |
9:00 a.m. to 9:59 a.m.:
| Home Garden: | 1.2% (6) |
| California: | 8.4% (1,288,499) |
10:00 a.m. to 10:59 a.m.:
| Home Garden: | 0.2% (1) |
| California: | 4.0% (613,193) |
12:00 p.m. to 3:59 p.m.:
| Home Garden: | 5.5% (28) |
| California: | 7.0% (1,075,505) |
4:00 p.m. to 11:59 p.m.:
| Home Garden: | 5.0% (25) |
| California: | 5.8% (891,240) |
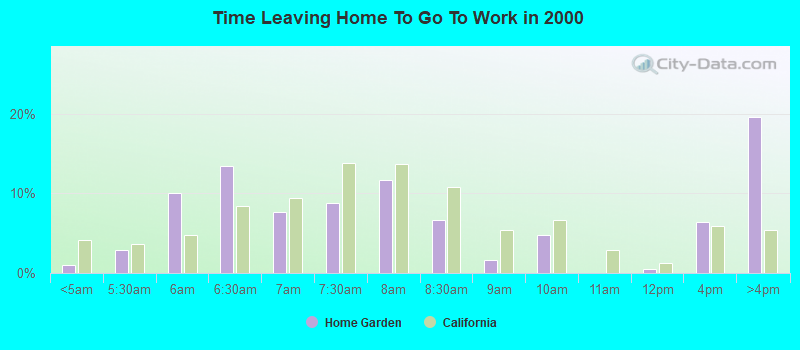
<5am:
| Home Garden: | 1.1% (4) |
| California: | 4.2% (606,086) |
5:30am:
| Home Garden: | 2.9% (11) |
| California: | 3.6% (523,209) |
6am:
| Home Garden: | 10.1% (38) |
| California: | 4.8% (692,256) |
6:30am:
| Home Garden: | 13.5% (51) |
| California: | 8.4% (1,216,867) |
7am:
| Home Garden: | 7.7% (29) |
| California: | 9.4% (1,362,830) |
7:30am:
| Home Garden: | 8.7% (33) |
| California: | 13.8% (2,006,950) |
8am:
| Home Garden: | 11.6% (44) |
| California: | 13.7% (1,986,831) |
8:30am:
| Home Garden: | 6.6% (25) |
| California: | 10.9% (1,577,815) |
9am:
| Home Garden: | 1.6% (6) |
| California: | 5.4% (778,152) |
10am:
| Home Garden: | 4.8% (18) |
| California: | 6.7% (972,355) |
12pm:
| Home Garden: | 0.5% (2) |
| California: | 1.3% (189,005) |
4pm:
| Home Garden: | 6.3% (24) |
| California: | 6.0% (865,284) |
>4pm:
| Home Garden: | 19.6% (74) |
| California: | 5.3% (776,167) |
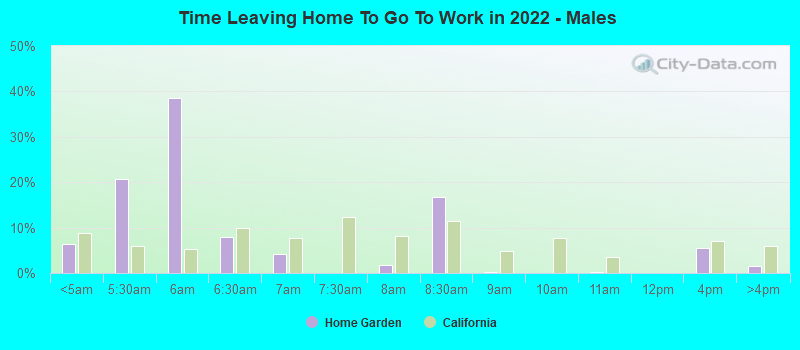
12:00 a.m. to 4:59 a.m. - Males:
| Home Garden: | 6.5% (20) |
| California: | 8.7% (747,612) |
5:00 a.m. to 5:29 a.m. - Males:
| Home Garden: | 20.7% (64) |
| California: | 6.0% (509,420) |
5:30 a.m. to 5:59 a.m. - Males:
| Home Garden: | 38.6% (119) |
| California: | 5.2% (448,269) |
6:00 a.m. to 6:29 a.m. - Males:
| Home Garden: | 8.0% (24) |
| California: | 9.8% (842,941) |
6:30 a.m. to 6:59 a.m. - Males:
| Home Garden: | 4.2% (13) |
| California: | 7.7% (657,557) |
7:30 a.m. to 7:59 a.m. - Males:
| Home Garden: | 1.7% (5) |
| California: | 8.2% (702,727) |
8:00 a.m. to 8:29 a.m. - Males:
| Home Garden: | 16.8% (52) |
| California: | 11.5% (984,538) |
8:30 a.m. to 8:59 a.m. - Males:
| Home Garden: | 0.3% (1) |
| California: | 4.8% (414,815) |
10:00 a.m. to 10:59 a.m. - Males:
| Home Garden: | 0.2% (1) |
| California: | 3.5% (301,425) |
12:00 p.m. to 3:59 p.m. - Males:
| Home Garden: | 5.4% (17) |
| California: | 7.0% (594,847) |
4:00 p.m. to 11:59 p.m. - Males:
| Home Garden: | 1.5% (5) |
| California: | 5.8% (499,471) |
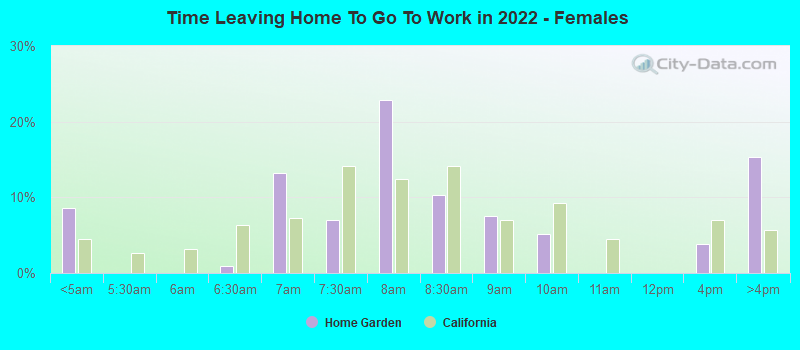
12:00 a.m. to 4:59 a.m. - Females:
| Home Garden: | 8.6% (17) |
| California: | 4.4% (303,290) |
6:00 a.m. to 6:29 a.m. - Females:
| Home Garden: | 0.9% (2) |
| California: | 6.3% (430,647) |
6:30 a.m. to 6:59 a.m. - Females:
| Home Garden: | 13.3% (26) |
| California: | 7.3% (498,781) |
7:00 a.m. to 7:29 a.m. - Females:
| Home Garden: | 6.9% (14) |
| California: | 14.1% (969,170) |
7:30 a.m. to 7:59 a.m. - Females:
| Home Garden: | 22.8% (45) |
| California: | 12.4% (847,675) |
8:00 a.m. to 8:29 a.m. - Females:
| Home Garden: | 10.3% (20) |
| California: | 14.1% (969,448) |
8:30 a.m. to 8:59 a.m. - Females:
| Home Garden: | 7.6% (15) |
| California: | 6.9% (476,135) |
9:00 a.m. to 9:59 a.m. - Females:
| Home Garden: | 5.2% (10) |
| California: | 9.2% (633,461) |
12:00 p.m. to 3:59 p.m. - Females:
| Home Garden: | 3.8% (8) |
| California: | 7.0% (480,658) |
4:00 p.m. to 11:59 p.m. - Females:
| Home Garden: | 15.3% (30) |
| California: | 5.7% (391,769) |
Travel time to work
Percentage of workers working in this county: 82.0%
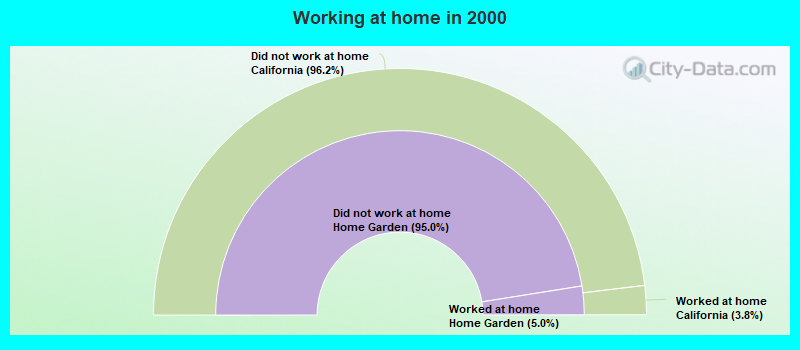
Number of people working at home: 6 (1.2% of all workers)
Number of people working at home: 6 (1.2% of all workers)
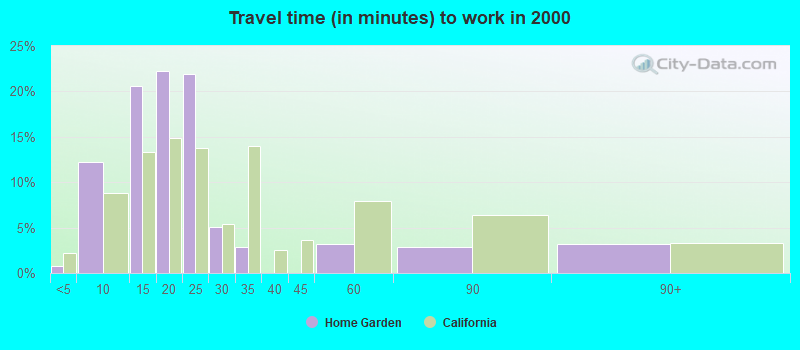
Less than 5 minutes:
| Home Garden: | 0.8% (3) |
| California: | 2.2% (324,703) |
5 to 9 minutes:
| Home Garden: | 12.2% (46) |
| California: | 8.8% (1,280,443) |
10 to 14 minutes:
| Home Garden: | 20.6% (78) |
| California: | 13.3% (1,930,263) |
15 to 19 minutes:
| Home Garden: | 22.2% (84) |
| California: | 14.9% (2,157,970) |
20 to 24 minutes:
| Home Garden: | 22.0% (83) |
| California: | 13.8% (2,004,060) |
25 to 29 minutes:
| Home Garden: | 5.0% (19) |
| California: | 5.4% (782,241) |
30 to 34 minutes:
| Home Garden: | 2.9% (11) |
| California: | 13.9% (2,025,657) |
45 to 59 minutes:
| Home Garden: | 3.2% (12) |
| California: | 7.9% (1,151,598) |
60 to 89 minutes:
| Home Garden: | 2.9% (11) |
| California: | 6.4% (933,123) |
90 or more minutes:
| Home Garden: | 3.2% (12) |
| California: | 3.3% (483,698) |
Means of transportation to work
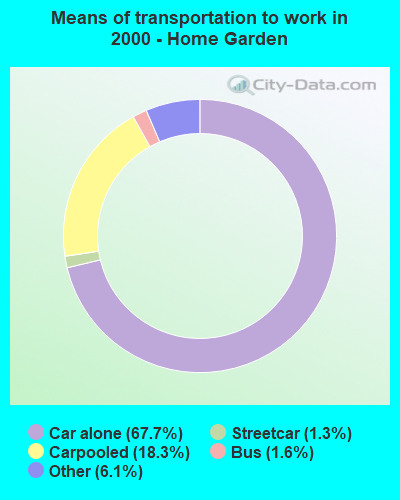

Drove car alone:
| Home Garden: | 67.7% (256) |
| California: | 71.8% (10,432,462) |
Carpooled:
| Home Garden: | 18.3% (69) |
| California: | 14.5% (2,113,313) |
Bus or trolley bus:
| Home Garden: | 1.6% (6) |
| California: | 3.8% (549,425) |
Streetcar or trolley car:
| Home Garden: | 1.3% (5) |
| California: | 0.1% (21,158) |
Other means:
| Home Garden: | 6.1% (23) |
| California: | 0.8% (115,064) |
Private vehicle occupancy
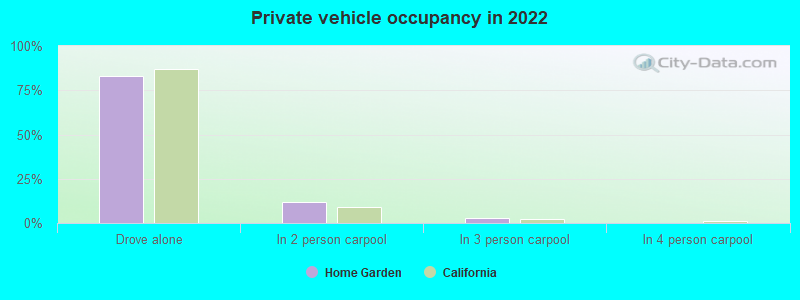
Drove alone:
| Home Garden: | 83.1% (398) |
| California: | 86.9% (12,187,486) |
In 2 person carpool:
| Home Garden: | 12.0% (58) |
| California: | 9.2% (1,295,561) |
In 3 person carpool:
| Home Garden: | 2.9% (14) |
| California: | 2.2% (309,969) |
In 7+ person carpool:
| Home Garden: | 0.6% (3) |
| California: | 0.2% (28,258) |
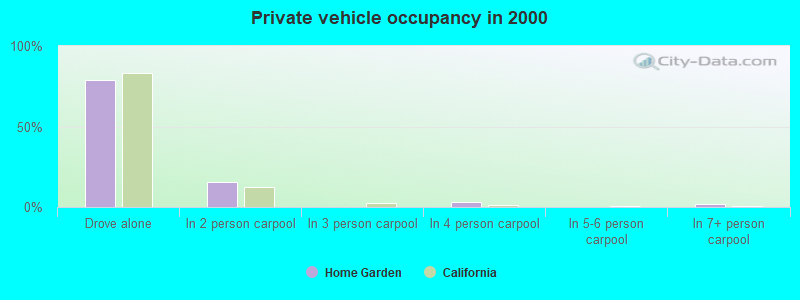
Drove alone:
| Home Garden: | 78.8% (256) |
| California: | 83.2% (10,432,462) |
In 2 person carpool:
| Home Garden: | 15.7% (51) |
| California: | 12.5% (1,564,905) |
In 4 person carpool:
| Home Garden: | 3.4% (11) |
| California: | 1.0% (119,364) |
In 7+ person carpool:
| Home Garden: | 2.2% (7) |
| California: | 0.3% (41,276) |
Class of workers
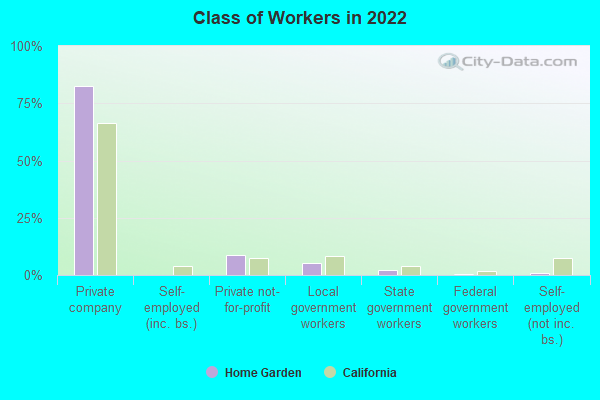
Employee of private company:
| Home Garden: | 82.6% (422) |
| California: | 66.5% (12,596,030) |
Private not-for-profit wage and salary workers:
| Home Garden: | 8.7% (44) |
| California: | 7.5% (1,417,407) |
Local government workers:
| Home Garden: | 5.2% (27) |
| California: | 8.2% (1,547,056) |
State government workers:
| Home Garden: | 2.3% (12) |
| California: | 4.1% (780,915) |
Federal government workers:
| Home Garden: | 0.4% (2) |
| California: | 2.0% (369,858) |
Self-employed workers in own not incorporated business:
| Home Garden: | 0.8% (4) |
| California: | 7.4% (1,410,735) |
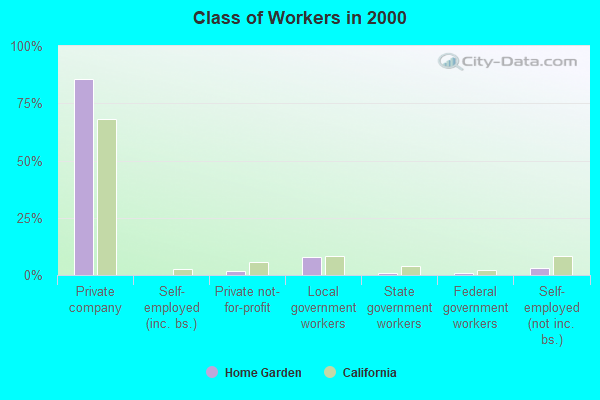
Employee of private company:
| Home Garden: | 85.4% (316) |
| California: | 68.0% (10,009,465) |
Private not-for-profit wage and salary workers:
| Home Garden: | 1.9% (7) |
| California: | 5.7% (845,536) |
Local government workers:
| Home Garden: | 7.8% (29) |
| California: | 8.3% (1,218,764) |
State government workers:
| Home Garden: | 1.1% (4) |
| California: | 4.0% (594,953) |
Federal government workers:
| Home Garden: | 0.8% (3) |
| California: | 2.3% (344,354) |
Self-employed workers in own not incorporated business:
| Home Garden: | 3.0% (11) |
| California: | 8.5% (1,249,530) |
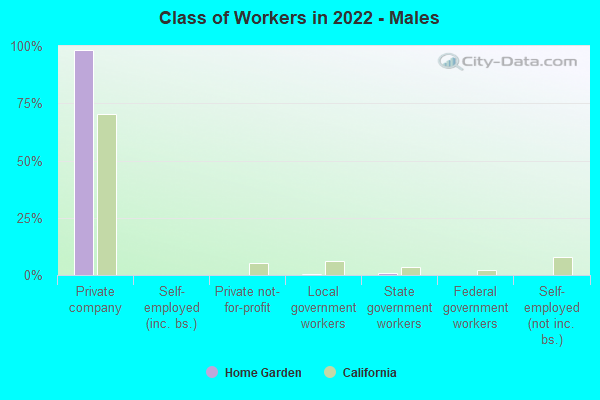
Employee of private company - Males:
| Home Garden: | 98.4% (311) |
| California: | 70.3% (7,191,252) |
Local government workers - Males:
| Home Garden: | 0.6% (2) |
| California: | 6.0% (610,331) |
State government workers - Males:
| Home Garden: | 0.9% (3) |
| California: | 3.4% (343,636) |
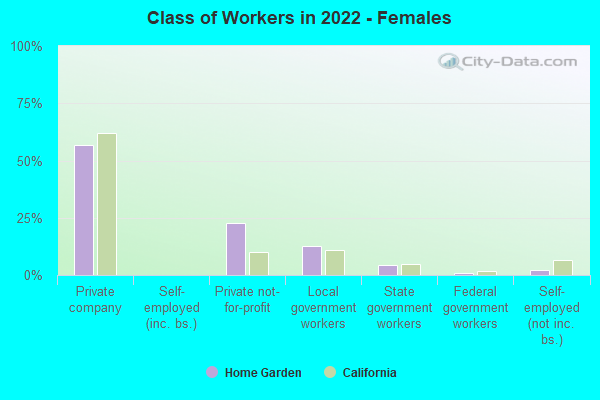
Employee of private company - Females:
| Home Garden: | 56.9% (111) |
| California: | 62.0% (5,404,778) |
Private not-for-profit wage and salary workers - Females:
| Home Garden: | 22.8% (44) |
| California: | 10.2% (888,285) |
Local government workers - Females:
| Home Garden: | 12.7% (25) |
| California: | 10.8% (936,725) |
State government workers - Females:
| Home Garden: | 4.6% (9) |
| California: | 5.0% (437,279) |
Federal government workers - Females:
| Home Garden: | 1.0% (2) |
| California: | 1.8% (159,984) |
Self-employed workers in own not incorporated business - Females:
| Home Garden: | 2.0% (4) |
| California: | 6.7% (586,376) |