Work and Jobs in Ivyland, Pennsylvania (PA) Detailed Stats
Data:
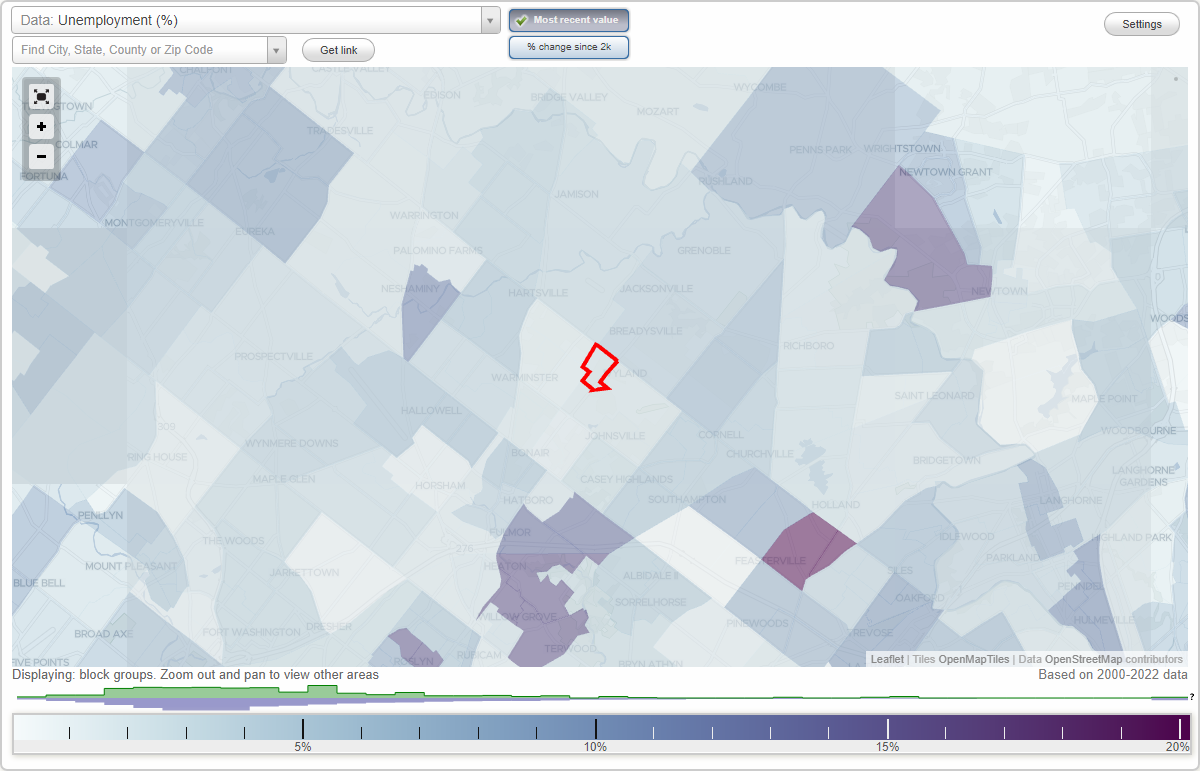
Unemployment (%)
Unemployment (% change since 2000)
Unemployment (%) - White
Unemployment (% change since 2000) - White
Unemployment (%) - Black or African American
Unemployment (% change since 2000) - Black or African American
Unemployment (%) - Asian
Unemployment (% change since 2000) - Asian
Unemployment (%) - Hispanic or Latino
Unemployment (% change since 2000) - Hispanic or Latino
Unemployment (%) - American Indian and Alaska Native
Unemployment (% change since 2000) - American Indian and Alaska Native
Unemployment (%) - Multirace
Unemployment (% change since 2000) - Multirace
Unemployment (%) - Other Race
Unemployment (% change since 2000) - Other Race
Industry diversity
Most Common Industries - Agriculture, forestry, fishing and hunting, and mining (%)
Most Common Industries - Agriculture, forestry, fishing and hunting (%)
Most Common Industries - Mining, quarrying, and oil and gas extraction (%)
Most Common Industries - Construction (%)
Most Common Industries - Manufacturing (%)
Most Common Industries - Wholesale trade (%)
Most Common Industries - Retail trade (%)
Most Common Industries - Transportation and warehousing, and utilities (%)
Most Common Industries - Transportation and warehousing (%)
Most Common Industries - Utilities (%)
Most Common Industries - Information (%)
Most Common Industries - Finance and insurance, and real estate and rental and leasing (%)
Most Common Industries - Finance and insurance (%)
Most Common Industries - Real estate and rental and leasing (%)
Most Common Industries - Professional, scientific, and management, and administrative and waste management services (%)
Most Common Industries - Professional, scientific, and technical services (%)
Most Common Industries - Management of companies and enterprises (%)
Most Common Industries - Administrative and support and waste management services (%)
Most Common Industries - Educational services, and health care and social assistance (%)
Most Common Industries - Educational services (%)
Most Common Industries - Health care and social assistance (%)
Most Common Industries - Arts, entertainment, and recreation, and accommodation and food services (%)
Most Common Industries - Arts, entertainment, and recreation (%)
Most Common Industries - Accommodation and food services (%)
Most Common Industries - Other services, except public administration (%)
Most Common Industries - Public administration (%)
Occupation diversity
Most Common Occupations - Management, business, science, and arts occupations (%)
Most Common Occupations - Management, business, and financial occupations (%)
Most Common Occupations - Management occupations (%)
Most Common Occupations - Business and financial operations occupations (%)
Most Common Occupations - Computer, engineering, and science occupations (%)
Most Common Occupations - Computer and mathematical occupations (%)
Most Common Occupations - Architecture and engineering occupations (%)
Most Common Occupations - Life, physical, and social science occupations (%)
Most Common Occupations - Education, legal, community service, arts, and media occupations (%)
Most Common Occupations - Community and social service occupations (%)
Most Common Occupations - Legal occupations (%)
Most Common Occupations - Education, training, and library occupations (%)
Most Common Occupations - Arts, design, entertainment, sports, and media occupations (%)
Most Common Occupations - Healthcare practitioners and technical occupations (%)
Most Common Occupations - Health diagnosing and treating practitioners and other technical occupations (%)
Most Common Occupations - Health technologists and technicians (%)
Most Common Occupations - Service occupations (%)
Most Common Occupations - Healthcare support occupations (%)
Most Common Occupations - Protective service occupations (%)
Most Common Occupations - Fire fighting and prevention, and other protective service workers including supervisors (%)
Most Common Occupations - Law enforcement workers including supervisors (%)
Most Common Occupations - Food preparation and serving related occupations (%)
Most Common Occupations - Building and grounds cleaning and maintenance occupations (%)
Most Common Occupations - Personal care and service occupations (%)
Most Common Occupations - Sales and office occupations (%)
Most Common Occupations - Sales and related occupations (%)
Most Common Occupations - Office and administrative support occupations (%)
Most Common Occupations - Natural resources, construction, and maintenance occupations (%)
Most Common Occupations - Farming, fishing, and forestry occupations (%)
Most Common Occupations - Construction and extraction occupations (%)
Most Common Occupations - Installation, maintenance, and repair occupations (%)
Most Common Occupations - Production, transportation, and material moving occupations (%)
Most Common Occupations - Production occupations (%)
Most Common Occupations - Transportation occupations (%)
Most Common Occupations - Material moving occupations (%)
Private vehicle occupancy - Drove alone (% change since 2000)
Private vehicle occupancy - Carpooled (%)
Private vehicle occupancy - Carpooled (% change since 2000)
Private vehicle occupancy - In 2-person carpool (%)
Private vehicle occupancy - In 2-person carpool (% change since 2000)
Private vehicle occupancy - In 3-person carpool (%)
Private vehicle occupancy - In 3-person carpool (% change since 2000)
Private vehicle occupancy - In 4-person carpool (%)
Private vehicle occupancy - In 4-person carpool (% change since 2000)
Private vehicle occupancy - In 5- or 6-person carpool (%)
Private vehicle occupancy - In 5- or 6-person carpool (% change since 2000)
Private vehicle occupancy - In 7-or-more-person carpool (%)
Private vehicle occupancy - In 7-or-more-person carpool (% change since 2000)
Time Leaving Home To Go To Work - 12:00 a.m. to 4:59 a.m. (%)
Time Leaving Home To Go To Work - 12:00 a.m. to 4:59 a.m. (% change since 2000)
Time Leaving Home To Go To Work - 5:00 a.m. to 5:59 a.m. (%)
Time Leaving Home To Go To Work - 5:00 a.m. to 5:59 a.m. (% change since 2000)
Time Leaving Home To Go To Work - 6:00 a.m. to 6:59 a.m. (%)
Time Leaving Home To Go To Work - 6:00 a.m. to 6:59 a.m. (% change since 2000)
Time Leaving Home To Go To Work - 7:00 a.m. to 7:59 a.m. (%)
Time Leaving Home To Go To Work - 7:00 a.m. to 7:59 a.m. (% change since 2000)
Time Leaving Home To Go To Work - 8:00 a.m. to 8:59 a.m. (%)
Time Leaving Home To Go To Work - 8:00 a.m. to 8:59 a.m. (% change since 2000)
Time Leaving Home To Go To Work - 9:00 a.m. to 9:59 a.m. (%)
Time Leaving Home To Go To Work - 9:00 a.m. to 9:59 a.m. (% change since 2000)
Time Leaving Home To Go To Work - 10:00 a.m. to 10:59 a.m. (%)
Time Leaving Home To Go To Work - 10:00 a.m. to 10:59 a.m. (% change since 2000)
Time Leaving Home To Go To Work - 11:00 a.m. to 11:59 a.m. (%)
Time Leaving Home To Go To Work - 11:00 a.m. to 11:59 a.m. (% change since 2000)
Time Leaving Home To Go To Work - 12:00 p.m. to 3:59 p.m. (%)
Time Leaving Home To Go To Work - 12:00 p.m. to 3:59 p.m. (% change since 2000)
Time Leaving Home To Go To Work - 4:00 p.m. to 11:59 p.m. (%)
Time Leaving Home To Go To Work - 4:00 p.m. to 11:59 p.m. (% change since 2000)
Class of Workers - Employee of private company (%)
Class of Workers - Employee of private company (% change since 2000)
Class of Workers - Self-employed in own incorporated business (%)
Class of Workers - Self-employed in own incorporated business (% change since 2000)
Class of Workers - Private not-for-profit wage and salary workers (%)
Class of Workers - Private not-for-profit wage and salary workers (% change since 2000)
Class of Workers - Local government workers (%)
Class of Workers - Local government workers (% change since 2000)
Class of Workers - State government workers (%)
Class of Workers - State government workers (% change since 2000)
Class of Workers - Federal government workers (%)
Class of Workers - Federal government workers (% change since 2000)
Class of Workers - Self-employed workers in own not incorporated business and Unpaid family workers (%)
Class of Workers - Self-employed workers in own not incorporated business and Unpaid family workers (% change since 2000)
Means of transportation to work - Drove car alone (%)
Means of transportation to work - Drove car alone (% change since 2000)
Means of transportation to work - Carpooled (%)
Means of transportation to work - Carpooled (% change since 2000)
Means of transportation to work - Public transportation (%)
Means of transportation to work - Public transportation (% change since 2000)
Means of transportation to work - Bus or trolley bus (%)
Means of transportation to work - Bus or trolley bus (% change since 2000)
Means of transportation to work - Streetcar or trolley car (%)
Means of transportation to work - Streetcar or trolley car (% change since 2000)
Means of transportation to work - Subway or elevated (%)
Means of transportation to work - Subway or elevated (% change since 2000)
Means of transportation to work - Railroad (%)
Means of transportation to work - Railroad (% change since 2000)
Means of transportation to work - Ferryboat (%)
Means of transportation to work - Ferryboat (% change since 2000)
Means of transportation to work - Taxicab (%)
Means of transportation to work - Taxicab (% change since 2000)
Means of transportation to work - Motorcycle (%)
Means of transportation to work - Motorcycle (% change since 2000)
Means of transportation to work - Bicycle (%)
Means of transportation to work - Bicycle (% change since 2000)
Means of transportation to work - Walked (%)
Means of transportation to work - Walked (% change since 2000)
Means of transportation to work - Other means (%)
Means of transportation to work - Other means (% change since 2000)
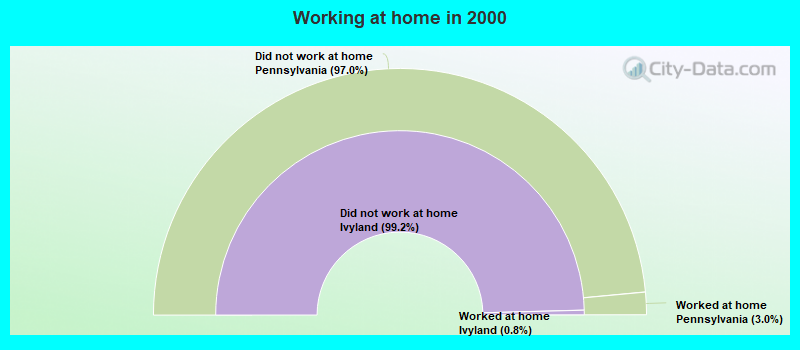
Working at home (%)
Working at home (% change since 2000)
Travel time to work - Less than 5 minutes (%)
Travel time to work - Less than 5 minutes (% change since 2000)
Travel time to work - 5 to 9 minutes (%)
Travel time to work - 5 to 9 minutes (% change since 2000)
Travel time to work - 10 to 19 minutes (%)
Travel time to work - 10 to 19 minutes (% change since 2000)
Travel time to work - 20 to 29 minutes (%)
Travel time to work - 20 to 29 minutes (% change since 2000)
Travel time to work - 30 to 39 minutes (%)
Travel time to work - 30 to 39 minutes (% change since 2000)
Travel time to work - 40 to 59 minutes (%)
Travel time to work - 40 to 59 minutes (% change since 2000)
Travel time to work - 60 to 89 minutes (%)
Travel time to work - 60 to 89 minutes (% change since 2000)
Travel time to work - 90 or more minutes (%)
Travel time to work - 90 or more minutes (% change since 2000)
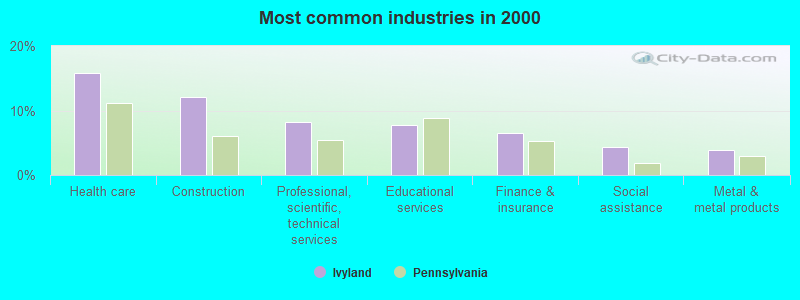
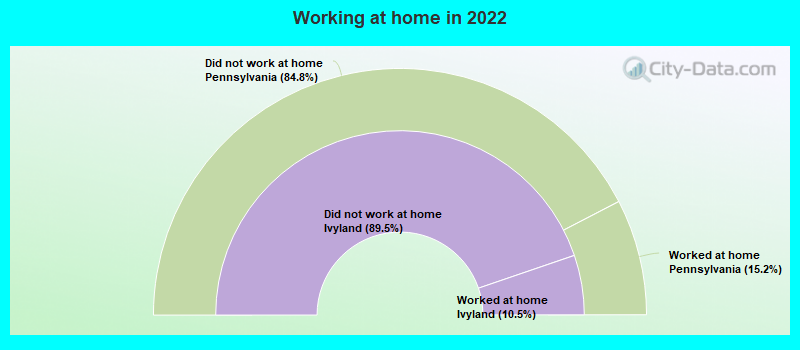
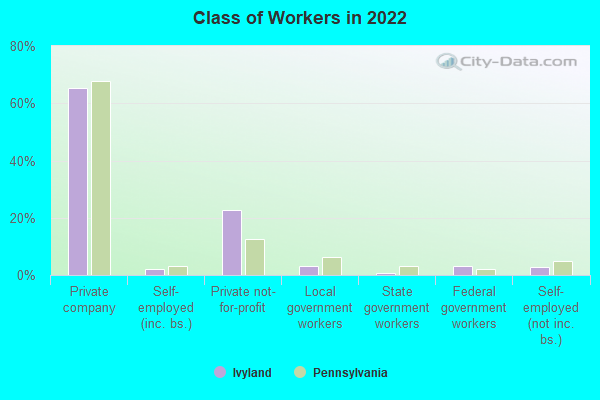
The most common industries in Ivyland are: Health care (15.9% of civilian employees), Construction (12.0% of civilian employees), Professional, scientific, technical services (8.2% of civilian employees). 54.3% of workers work in Bucks County and 8.0% of all workers work at home. 65.5% of workers are employees of private companies, which is 3.4% less than the rate of 67.7% across the entire state of Pennsylvania.
Whole page based on the data from 2000 / 2022 when the population of Ivyland, Pennsylvania was 492 / 1,100
Most common industries
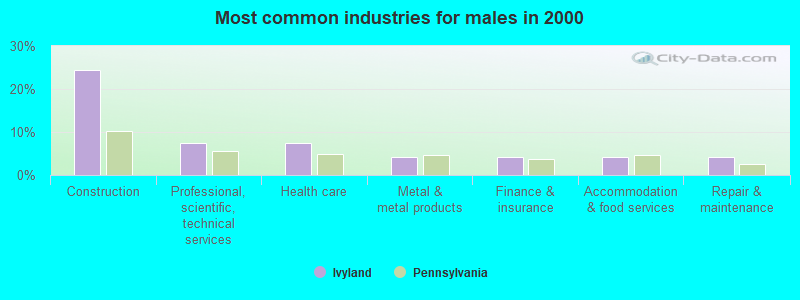
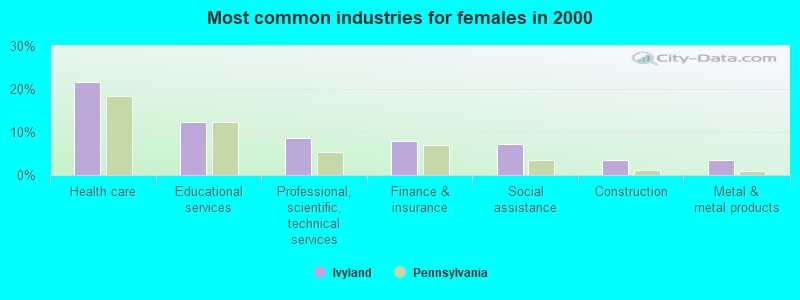
Most common industries Industry All Males Females
Health care 15.9% 7.4% 21.6% Construction 12.0% 24.5% 3.6% Professional, scientific, and technical services 8.2% 7.4% 8.6% Educational services 7.7% 1.1% 12.2% Finance and insurance 6.4% 4.3% 7.9% Social assistance 4.3% 0.0% 7.2% Metal and metal products 3.9% 4.3% 3.6% Personal and laundry services 3.4% 4.3% 2.9% Department and other general merchandise stores 3.0% 2.1% 3.6% Computer and electronic products 2.6% 2.1% 2.9% Accommodation and food services 2.6% 4.3% 1.4% Public administration 2.6% 2.1% 2.9% Food and beverage stores 2.1% 3.2% 1.4% Furniture and home furnishings, and household appliance stores 2.1% 3.2% 1.4% Broadcasting and telecommunications 2.1% 1.1% 2.9% Miscellaneous manufacturing 1.7% 2.1% 1.4% U. S. Postal service 1.7% 2.1% 1.4% Repair and maintenance 1.7% 4.3% 0.0% Machinery 1.7% 2.1% 1.4% Lumber and other construction materials merchant wholesalers 1.3% 3.2% 0.0% Administrative and support and waste management services 1.3% 0.0% 2.2% Furniture and related product manufacturing 0.9% 2.1% 0.0% Utilities 0.9% 2.1% 0.0% Plastics and rubber products 0.9% 2.1% 0.0% Data processing, libraries, and other information services 0.9% 0.0% 1.4% Chemicals 0.9% 0.0% 1.4% Machinery, equipment, and supplies merchant wholesalers 0.9% 0.0% 1.4% Printing and related support activities 0.9% 2.1% 0.0% Alcoholic beverages merchant wholesalers 0.9% 2.1% 0.0% Professional and commercial equipment and supplies merchant wholesalers 0.9% 0.0% 1.4% Electrical equipment, appliances, and components 0.9% 2.1% 0.0% Miscellaneous nondurable goods merchant wholesalers 0.4% 0.0% 0.7% Motor vehicle and parts dealers 0.4% 1.1% 0.0% Pharmacies and drug stores 0.4% 0.0% 0.7% Recyclable material merchant wholesalers 0.4% 1.1% 0.0% Arts, entertainment, and recreation 0.4% 0.0% 0.7% Textile mills and textile products 0.4% 0.0% 0.7% Transportation equipment 0.4% 0.0% 0.7%
Unemployment in Ivyland Unemployment by race in 2022
Unemployment rate for White non-Hispanic residents 6.2% MalesUnemployment rate for two or more race residents 69.4% MalesUnemployment by race in 2000
Unemployment rate for White non-Hispanic residents 7.3% Males4.6% Females
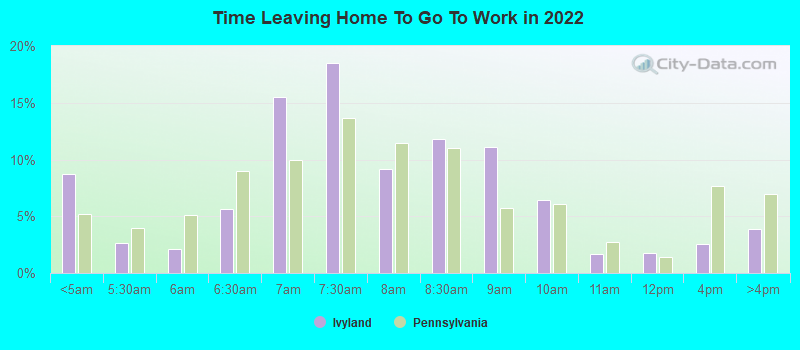
Time leaving home to go to work 12:00 a.m. to 4:59 a.m.: Ivyland:
8.7% (46)Pennsylvania:
5.2% (278,903)
5:00 a.m. to 5:29 a.m.: Ivyland:
2.7% (14)Pennsylvania:
3.9% (210,362)
5:30 a.m. to 5:59 a.m.: Ivyland:
2.1% (11)Pennsylvania:
5.1% (274,242)
6:00 a.m. to 6:29 a.m.: Ivyland:
5.6% (29)Pennsylvania:
9.0% (480,402)
6:30 a.m. to 6:59 a.m.: Ivyland:
15.5% (82)Pennsylvania:
10.0% (532,059)
7:00 a.m. to 7:29 a.m.: Ivyland:
18.5% (97)Pennsylvania:
13.6% (726,980)
7:30 a.m. to 7:59 a.m.: Ivyland:
9.1% (48)Pennsylvania:
11.5% (611,627)
8:00 a.m. to 8:29 a.m.: Ivyland:
11.8% (62)Pennsylvania:
11.0% (585,665)
8:30 a.m. to 8:59 a.m.: Ivyland:
11.1% (58)Pennsylvania:
5.7% (302,857)
9:00 a.m. to 9:59 a.m.: Ivyland:
6.4% (34)Pennsylvania:
6.1% (324,576)
10:00 a.m. to 10:59 a.m.: Ivyland:
1.7% (9)Pennsylvania:
2.7% (146,376)
11:00 a.m. to 11:59 a.m.: Ivyland:
1.8% (9)Pennsylvania:
1.4% (75,840)
12:00 p.m. to 3:59 p.m.: Ivyland:
2.6% (14)Pennsylvania:
7.6% (407,255)
4:00 p.m. to 11:59 p.m.: Ivyland:
3.8% (20)Pennsylvania:
6.9% (369,524)
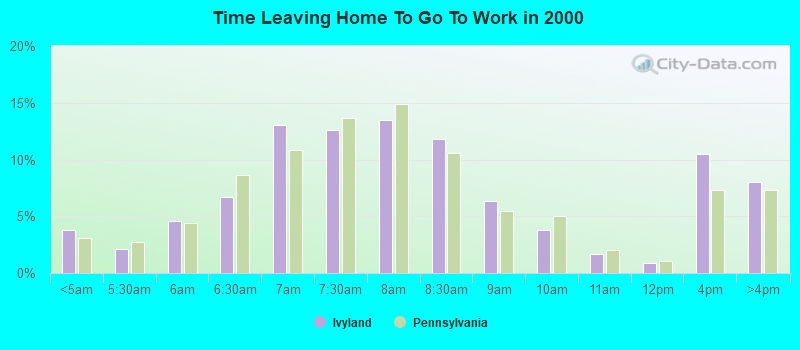
<5am: Ivyland:
3.8% (9)Pennsylvania:
3.1% (172,304)
5:30am: Ivyland:
2.1% (5)Pennsylvania:
2.7% (150,168)
6am: Ivyland:
4.6% (11)Pennsylvania:
4.4% (245,004)
6:30am: Ivyland:
6.7% (16)Pennsylvania:
8.6% (478,636)
7am: Ivyland:
13.0% (31)Pennsylvania:
10.8% (599,808)
7:30am: Ivyland:
12.6% (30)Pennsylvania:
13.7% (759,372)
8am: Ivyland:
13.4% (32)Pennsylvania:
14.9% (826,968)
8:30am: Ivyland:
11.8% (28)Pennsylvania:
10.6% (588,440)
9am: Ivyland:
6.3% (15)Pennsylvania:
5.5% (304,765)
10am: Ivyland:
3.8% (9)Pennsylvania:
5.1% (280,812)
11am: Ivyland:
1.7% (4)Pennsylvania:
2.1% (114,676)
12pm: Ivyland:
0.8% (2)Pennsylvania:
1.0% (57,867)
4pm: Ivyland:
10.5% (25)Pennsylvania:
7.3% (404,775)
>4pm: Ivyland:
8.0% (19)Pennsylvania:
7.3% (408,070)
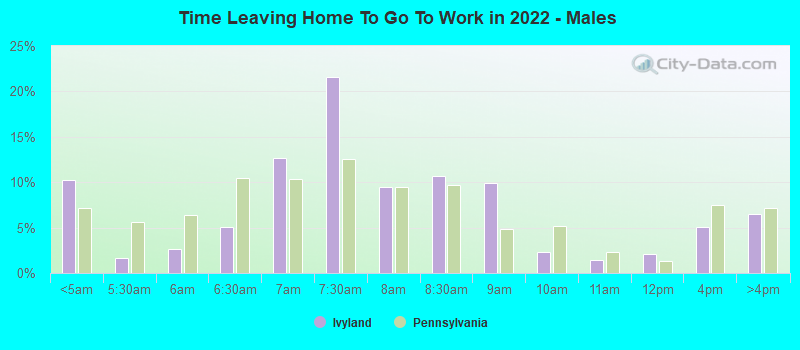
12:00 a.m. to 4:59 a.m. - Males: Ivyland:
10.2% (26)Pennsylvania:
7.2% (203,028)
5:00 a.m. to 5:29 a.m. - Males: Ivyland:
1.7% (4)Pennsylvania:
5.6% (157,829)
5:30 a.m. to 5:59 a.m. - Males: Ivyland:
2.6% (7)Pennsylvania:
6.4% (180,791)
6:00 a.m. to 6:29 a.m. - Males: Ivyland:
5.1% (13)Pennsylvania:
10.5% (296,669)
6:30 a.m. to 6:59 a.m. - Males: Ivyland:
12.7% (32)Pennsylvania:
10.4% (293,727)
7:00 a.m. to 7:29 a.m. - Males: Ivyland:
21.6% (54)Pennsylvania:
12.6% (356,257)
7:30 a.m. to 7:59 a.m. - Males: Ivyland:
9.5% (24)Pennsylvania:
9.5% (268,895)
8:00 a.m. to 8:29 a.m. - Males: Ivyland:
10.6% (27)Pennsylvania:
9.7% (274,966)
8:30 a.m. to 8:59 a.m. - Males: Ivyland:
10.0% (25)Pennsylvania:
4.9% (137,370)
9:00 a.m. to 9:59 a.m. - Males: Ivyland:
2.3% (6)Pennsylvania:
5.1% (145,545)
10:00 a.m. to 10:59 a.m. - Males: Ivyland:
1.5% (4)Pennsylvania:
2.3% (66,088)
11:00 a.m. to 11:59 a.m. - Males: Ivyland:
2.0% (5)Pennsylvania:
1.3% (36,091)
12:00 p.m. to 3:59 p.m. - Males: Ivyland:
5.1% (13)Pennsylvania:
7.4% (210,601)
4:00 p.m. to 11:59 p.m. - Males: Ivyland:
6.5% (16)Pennsylvania:
7.1% (202,203)
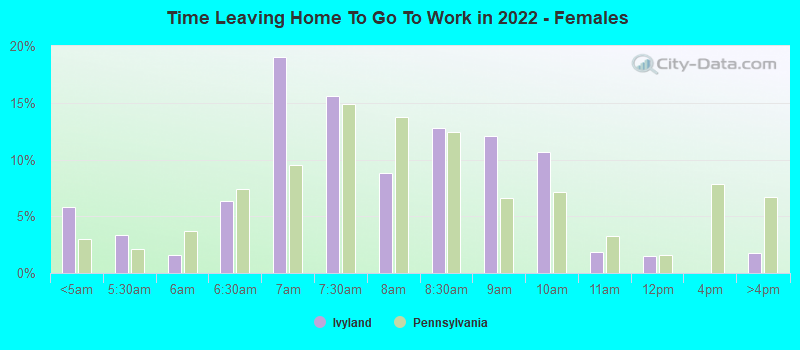
12:00 a.m. to 4:59 a.m. - Females: Ivyland:
5.8% (16)Pennsylvania:
3.0% (75,875)
5:00 a.m. to 5:29 a.m. - Females: Ivyland:
3.3% (9)Pennsylvania:
2.1% (52,533)
5:30 a.m. to 5:59 a.m. - Females: Ivyland:
1.6% (4)Pennsylvania:
3.7% (93,451)
6:00 a.m. to 6:29 a.m. - Females: Ivyland:
6.4% (17)Pennsylvania:
7.4% (183,733)
6:30 a.m. to 6:59 a.m. - Females: Ivyland:
19.0% (52)Pennsylvania:
9.5% (238,332)
7:00 a.m. to 7:29 a.m. - Females: Ivyland:
15.6% (43)Pennsylvania:
14.8% (370,723)
7:30 a.m. to 7:59 a.m. - Females: Ivyland:
8.8% (24)Pennsylvania:
13.7% (342,732)
8:00 a.m. to 8:29 a.m. - Females: Ivyland:
12.7% (35)Pennsylvania:
12.4% (310,699)
8:30 a.m. to 8:59 a.m. - Females: Ivyland:
12.1% (33)Pennsylvania:
6.6% (165,487)
9:00 a.m. to 9:59 a.m. - Females: Ivyland:
10.6% (29)Pennsylvania:
7.2% (179,031)
10:00 a.m. to 10:59 a.m. - Females: Ivyland:
1.8% (5)Pennsylvania:
3.2% (80,288)
11:00 a.m. to 11:59 a.m. - Females: Ivyland:
1.5% (4)Pennsylvania:
1.6% (39,749)
4:00 p.m. to 11:59 p.m. - Females: Ivyland:
1.8% (5)Pennsylvania:
6.7% (167,321)
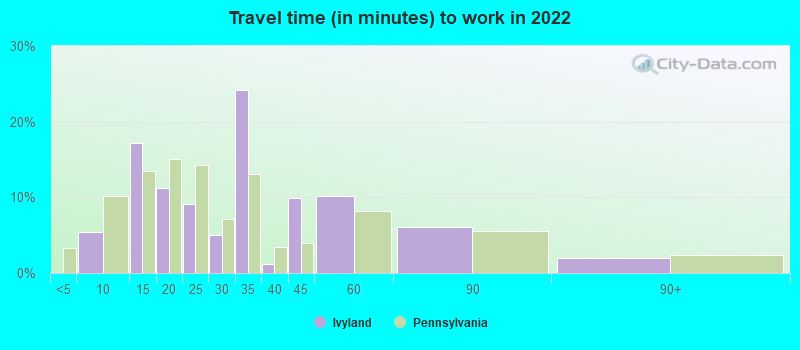
Travel time to work Percentage of workers working in this county: 54.3%Number of people working at home: 48 (8.0% of all workers )
5 to 9 minutes: Ivyland:
5.4% (58)Pennsylvania:
10.2% (536,363)
10 to 14 minutes: Ivyland:
17.2% (185)Pennsylvania:
13.4% (709,149)
15 to 19 minutes: Ivyland:
11.2% (121)Pennsylvania:
15.1% (795,392)
20 to 24 minutes: Ivyland:
9.1% (98)Pennsylvania:
14.2% (750,120)
25 to 29 minutes: Ivyland:
5.0% (54)Pennsylvania:
7.1% (376,011)
30 to 34 minutes: Ivyland:
24.2% (261)Pennsylvania:
13.1% (689,933)
35 to 39 minutes: Ivyland:
1.2% (13)Pennsylvania:
3.4% (181,099)
40 to 44 minutes: Ivyland:
9.9% (107)Pennsylvania:
4.0% (211,803)
45 to 59 minutes: Ivyland:
10.2% (110)Pennsylvania:
8.1% (429,639)
60 to 89 minutes: Ivyland:
6.0% (65)Pennsylvania:
5.5% (292,390)
90 or more minutes: Ivyland:
2.0% (22)Pennsylvania:
2.4% (127,300)
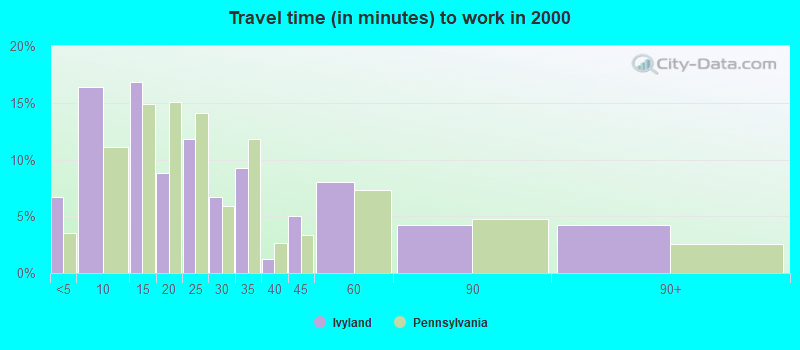
Less than 5 minutes: Ivyland:
6.7% (16)Pennsylvania:
3.5% (196,492)
5 to 9 minutes: Ivyland:
16.4% (39)Pennsylvania:
11.1% (615,919)
10 to 14 minutes: Ivyland:
16.8% (40)Pennsylvania:
14.9% (825,199)
15 to 19 minutes: Ivyland:
8.8% (21)Pennsylvania:
15.0% (836,006)
20 to 24 minutes: Ivyland:
11.8% (28)Pennsylvania:
14.1% (782,790)
25 to 29 minutes: Ivyland:
6.7% (16)Pennsylvania:
5.9% (327,459)
30 to 34 minutes: Ivyland:
9.2% (22)Pennsylvania:
11.8% (655,811)
35 to 39 minutes: Ivyland:
1.3% (3)Pennsylvania:
2.7% (148,906)
40 to 44 minutes: Ivyland:
5.0% (12)Pennsylvania:
3.4% (187,483)
45 to 59 minutes: Ivyland:
8.0% (19)Pennsylvania:
7.3% (407,516)
60 to 89 minutes: Ivyland:
4.2% (10)Pennsylvania:
4.8% (265,759)
90 or more minutes: Ivyland:
4.2% (10)Pennsylvania:
2.6% (142,325)
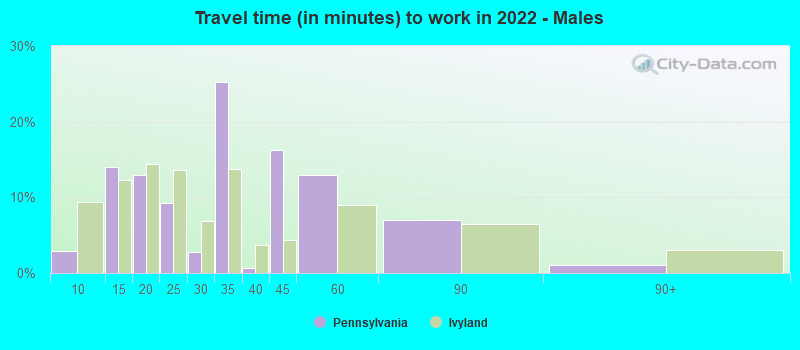
5 to 9 minutes - Males: Ivyland:
2.9% (22)Pennsylvania:
9.4% (263,803)
10 to 14 minutes - Males: Ivyland:
14.1% (107)Pennsylvania:
12.3% (344,337)
15 to 19 minutes - Males: Ivyland:
13.0% (99)Pennsylvania:
14.4% (402,062)
20 to 24 minutes - Males: Ivyland:
9.3% (71)Pennsylvania:
13.6% (380,953)
25 to 29 minutes - Males: Ivyland:
2.7% (21)Pennsylvania:
6.9% (193,555)
30 to 34 minutes - Males: Ivyland:
25.3% (193)Pennsylvania:
13.7% (383,132)
35 to 39 minutes - Males: Ivyland:
0.6% (5)Pennsylvania:
3.6% (102,122)
40 to 44 minutes - Males: Ivyland:
16.2% (124)Pennsylvania:
4.3% (120,376)
45 to 59 minutes - Males: Ivyland:
12.9% (99)Pennsylvania:
9.0% (251,766)
60 to 89 minutes - Males: Ivyland:
7.0% (53)Pennsylvania:
6.5% (183,289)
90 or more minutes - Males: Ivyland:
1.0% (8)Pennsylvania:
3.0% (85,115)
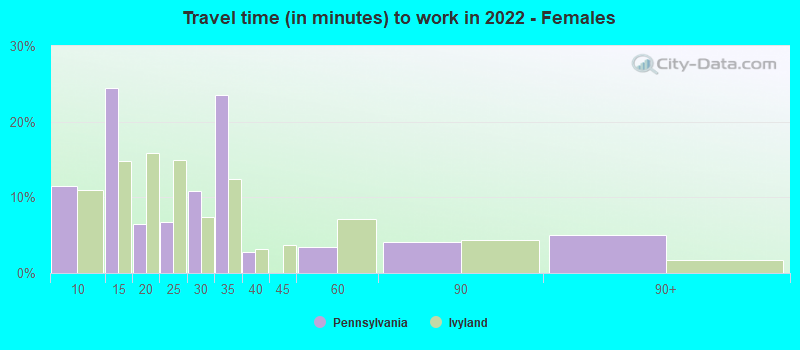
5 to 9 minutes - Females: Ivyland:
11.6% (36)Pennsylvania:
11.0% (272,560)
10 to 14 minutes - Females: Ivyland:
24.5% (76)Pennsylvania:
14.7% (364,812)
15 to 19 minutes - Females: Ivyland:
6.5% (20)Pennsylvania:
15.9% (393,330)
20 to 24 minutes - Females: Ivyland:
6.8% (21)Pennsylvania:
14.9% (369,167)
25 to 29 minutes - Females: Ivyland:
10.8% (34)Pennsylvania:
7.4% (182,456)
30 to 34 minutes - Females: Ivyland:
23.5% (73)Pennsylvania:
12.4% (306,801)
35 to 39 minutes - Females: Ivyland:
2.7% (8)Pennsylvania:
3.2% (78,977)
45 to 59 minutes - Females: Ivyland:
3.4% (11)Pennsylvania:
7.2% (177,873)
60 to 89 minutes - Females: Ivyland:
4.1% (13)Pennsylvania:
4.4% (109,101)
90 or more minutes - Females: Ivyland:
5.0% (16)Pennsylvania:
1.7% (42,185)
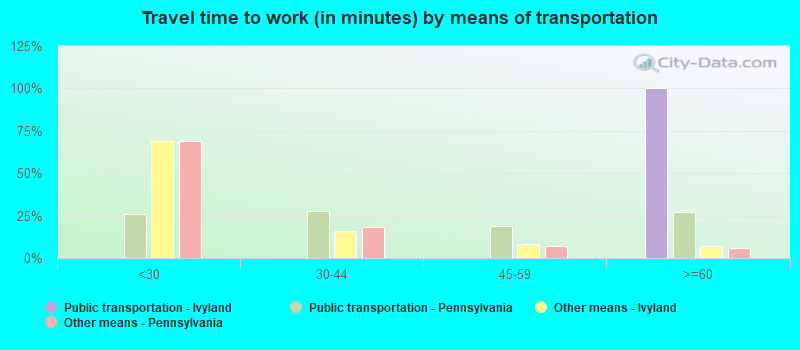
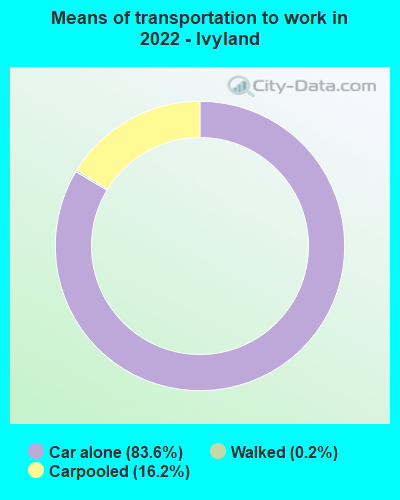
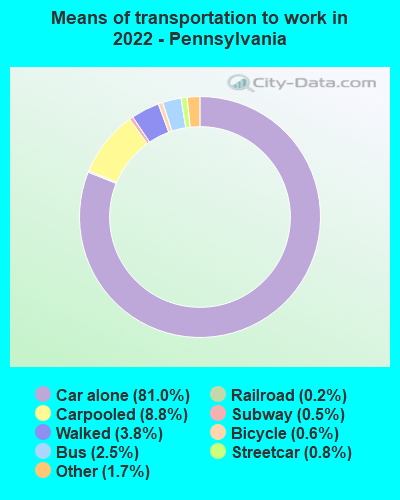
Means of transportation to work Drove car alone: Ivyland:
83.6% (957)Pennsylvania:
81.0% (1,982,533)
Carpooled: Ivyland:
16.2% (185)Pennsylvania:
8.8% (224,687)
Walked: Ivyland:
0.2% (2)Pennsylvania:
3.8% (101,672)
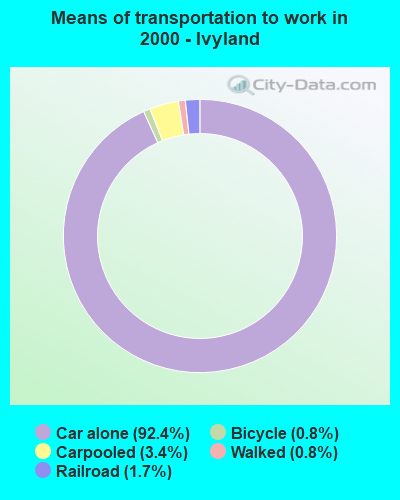
Drove car alone: Ivyland:
92.4% (220)Pennsylvania:
76.5% (4,247,836)
Carpooled: Ivyland:
3.4% (8)Pennsylvania:
10.4% (577,364)
Railroad: Ivyland:
1.7% (4)Pennsylvania:
0.8% (43,455)
Bicycle: Ivyland:
0.8% (2)Pennsylvania:
0.3% (14,001)
Walked: Ivyland:
0.8% (2)Pennsylvania:
4.1% (229,725)
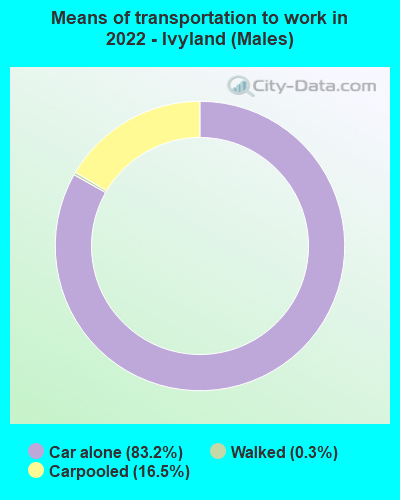
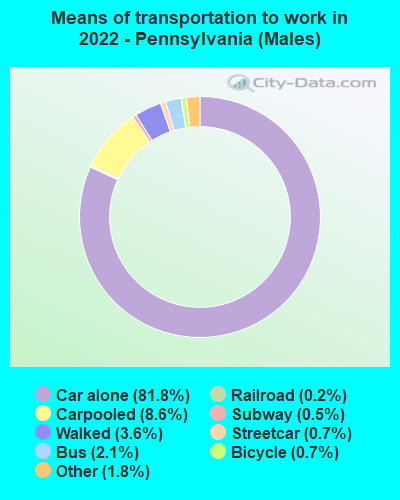
Drove car alone - Males: Ivyland:
83.2% (670)Pennsylvania:
81.8% (1,982,533)
Carpooled - Males: Ivyland:
16.5% (133)Pennsylvania:
8.6% (224,687)
Walked - Males: Ivyland:
0.3% (2)Pennsylvania:
3.6% (101,672)
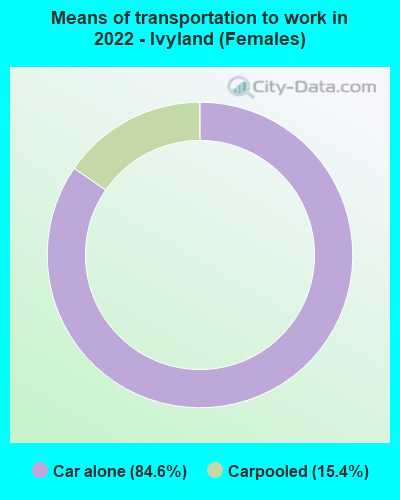
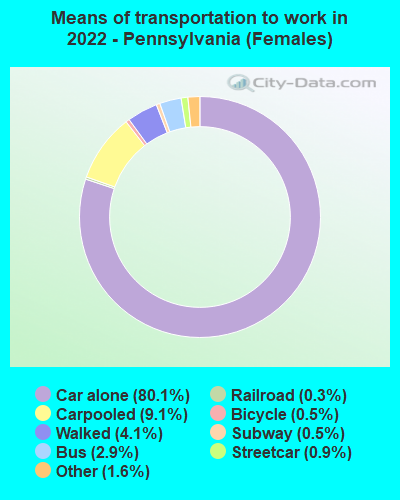
Drove car alone - Females: Ivyland:
84.6% (282)Pennsylvania:
80.1% (1,982,533)
Carpooled - Females: Ivyland:
15.4% (51)Pennsylvania:
9.1% (224,687)
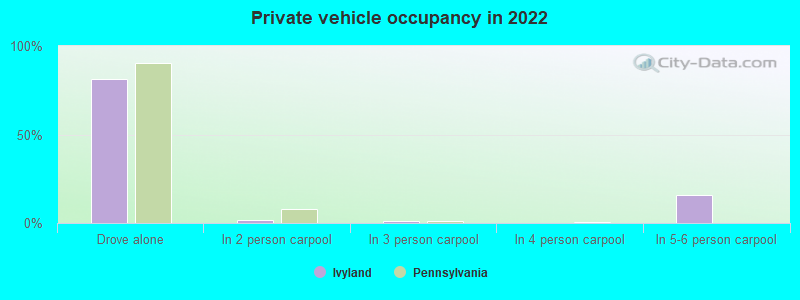
Private vehicle occupancy Drove alone: Ivyland:
81.2% (430)Pennsylvania:
90.2% (4,322,003)
In 2 person carpool: Ivyland:
1.8% (9)Pennsylvania:
7.7% (367,639)
In 3 person carpool: Ivyland:
1.0% (5)Pennsylvania:
1.2% (57,942)
In 5-6 person carpool: Ivyland:
16.1% (85)Pennsylvania:
0.3% (13,205)
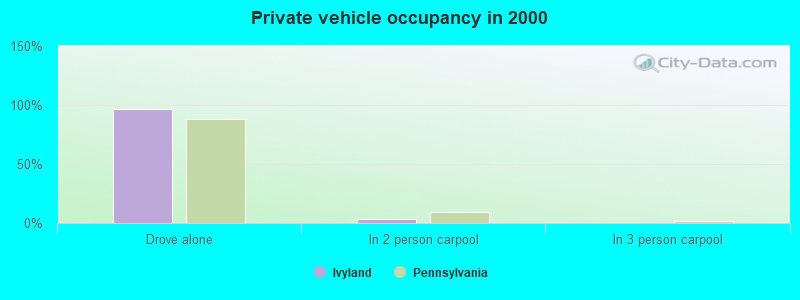
Drove alone: Ivyland:
96.5% (220)Pennsylvania:
88.0% (4,247,836)
In 2 person carpool: Ivyland:
3.5% (8)Pennsylvania:
9.7% (470,174)
Class of workers
Employee of private company: Ivyland:
65.5% (395)Pennsylvania:
67.7% (4,333,849)
Self-employed in own incorporated business: Ivyland:
2.0% (12)Pennsylvania:
3.2% (202,029)
Private not-for-profit wage and salary workers: Ivyland:
22.6% (137)Pennsylvania:
12.7% (810,562)
Local government workers: Ivyland:
3.0% (18)Pennsylvania:
6.2% (397,120)
State government workers: Ivyland:
0.8% (5)Pennsylvania:
3.0% (193,490)
Federal government workers: Ivyland:
3.2% (19)Pennsylvania:
2.1% (136,008)
Self-employed workers in own not incorporated business: Ivyland:
2.8% (17)Pennsylvania:
5.0% (318,118)
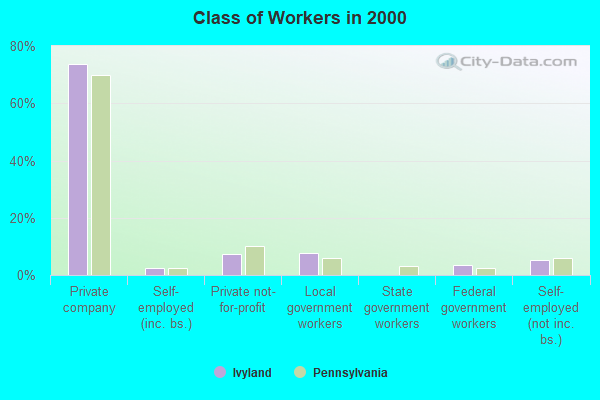
Employee of private company: Ivyland:
73.8% (172)Pennsylvania:
69.7% (3,942,119)
Self-employed in own incorporated business: Ivyland:
2.6% (6)Pennsylvania:
2.4% (134,871)
Private not-for-profit wage and salary workers: Ivyland:
7.3% (17)Pennsylvania:
10.3% (580,382)
Local government workers: Ivyland:
7.7% (18)Pennsylvania:
5.8% (326,222)
Federal government workers: Ivyland:
3.4% (8)Pennsylvania:
2.3% (130,634)
Self-employed workers in own not incorporated business: Ivyland:
5.2% (12)Pennsylvania:
6.0% (339,631)
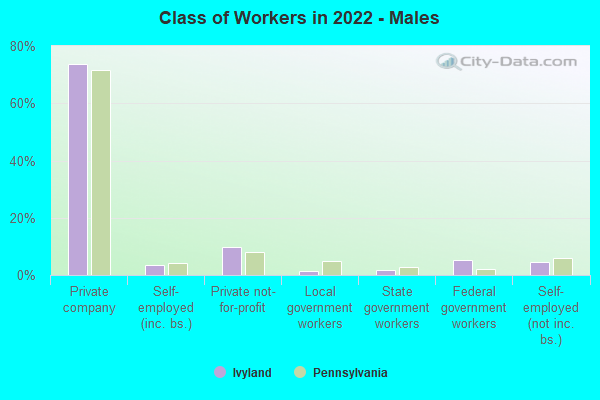
Employee of private company - Males: Ivyland:
73.9% (214)Pennsylvania:
71.5% (2,388,579)
Self-employed in own incorporated business - Males: Ivyland:
3.5% (10)Pennsylvania:
4.0% (134,437)
Private not-for-profit wage and salary workers - Males: Ivyland:
9.8% (28)Pennsylvania:
8.1% (270,498)
Local government workers - Males: Ivyland:
1.4% (4)Pennsylvania:
5.0% (168,310)
State government workers - Males: Ivyland:
1.7% (5)Pennsylvania:
2.9% (97,540)
Federal government workers - Males: Ivyland:
5.2% (15)Pennsylvania:
2.2% (75,158)
Self-employed workers in own not incorporated business - Males: Ivyland:
4.5% (13)Pennsylvania:
6.0% (199,421)
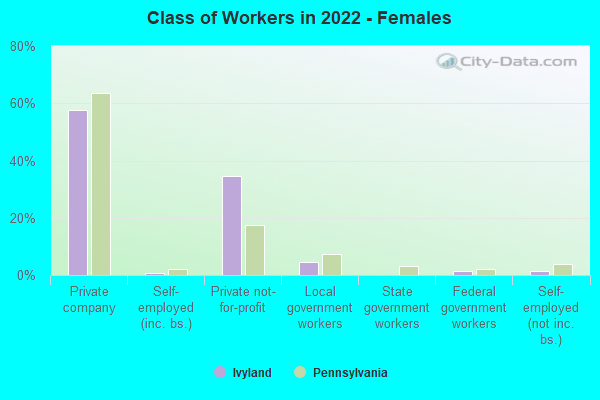
Employee of private company - Females: Ivyland:
57.7% (181)Pennsylvania:
63.5% (1,945,270)
Self-employed in own incorporated business - Females: Ivyland:
0.6% (2)Pennsylvania:
2.2% (67,592)
Private not-for-profit wage and salary workers - Females: Ivyland:
34.5% (108)Pennsylvania:
17.6% (540,064)
Local government workers - Females: Ivyland:
4.5% (14)Pennsylvania:
7.5% (228,810)
Federal government workers - Females: Ivyland:
1.3% (4)Pennsylvania:
2.0% (60,850)
Self-employed workers in own not incorporated business - Females: Ivyland:
1.3% (4)Pennsylvania:
3.9% (118,697)