Work and Jobs in Keno, Oregon (OR) Detailed Stats
Occupations, Industries, Unemployment, Workers, Commute
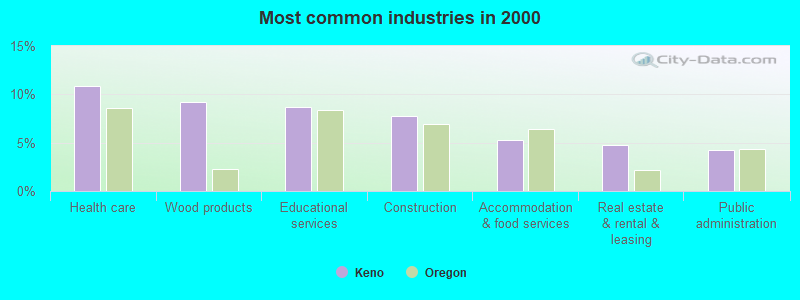
The most common industries in Keno are: Health care (10.8% of civilian employees), Wood products (9.2% of civilian employees), Educational services (8.6% of civilian employees). 59.5% of workers are employees of private companies, which is 9.3% less than the rate of 65.1% across the entire state of Oregon.
Most common industries
Most common industries | |||
|---|---|---|---|
Industry | All | Males | Females |
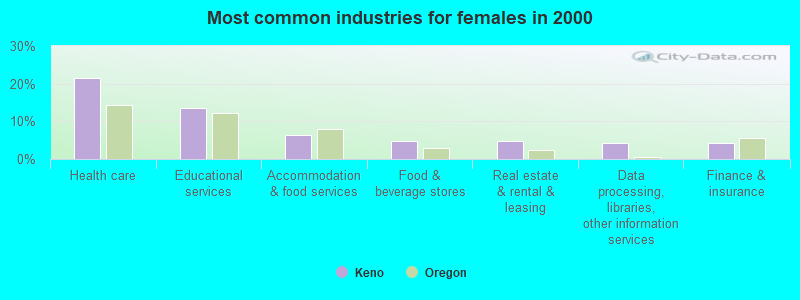
| Health care | 10.8% (154) | 2.1% (16) | 21.4% (138) |
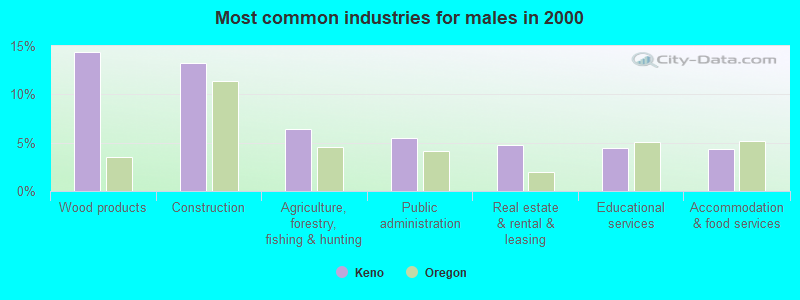
| Wood products | 9.2% (131) | 14.4% (112) | 2.9% (19) |
| Educational services | 8.6% (123) | 4.5% (35) | 13.6% (88) |
| Construction | 7.8% (111) | 13.2% (103) | 1.2% (8) |
| Accommodation and food services | 5.3% (75) | 4.4% (34) | 6.4% (41) |
| Real estate and rental and leasing | 4.8% (68) | 4.8% (37) | 4.8% (31) |
| Public administration | 4.2% (60) | 5.5% (43) | 2.6% (17) |
| Agriculture, forestry, fishing and hunting | 4.1% (59) | 6.4% (50) | 1.4% (9) |
| Finance and insurance | 4.0% (57) | 3.9% (30) | 4.2% (27) |
| Food and beverage stores | 3.2% (45) | 1.8% (14) | 4.8% (31) |
| Professional, scientific, and technical services | 2.8% (40) | 1.9% (15) | 3.9% (25) |
| Department and other general merchandise stores | 2.7% (39) | 2.4% (19) | 3.1% (20) |
| Repair and maintenance | 2.5% (35) | 3.0% (23) | 1.9% (12) |
| Administrative and support and waste management services | 2.5% (35) | 2.7% (21) | 2.2% (14) |
| Data processing, libraries, and other information services | 2.2% (32) | 0.6% (5) | 4.2% (27) |
| Truck transportation | 1.8% (26) | 3.3% (26) | 0.0% (0) |
| Motor vehicle and parts dealers | 1.8% (26) | 2.3% (18) | 1.2% (8) |
| Food | 1.6% (23) | 1.7% (13) | 1.6% (10) |
| Clothing and accessories, including shoe, stores | 1.5% (22) | 1.7% (13) | 1.4% (9) |
| U. S. Postal service | 1.3% (19) | 1.3% (10) | 1.4% (9) |
| Social assistance | 1.3% (18) | 0.0% (0) | 2.8% (18) |
| Utilities | 1.3% (18) | 2.3% (18) | 0.0% (0) |
| Other transportation, and support activities, and couriers | 1.2% (17) | 2.2% (17) | 0.0% (0) |
| Arts, entertainment, and recreation | 1.2% (17) | 0.8% (6) | 1.7% (11) |
| Rail transportation | 1.1% (15) | 1.9% (15) | 0.0% (0) |
| Religious, grantmaking, civic, professional, and similar organizations | 1.0% (14) | 1.0% (8) | 0.9% (6) |
| Gasoline stations | 0.9% (13) | 1.7% (13) | 0.0% (0) |
| Radio, TV, and computer stores | 0.9% (13) | 0.0% (0) | 2.0% (13) |
| Sewing, needlework, and piece goods stores | 0.7% (10) | 0.0% (0) | 1.6% (10) |
| Other direct selling establishments | 0.6% (8) | 0.0% (0) | 1.2% (8) |
| Groceries and related products merchant wholesalers | 0.6% (8) | 0.4% (3) | 0.8% (5) |
| Petroleum and petroleum products merchant wholesalers | 0.6% (8) | 1.0% (8) | 0.0% (0) |
| Transportation equipment | 0.5% (7) | 0.9% (7) | 0.0% (0) |
| Miscellaneous nondurable goods merchant wholesalers | 0.5% (7) | 0.9% (7) | 0.0% (0) |
| Machinery, equipment, and supplies merchant wholesalers | 0.5% (7) | 0.9% (7) | 0.0% (0) |
| Private households | 0.5% (7) | 0.0% (0) | 1.1% (7) |
| Retail florists | 0.4% (6) | 0.0% (0) | 0.9% (6) |
| Used merchandise, gift, novelty, and souvenir, and other miscellaneous stores | 0.4% (6) | 0.8% (6) | 0.0% (0) |
| Broadcasting and telecommunications | 0.4% (6) | 0.0% (0) | 0.9% (6) |
| Computer and electronic products | 0.4% (6) | 0.8% (6) | 0.0% (0) |
| Furniture and home furnishings, and household appliance stores | 0.4% (6) | 0.0% (0) | 0.9% (6) |
| Miscellaneous manufacturing | 0.4% (6) | 0.0% (0) | 0.9% (6) |
| Beverage and tobacco products | 0.4% (6) | 0.8% (6) | 0.0% (0) |
| Personal and laundry services | 0.4% (6) | 0.8% (6) | 0.0% (0) |
| Metal and metal products | 0.3% (4) | 0.5% (4) | 0.0% (0) |
| Nonmetallic mineral products | 0.3% (4) | 0.5% (4) | 0.0% (0) |
Unemployment in Keno
- Unemployment by race in 2000
- Unemployment rate for White non-Hispanic residents
- 8.6%Males
- 2.9%Females
- Unemployment rate for two or more race residents
- 25.7%Males
- Unemployment rate for Hispanic or Latino residents
- 40.0%Males
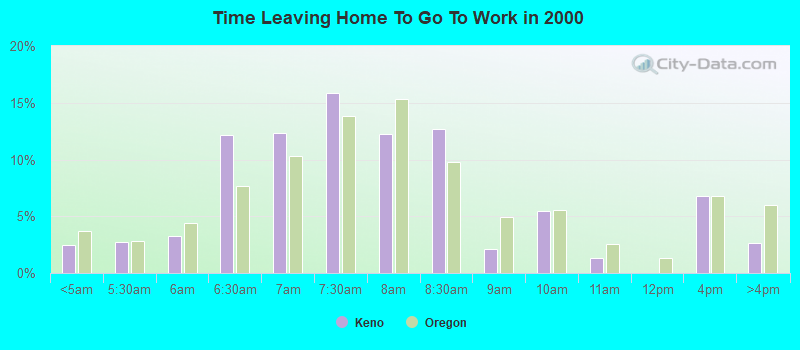
Time leaving home to go to work
<5am:
| Keno: | 2.4% (34) |
| Oregon: | 3.7% (58,821) |
5:30am:
| Keno: | 2.7% (38) |
| Oregon: | 2.8% (44,872) |
6am:
| Keno: | 3.3% (46) |
| Oregon: | 4.4% (71,163) |
6:30am:
| Keno: | 12.2% (170) |
| Oregon: | 7.7% (122,707) |
7am:
| Keno: | 12.3% (172) |
| Oregon: | 10.3% (165,185) |
7:30am:
| Keno: | 15.9% (222) |
| Oregon: | 13.9% (222,209) |
8am:
| Keno: | 12.2% (171) |
| Oregon: | 15.3% (245,415) |
8:30am:
| Keno: | 12.7% (178) |
| Oregon: | 9.8% (156,781) |
9am:
| Keno: | 2.1% (30) |
| Oregon: | 4.9% (78,436) |
10am:
| Keno: | 5.5% (77) |
| Oregon: | 5.5% (88,783) |
11am:
| Keno: | 1.4% (19) |
| Oregon: | 2.6% (41,539) |
4pm:
| Keno: | 6.8% (95) |
| Oregon: | 6.8% (108,927) |
>4pm:
| Keno: | 2.6% (37) |
| Oregon: | 6.0% (95,989) |
Travel time to work
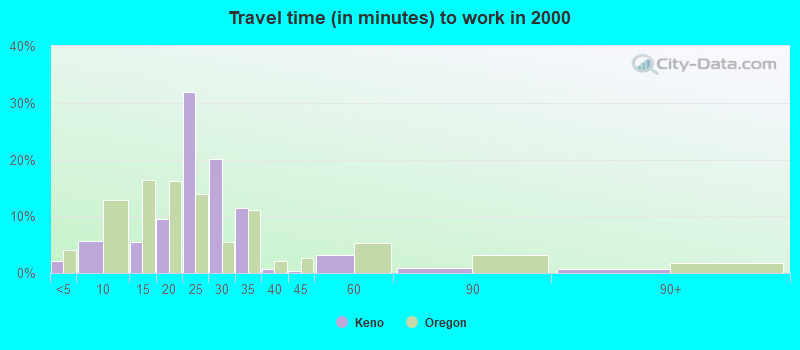
Less than 5 minutes:
| Keno: | 2.1% (30) |
| Oregon: | 4.1% (66,369) |
5 to 9 minutes:
| Keno: | 5.6% (78) |
| Oregon: | 12.9% (206,168) |
10 to 14 minutes:
| Keno: | 5.5% (77) |
| Oregon: | 16.5% (263,466) |
15 to 19 minutes:
| Keno: | 9.6% (134) |
| Oregon: | 16.1% (258,476) |
20 to 24 minutes:
| Keno: | 31.8% (445) |
| Oregon: | 13.9% (223,370) |
25 to 29 minutes:
| Keno: | 20.0% (280) |
| Oregon: | 5.4% (87,147) |
30 to 34 minutes:
| Keno: | 11.4% (160) |
| Oregon: | 11.0% (176,763) |
35 to 39 minutes:
| Keno: | 0.7% (10) |
| Oregon: | 2.0% (32,680) |
40 to 44 minutes:
| Keno: | 0.4% (6) |
| Oregon: | 2.7% (43,262) |
45 to 59 minutes:
| Keno: | 3.2% (45) |
| Oregon: | 5.2% (83,858) |
60 to 89 minutes:
| Keno: | 0.9% (13) |
| Oregon: | 3.2% (51,318) |
90 or more minutes:
| Keno: | 0.8% (11) |
| Oregon: | 1.8% (28,715) |
Means of transportation to work
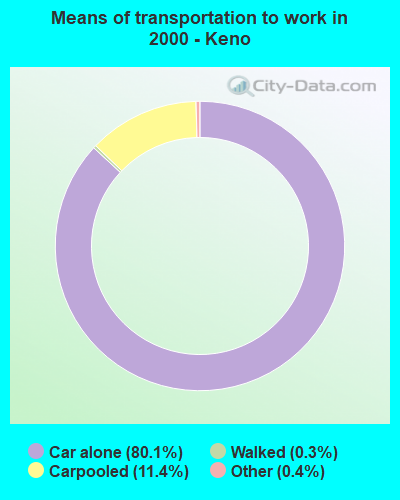

Drove car alone:
| Keno: | 80.1% (1,121) |
| Oregon: | 73.2% (1,171,641) |
Carpooled:
| Keno: | 11.4% (159) |
| Oregon: | 12.2% (195,950) |
Walked:
| Keno: | 0.3% (4) |
| Oregon: | 3.6% (57,217) |
Other means:
| Keno: | 0.4% (5) |
| Oregon: | 0.7% (10,882) |
Private vehicle occupancy
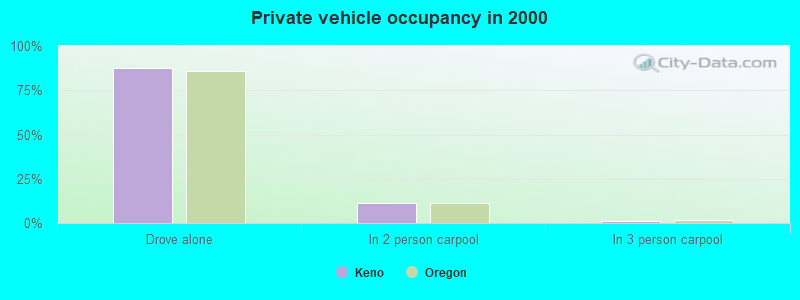
Drove alone:
| Keno: | 87.6% (1,121) |
| Oregon: | 85.7% (1,171,641) |
In 2 person carpool:
| Keno: | 11.1% (142) |
| Oregon: | 11.5% (156,754) |
In 3 person carpool:
| Keno: | 1.2% (15) |
| Oregon: | 1.9% (25,457) |
In 4 person carpool:
| Keno: | 0.2% (2) |
| Oregon: | 0.6% (8,345) |
Class of workers
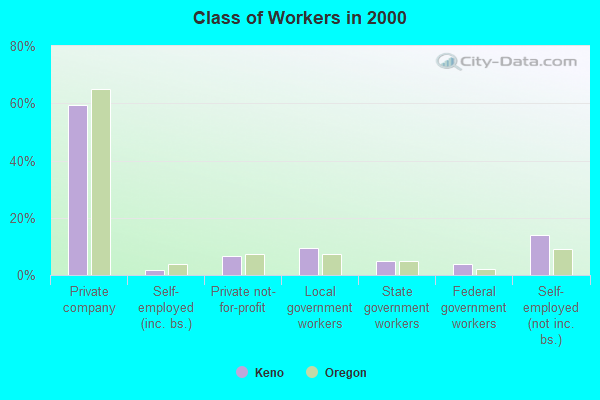
Employee of private company:
| Keno: | 59.5% (847) |
| Oregon: | 65.1% (1,059,139) |
Self-employed in own incorporated business:
| Keno: | 1.8% (25) |
| Oregon: | 3.8% (61,386) |
Private not-for-profit wage and salary workers:
| Keno: | 6.7% (95) |
| Oregon: | 7.4% (120,839) |
Local government workers:
| Keno: | 9.5% (135) |
| Oregon: | 7.2% (116,733) |
State government workers:
| Keno: | 4.9% (70) |
| Oregon: | 5.0% (81,804) |
Federal government workers:
| Keno: | 3.8% (54) |
| Oregon: | 2.2% (36,076) |
Self-employed workers in own not incorporated business:
| Keno: | 13.8% (197) |
| Oregon: | 8.9% (145,020) |
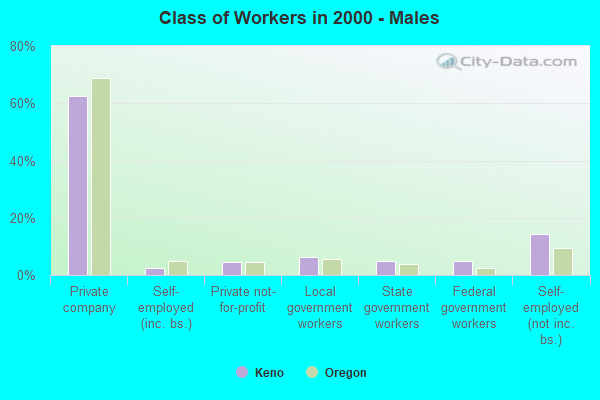
Employee of private company - Males:
| Keno: | 62.5% (486) |
| Oregon: | 68.9% (605,246) |
Self-employed in own incorporated business - Males:
| Keno: | 2.3% (18) |
| Oregon: | 5.0% (44,188) |
Private not-for-profit wage and salary workers - Males:
| Keno: | 4.6% (36) |
| Oregon: | 4.5% (39,938) |
Local government workers - Males:
| Keno: | 6.4% (50) |
| Oregon: | 5.6% (49,371) |
State government workers - Males:
| Keno: | 4.9% (38) |
| Oregon: | 3.9% (33,917) |
Federal government workers - Males:
| Keno: | 4.9% (38) |
| Oregon: | 2.3% (20,185) |
Self-employed workers in own not incorporated business - Males:
| Keno: | 14.4% (112) |
| Oregon: | 9.4% (82,902) |
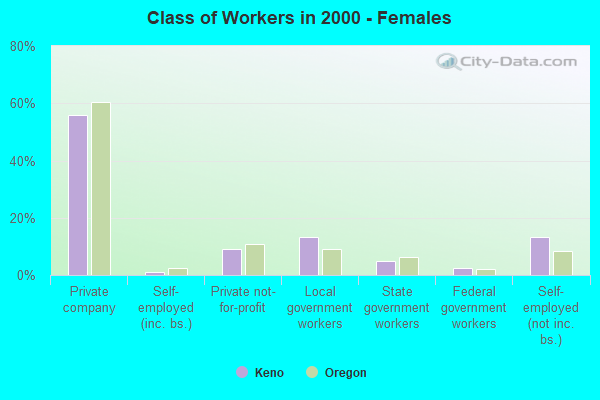
Employee of private company - Females:
| Keno: | 56.0% (361) |
| Oregon: | 60.6% (453,893) |
Self-employed in own incorporated business - Females:
| Keno: | 1.1% (7) |
| Oregon: | 2.3% (17,198) |
Private not-for-profit wage and salary workers - Females:
| Keno: | 9.1% (59) |
| Oregon: | 10.8% (80,901) |
Local government workers - Females:
| Keno: | 13.2% (85) |
| Oregon: | 9.0% (67,362) |
State government workers - Females:
| Keno: | 5.0% (32) |
| Oregon: | 6.4% (47,887) |
Federal government workers - Females:
| Keno: | 2.5% (16) |
| Oregon: | 2.1% (15,891) |
Self-employed workers in own not incorporated business - Females:
| Keno: | 13.2% (85) |
| Oregon: | 8.3% (62,118) |